
Footnotes & Flashbacks: State of Yields 2-23-25
A UST rally could use support from lower inflation and a prudent budget, but this past week had darker underlying factors.


Tricky waves to navigate with FOMC, inflation, tariffs, labor and consumer cycle.
The rally in the UST was joined by a sell-off in the equity market benchmarks and double-digit HY credit spread widening.
The next round of PCE inflation is teed up for this coming week and more information should be dribbling out on Trump’s mental mind games around tariff policy and the potential timing of a decision on Mexico and Canada.
The media shouts a lot of questions, but they should keep asking “Does the buyer pay the tariff?” in a question that is largely an affirmation of a fact. It is now right up there with “Who invaded Ukraine?” for topics that should have zero debate.

The above chart frames the multicycle yield curve migration across the cycles from the 1978 Carter inversion to the Volcker inflation fighting period, across the spring 1989 credit cycle peak ahead of hung bridge loans and broker bailouts. There was a crisis unfolding on the way into the recession of 1990 on a number of fronts from securities firms to major banks in asset classes such as real estate (notably Citibank). This sent Greenspan into a radical easing program in 1991 (see UST Moves: The 1990-1991 Risk Factor Pig Pile 10-24-23).
The chart then rolls into the TMT peak as the bubble started deflating in 2000 into an implosion and 2001 Greenspan ease-a-thon (see Greenspan’s Last Hurrah: His Wild Finish Before the Crisis 10-30-22). The housing and credit bubble year of 2006 came after a bear flattening from 2004 to 2006, and then the mid-2007 period saw the credit cycle peak ahead of the 2008 crisis that sent everything up in flames by Dec 2008.
For the curve selection above, we then jump across the ZIRP and QE years to the Oct 2023 UST peak. We then move beyond the tightening cycle as the Sept 2024 easing began. We added the Sept 2024 low point to this chart to hammer home the bounce off the lows to where we closed last week. The 3.6% 10Y UST low in mid-Sept 2024 was well below the rates seen in the earlier steepener in 2024. We have since seen a fresh bear flattener that eased this past week back to a 4.4% handle on the 10Y UST.

The above chart is updated to include the Sept 2024 low date and helps frame the journey from the Oct 2023 peak (10-19-23) on the 10Y into a major duration rally into year end 2023. The 2024 UST action was not very cooperative with the consensus forecasts for much of the year with a bear steepening and upward shift into the summer that slammed duration (see Footnotes & Flashbacks: State of Yields 6-30-24). Then came the rally into Sept 2024 and the beginning of the easing cycle that also brought a downward shift on the long end as noted in the chart (see Footnotes & Flashbacks: State of Yields 9-29-24).
The UST curve has been back in bear steepening mode but with the mixed shapeshifting on the short end tied to the Fed vs. the long end of the UST curve that dictates duration returns. The 10Y UST levels are set by the market and are not controlled by the Fed or White House “demands.”
The long end of the UST market gets to vote on how they see the impact of widespread tariffs and labor fallout from deportation. Some might see threats to the economic cycle. Others may see “reduced purchasing power” even if they play the semantics game and don’t call it inflation. A 25% increase in what the buyer pays is “something that costs more.” Call it what you will (bad policy?).
Remotely competent market participants know the buyer pays the tariff (a materially smaller slice of Washington seems to know that), but someone pays via prices or costs or reduced expenses elsewhere (which someone else feels. There is no hiding).
We always bring up the frictionless wheel and whiteboard nonsense of the hardcore tariff allies. Some of the spin is just another variation of the “Green Bay Sweep” from the Navarro types as they try to sweep the double entry accounting system from the whiteboard and say “the selling nation pays” (“collected billions and billions from China,” etc.)

The above just offers another angle on the UST migration from the end of 2021 into the tightening cycle. We include the June 2022 UST given the leap from March after the end of ZIRP. We include the dip in March 2023 when the regional bank crisis flared up for some weeks.
One notable data point was when the 10Y UST converged for year end 2023 and 2022 despite the 100 bps differential in fed funds. That was an early reminder that the long end of UST does not necessarily follow the short end and in fact can go in the other direction. Many in the fall were assuming that mortgages would follow fed funds – especially some with an equity market background.

The above chart updated the 1-week UST deltas. As we covered in the two earlier posts this weekend, this rally had more a “flight to quality” feel and some fundamental nerves (see Footnotes & Flashbacks: Asset Returns 2-23-25, Mini Market Lookback: Tariffs + Geopolitics + Human Nature = Risk 2-22-25).

The above chart updates the YTD UST deltas with a bull flattening reversing some of the earlier steepening.

The above chart updates the running UST deltas from the 10-19-23 peak date on the UST 10Y. We will retire this chart at some point, but the timeline offers a reminder of what a wild rally the UST curve saw to close out 2023 and how that happened alongside a major risky asset rally as well. Then 2024 brought another booming equity year with a UST bear steepener on the UST curve.
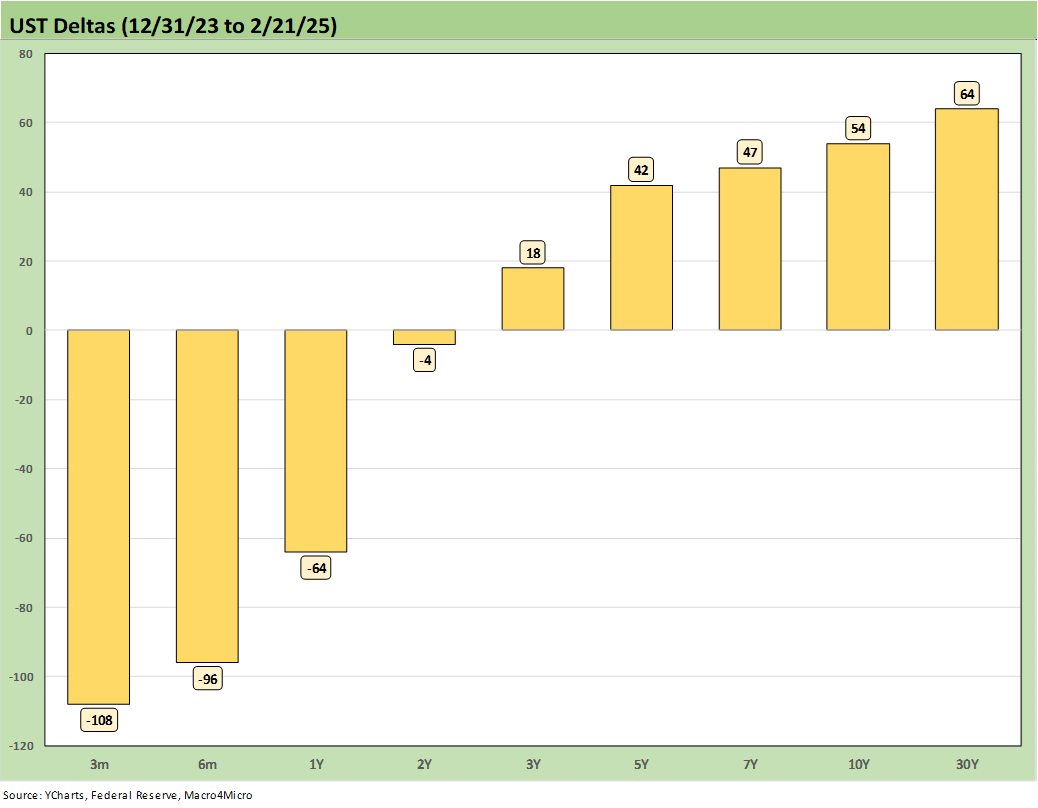
This UST delta chart starts the game clock after the Nov-Dec 2023 rally for the next leg of the journey from the start of 2024 through this past Friday. Technically it is a bear steepener but with a big rally inside 2Y UST on FOMC easing. The above pattern was still tough on duration. As an example, the long duration UST 20+Y ETF (TLT) returned -4.8% across this period vs. +4.8% for the short duration UST 1Y-3Y ETF (SHY).

The above chart plots the UST deltas since the 9-16-24 low through this past Friday. Despite the front end easing and rally, this is another bear steepener for the UST market. In this case, TLT generated -10.0% return since 9-16-24 and SHY delivered +0.5%.

The above chart updates the recent yield curve and Freddie Mac 30Y benchmark (horizontal lines). We include two useful historical comps including the end of 2005 when homebuilding peaked and one for mid-2006 as excess RMBS origination was raising flags after record mortgage origination. We include the UST curves for each key date.
Mortgage rates are higher now than 2006 despite the materially lower UST curve. The two dates are in a tight range of only around +7 bps for 30Y mortgage rates using the Freddie Mac benchmark set on Thursday at noon. We saw some surveys on Friday running slightly higher.

The above chart updates the 2Y to 10Y UST slope across time with a slight steepening on that segment this week to +23 bps. That is still well inside the long-term median of +92 bps. The maximum inversion of -108 bps came in July 2023.
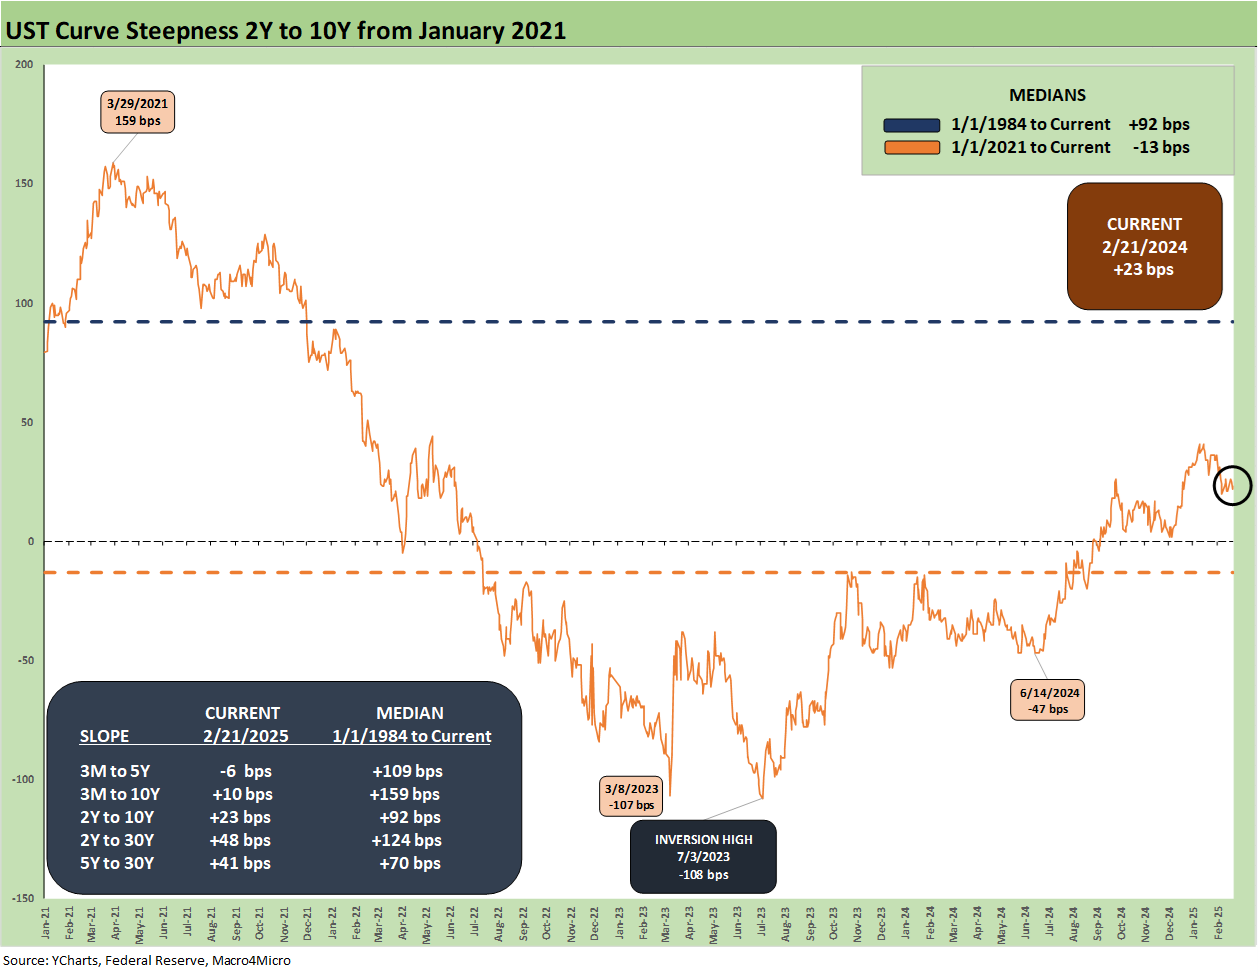
The above time series shortens up the history from early 2021 when ZIRP ruled. We see the big swings to +159 bps in March 2021 and then the plunge to -107 bps in March 2023 and then back again to -108 bps in July 2023.
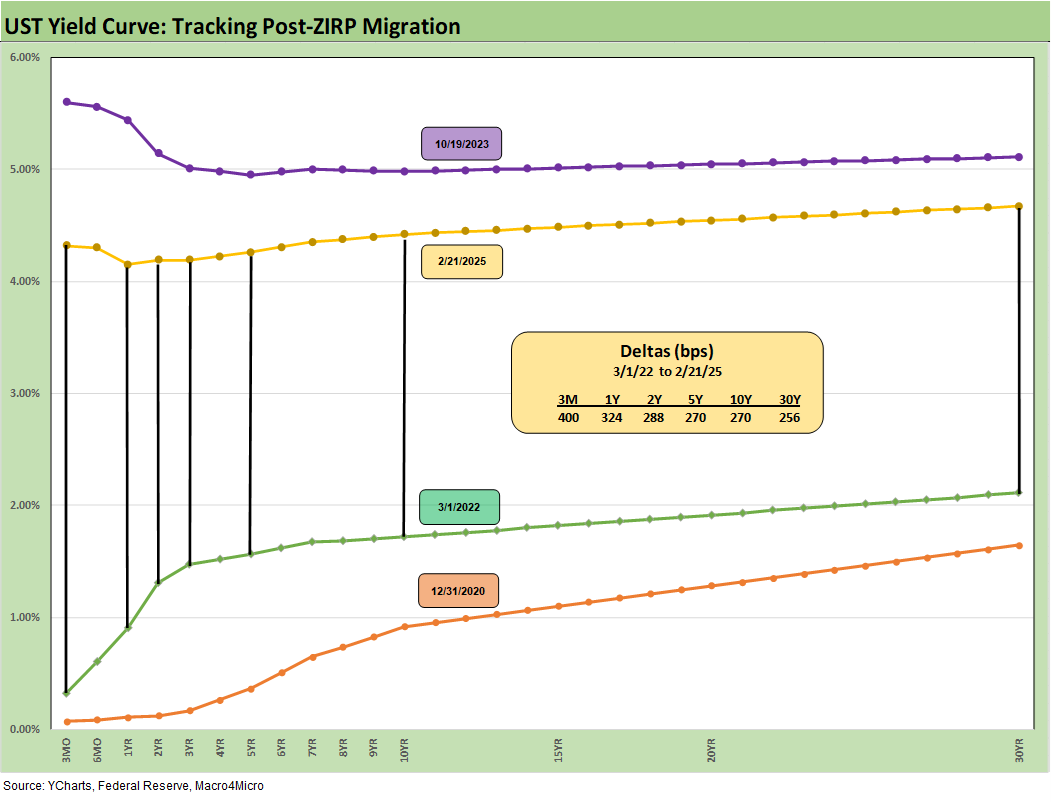
We wrap with the running UST yield curve migration and UST delta chart from March 1, 2022 in the month that ZIRP ended (effective March 17). We also include the 12-31-20 UST curve and the 10-19-23 UST when the 10Y UST peaked as frames of reference.
See also:
Footnotes & Flashbacks: Asset Returns 2-23-25
Mini Market Lookback: Tariffs + Geopolitics + Human Nature = Risk 2-22-25
Existing Home Sales Jan 2025: Prices High, Volumes Soft, Inventory Up 2-21-25
AutoNation: Retail Resilient, Captive Finance Growth 2-21-25
Toll Brothers 1Q25: Performing with a Net 2-20-25
Housing Starts Jan 2025: Getting Eerie Out There 2-19-25
Herc Rentals: Swinging a Big Bat 2-18-25
UST Yields: Sept 2024 UST in Historical Context 2-17-25
Footnotes & Flashbacks: Credit Markets 2-17-25
Footnotes & Flashbacks: State of Yields 2-16-25
Footnotes & Flashbacks: Asset Returns 2-16-25
Tariff links:
Reciprocal Tariffs: Weird Science 2-14-25
US-EU Trade: The Final Import/Export Mix 2024 2-11-25
Aluminum and Steel Tariffs: The Target is Canada 2-10-25
US-Mexico Trade: Import/Export Mix for 2024 2-10-25
Trade Exposure: US-Canada Import/Export Mix 2024 2-7-25
US Trade with the World: Import and Export Mix 2-6-25
The Trade Picture: Facts to Respect, Topics to Ponder 2-6-25
Tariffs: Questions to Ponder, Part 1 2-2-25
US-Canada: Tariffs Now More than a Negotiating Tactic 1-9-25
Trade: Oct 2024 Flows, Tariff Countdown 12-5-24
Mexico: Tariffs as the Economic Alamo 11-26-24
Tariff: Target Updates – Canada 11-26-24
Tariffs: The EU Meets the New World…Again…Maybe 10-29-24
Trump, Trade, and Tariffs: Northern Exposure, Canada Risk 10-25-24
Trump at Economic Club of Chicago: Thoughts on Autos 10-17-24
Facts Matter: China Syndrome on Trade 9-10-24