
Footnotes & Flashbacks: Credit Markets 2-24-25
We look at the spread action on the week as a double digit widening in HY spreads still stays within the goalposts of June 2007.


US Special Envoy Committee to EU ponders terms of US-EU economic relations.
The tension in geopolitics and trade will not be easing any time soon, and it only gets uglier from here in trade relations. The economic clashes are perhaps getting too colored by human nature for comfort as Germany experiences a few too many troubling memory lane moments from a far-right party embraced by the Trump team (see Mini Market Lookback: Tariffs + Geopolitics + Human Nature = Risk 2-22-25).
IG spreads have proven relatively immovable in the face of some anxiety in equities late in the week as the US bank system - a massive issuer base and credit provider - remains healthy. That financial system health bodes well for mainstream credit availability with more sources of credit in the current market than in past credit cycles.
The economy has sent only a handful of mild signals of weakness with some shaky indicators this past week undermining returns and giving a boost to the US curve (see Footnotes & Flashbacks: State of Yields 2-23-25, Footnotes & Flashbacks: Asset Returns 2-23-25). Trump trade policies and brinkmanship with allies (former or otherwise) could undermine that backdrop.
For the week, IG spreads barely moved at +1 bps wider and the same for the BBB tier while HY was +16 bps on the week and BBs +14 bps.

The above chart updates the running YTD total returns and excess returns across the IG and HY markets as well as the credit tiers. The profile of the IG returns and the tiers in a market with compressed spreads and 4.3% handle par weighted coupon in IG (vs. 4.3% on a 3M UST) is that returns in IG are a UST curve story for now.
For US HY, we still see the benefits of higher coupons (6.4% par weighted) and some spread compression YTD (-14 bps YTD), but the reality of June 2007-level spreads is that the game is still somewhat about disaster avoidance.

IG spreads remain in the double-digit happy zone at +81 bps, which is below the credit cycle lows of 2021, 2018 and 2015 and barely above the lows of spring 2005 as the housing bubble was in full swing and the overall credit market excess was building up a head of steam for unlimited counterparty and credit risk appetites into 2006 and early 2007.
It is hard to generate an IG whipsaw when the banks are doing so well with defensible performance metrics, a stock market that has richly rewarded bank equity holders, and the promise of deregulation creating a sense of euphoria around credit contraction being a very low risk.

HY OAS saw a more meaningful widening this week on the back of mixed headlines but more narrowly a Friday sell-off in equities. The Friday equity pain was starting to retrace in early Monday trading but is again fading as we go to print. That +16 bps move wider on HY OAS to close Friday sets the starting point for this week at +278 bps, which is still comfortably inside the spreads posted at the end of June 2007.
As a reminder, HY OAS lows saw +244 bps in Oct 1997 (IG had hit +53 bps). HY closed the year at +296 bps in Dec 1997. For June 2007, the HY OAS low was +241 bps on June 1, 2007 (and June 5) and then closed June 2007 at +298 bps.
The credit market is larger and the risky product menu bigger than ever with the sources of credit more diverse across institutional lenders (banks) and asset managers (private equity, loan funds, BDCs, etc.) Whether easy credit becomes the problem it has been across history is one question, but the second question is where that easy credit is located. For some, the threat of systemic risk has increased with private credit. We don’t see it that way since much of that credit in direct terms is outside the core of the bank system. Secondary and tertiary effects on risk pricing is a separate debate.
You can’t outlaw bad investments that are mispriced in any market, but the “late cycle crazy deal flow” of past HY bond origination cycles is not a main event in this cycle. That is a good thing. We can see plenty of excess in equity valuations, but the credit excess in the bond markets is in check.
For many, systemic risk has been mitigated by the rise of private credit since the most aggressive deals are not in the HY bond market (i.e. redemption risk and illiquidity-driven volatility setting off chain reactions) but over in private equity supported by committed outside capital. That is, at least partly outside the more tender organs of the bank system.
There is some solace in knowing that some of the best people in the credit markets are manning those private credit commitments and want that asset base to be a lucrative growth vehicle. It is not like the churn’em and burn’em (but sell’em) mode of structured credit during the RMBS years. Those years served to turbocharge bank interconnectedness risk. That “connected” element is still one to consider. At least that is the theory.
We should always look out for the banks trying to find the back door into those structures. As always, they will find them even if it is at the loan levels to private credit entities, via counterparty risk in derivatives, or developing products for their wealth management units.

This time series updates the “HY OAS minus IG OAS” which stood at +197 bps. That number remains in the rarefied sub-200 bps zone not seen since June 2007. We saw quality spreads widen on the week with the HY mini-gap set against a stable IG market.

The “BB OAS minus BBB OAS” quality spread differential also widened this week to +72 bps with BBs wider by +14 bs and BBB only +1 bps. The +72 bps is still a very long way from the +134 bps long-term median.

The +173 bps OAS for the BB tier is still well inside the rare +200 bps line despite the +14 bps widening on the week (+11 bps of that on Friday). The long-term BB OAS median of +299 bps sets a bar that is +126 bps away.

The B tier as the sweet spot of HY Classic investing is at +277 bps. That is below the rarely crossed +300 bps line (it was crossed in 2007 and 1997). The B tier is above the +254 bps lows from Nov 2024 but -189 bps inside the long-term median.

The above chart updates the comparative histories of the B tier and CCC tier and highlight some of the dramatic points of divergence between the two. The current +734 bps (vs. +955 bps long-term median) on the CCC tier is always subject to the constituent migration patterns including dropouts (defaults) and exchanges (coercive or otherwise) that can move the needle (see The B vs. CCC Battle: Tough Neighborhood, Rough Players 7-7-24).
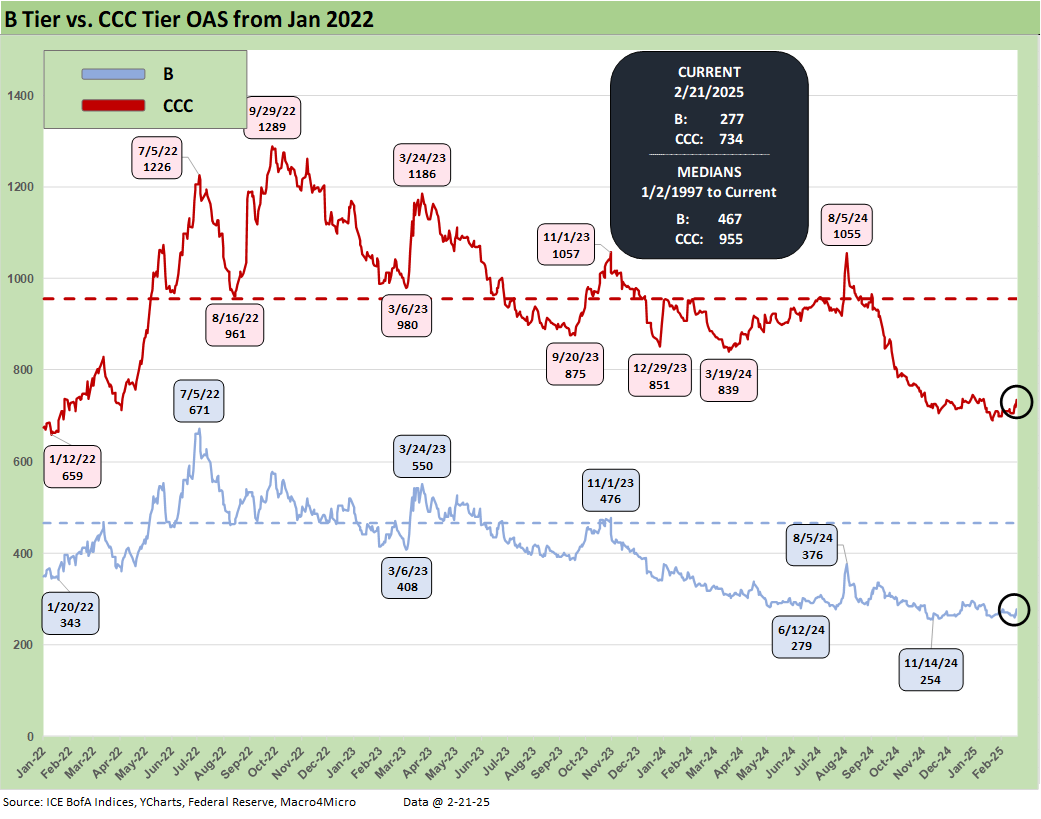
The above chart shortens the timeline from the period just before the March 2022 tightening cycle for better visuals on more recent B vs. CCC OAS action.

The long-term quality spread differential of “CCC OAS minus B OAS” of +457 bps is inside the +482 bps long-term median and has narrowed impressively since the peak cyclical anxiety period of the tightening cycle in fall 2022. Some of that tightening is tied to exits and some to distressed exchanges but also to a broader risk asset rally that is mirrored in equities and other credit markets.
The +457 bps quality spread differential looks like many of the timeline medians broken out in the box with the notable exception of the TMT bubble and collapse of that market into early 2001.

The above chart zeroes in on the 2022-2025 timeline for the CCC-B tier quality spread differential. The constituent shifts across some notable exchanges and dropouts and major credit rally are evident in multiple material swings along the way. Executing on distressed exchanges has generated its share of headlines (e.g. Carvana) but much less than would have been seen if inflation had held in longer and even more tightening was needed.
A look at yields…
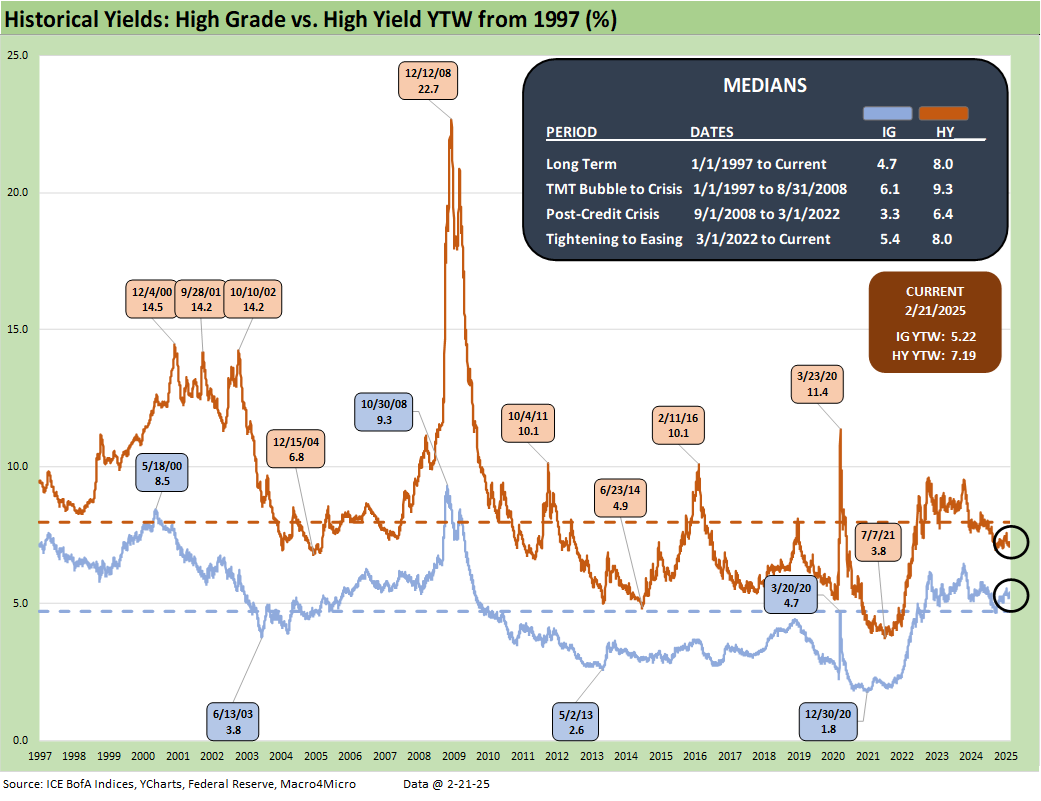
The HY index and IG index yield histories swung around with the credit cycles but were notably distorted across the ZIRP and QE years after late 2008. We believe the pre-ZIRP years are the most appropriate for long-term median comparison. We have made the case that the 9.3% pre-crisis (pre-ZIRP) median for HY and 6.1% in IG make for the most relevant frames of reference. That is backed up by framing median spreads vs. current spreads and index yield benchmarks.
Current yields reflect the low UST levels relative to past cycles as well as historically tight spreads. Median spreads would put all-in yield in HY closer to pre-crisis medians, so that is a frame of reference for historical context.

The above chart frames IG index yields and the related UST curve for the Friday close and for two useful comps from prior credit cycle peaks in June 2007 and Dec 1997 when credit markets were hot and spreads down near multiyear lows. For IG yields, the story is all about the UST curve differentials with spreads tight in all three markets.

The above chart does the same drill as the prior chart but for HY index yields. The low UST curve vs. history and extremely tight spreads put the current HY index yield below the earlier peak credit cycles.
See also:
Footnotes & Flashbacks: State of Yields 2-23-25
Footnotes & Flashbacks: Asset Returns 2-23-25
Mini Market Lookback: Tariffs + Geopolitics + Human Nature = Risk 2-22-25
Existing Home Sales Jan 2025: Prices High, Volumes Soft, Inventory Up 2-21-25
AutoNation: Retail Resilient, Captive Finance Growth 2-21-25
Toll Brothers 1Q25: Performing with a Net 2-20-25
Housing Starts Jan 2025: Getting Eerie Out There 2-19-25
Herc Rentals: Swinging a Big Bat 2-18-25
UST Yields: Sept 2024 UST in Historical Context 2-17-25
Footnotes & Flashbacks: Credit Markets 2-17-25
Footnotes & Flashbacks: State of Yields 2-16-25
Footnotes & Flashbacks: Asset Returns 2-16-25
Tariff links:
Reciprocal Tariffs: Weird Science 2-14-25
US-EU Trade: The Final Import/Export Mix 2024 2-11-25
Aluminum and Steel Tariffs: The Target is Canada 2-10-25
US-Mexico Trade: Import/Export Mix for 2024 2-10-25
Trade Exposure: US-Canada Import/Export Mix 2024 2-7-25
US Trade with the World: Import and Export Mix 2-6-25
The Trade Picture: Facts to Respect, Topics to Ponder 2-6-25
Tariffs: Questions to Ponder, Part 1 2-2-25
US-Canada: Tariffs Now More than a Negotiating Tactic 1-9-25
Trade: Oct 2024 Flows, Tariff Countdown 12-5-24
Mexico: Tariffs as the Economic Alamo 11-26-24
Tariff: Target Updates – Canada 11-26-24
Tariffs: The EU Meets the New World…Again…Maybe 10-29-24
Trump, Trade, and Tariffs: Northern Exposure, Canada Risk 10-25-24
Trump at Economic Club of Chicago: Thoughts on Autos 10-17-24
Facts Matter: China Syndrome on Trade 9-10-24
Select Histories:
Annual and Monthly Asset Return Quilt 2024 Final Score 1-02-25
Spread Walk 2024 Final Score 1-2-25
HY and IG Returns since 1997: Four Bubbles and Too Many Funerals 12-31-24
HY OAS Lows Memory Lane: 2024, 2007, and 1997 10-8-24
The B vs. CCC Battle: Tough Neighborhood, Rough Players 7-7-24
HY Spreads: Celebrating Tumultuous Times at a Credit Peak 6-13-24
Credit Markets Across the Decades 4-8-24
Credit Cycles: Historical Lightning Round 4-8-24
Histories: Asset Return Journey from 2016 to 2023 1-21-24
HY Multicycle Spreads, Excess Returns, Total Returns 12-15-23
HY Credit Spreads: Migration, Medians, and Misdirection 11-6-23
Credit Spreads: Proportions Matter in Risk Compensation 8-14-23
Fed Funds vs. Credit Spreads and Yields Across the Cycles 6-19-23
Wild Transition Year: The Chaos of 2007 11-1-22
Greenspan’s Last Hurrah: His Wild Finish Before the Crisis 10-30-22