
Market Commentary: Asset Returns 11-23-25
The asset return scoresheet had a bad week with more lines in the red for 1-month returns than we have seen for some time.


Just one more FOMC meeting…
The YTD numbers are solid but the large cap benchmarks such as S&P 500 and NASDAQ are likely to see a material shortfall from the total return for calendar 2025 vs. those posted in 2024. The Russell 2000 small caps have a better shot at beating 2024.
The rolling 1-month timeline returns for debt and equity benchmarks posted a heavy mix of negative numbers with small caps and growth showing setbacks for the month.
For the trailing 1-year, credit is starting to lag with HY back to a 7% handle while the tech heavy equity indexes are in double digits.
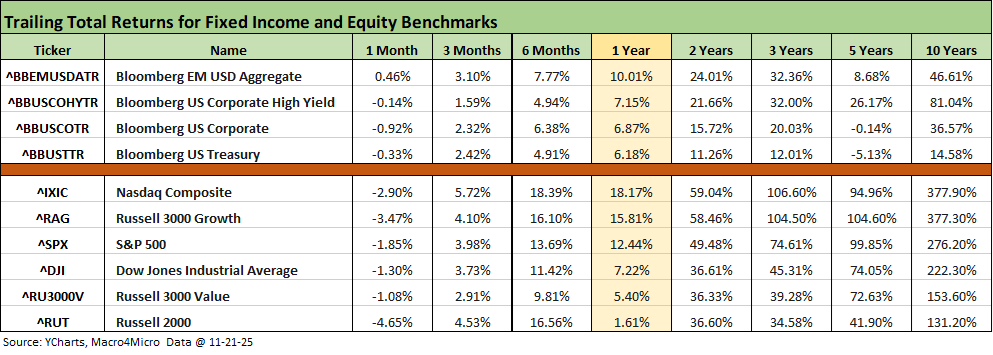
The above table updates the total returns for the high-level debt and equity benchmarks we watch each week, and this was one of the worst 1-month return profiles in recent memory. Both debt and equities saw a lot of negative numbers despite the UST rally this week. The 1-month time frame does not a trend make, but modest credit market weakness and some volatility in equities has roiled November.
We see 3 of 4 debt benchmarks in the red for 1-month and all 6 equity indexes and subsectors on the list generating negative returns. Small caps and growth were hit the hardest with the S&P 500 and Dow slightly negative. For debt, UST, IG, and HY were all slightly negative. Looking back 3 months, the same lines are all positive.
The rolling return visual
In the next section, we get into the details of the 32 ETFs and benchmarks for a mix of trailing periods. Below we offer a condensed 4-chart view for an easy visual on how the mix of positive vs. negative returns shape up. This is a useful exercise we do each week looking for signals across industry groups and asset classes.
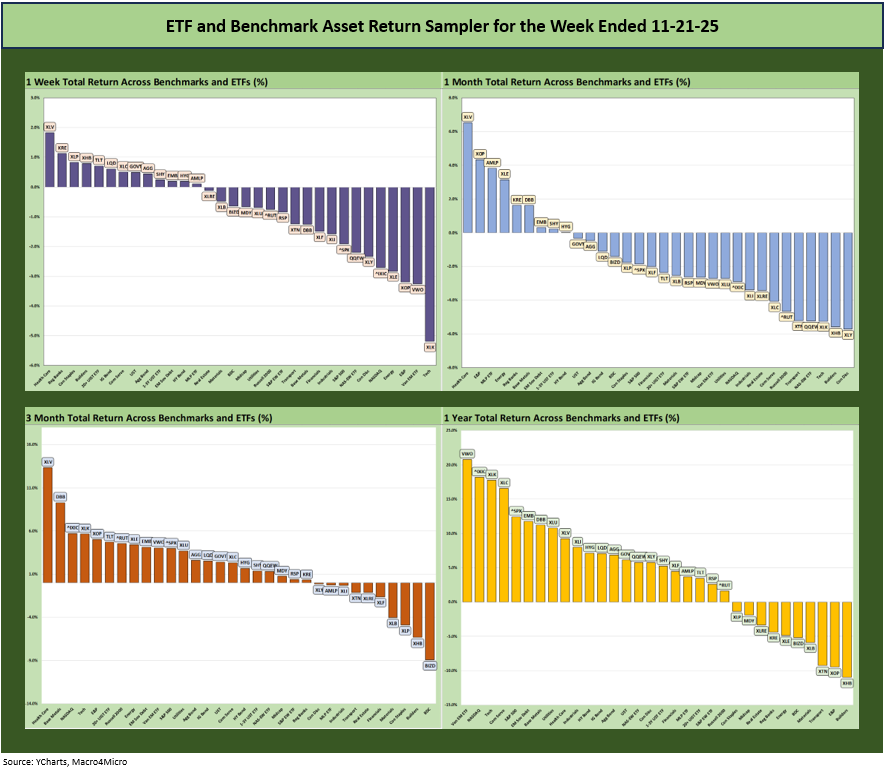
The positive vs. negative symmetry continues to shift and change the look of the benchmark and ETF returns as the UST curve dynamics confuse and tech valuation bears get noisier. The market reaction to the NVIDIA earnings and how it turned so quickly was headline material but the wild swings in the FedWatch odds-making for fed funds got less airtime.
The scarcity of macro data has not helped. Neither has the disinformation flowing along with the political toxins spewing from the big mouths and empty heads in Washington. The recovery of the macro data release process should be straightforward, but the intent of policy makers and top-down governance is highly suspect these days.
We do not include the YTD return bar chart above (see below), but the scoresheet is the best one for that timeline at 29-3. The S&P 500 YTD is sobering at +13.6% after back-to-back annual returns clearing the 25% line in 2023 and 2024. The NASDAQ at +16.0% YTD has to reach the 29.6% mark to beat 2024. That will need an outrageous finish for the NASDAQ in December 2025 to hit that mark.
The Magnificent 7 heavy ETFs…
Some of the benchmarks and industry ETFs we include have issuer concentration elements that leave them wagged by a few names. When looking across some of the bellwether industry and subsector ETFs in the rankings, it is good to keep in mind which narrow ETFs (vs. broad market benchmarks) get wagged more by the “Magnificent 7” including Consumer Discretionary (XLY) with Amazon and Tesla, Tech (XLK) with Microsoft, Apple, and NVIDIA, and Communications Services (XLC) with Alphabet and Meta.
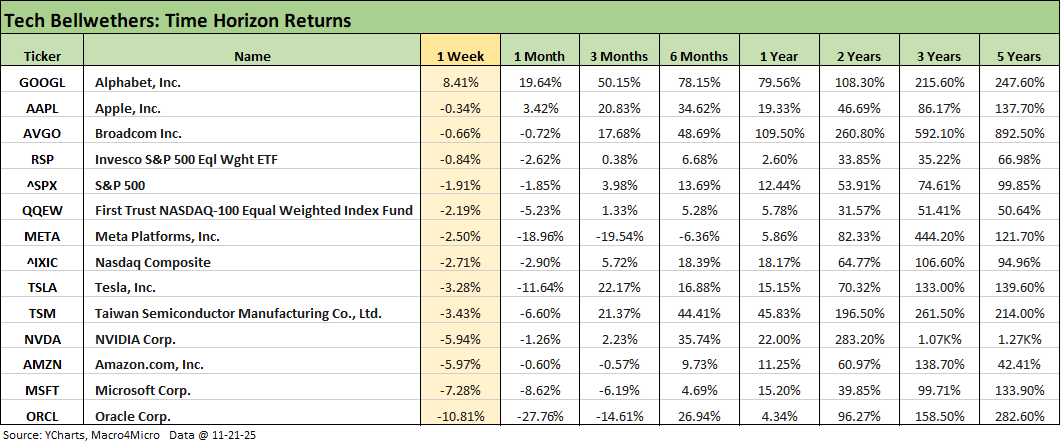
We already looked at the tech bellwethers in our Mini Market Lookback: FOMC Countdown (11-23-25). With 6 of the Mag 7 in negative range and 9 of the “Mag 7+ 3” (including Broadcom, Taiwan Semi and Oracle) also in the red, the numbers clearly show a bad week. With only 2 of the 10 posting positive returns for 1-month, it has been a shaky period. The rolling 3-month returns frame up better but in a very wide range.
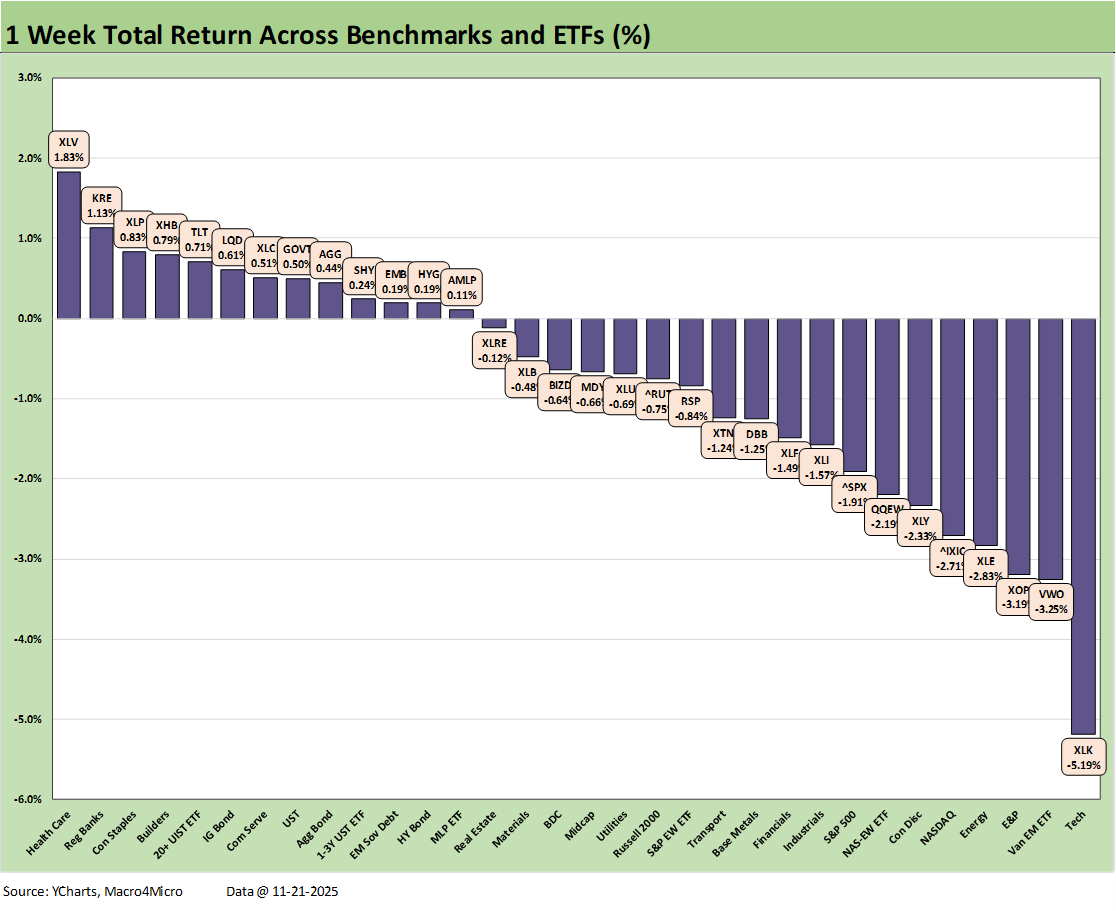
We already looked at the 1-week returns for the 32 benchmarks in our Mini Market Lookback: FOMC Countdown (11-23-25). With a positive vs. negative score of 13-19, the shift is there but with all 7 bond ETFs in positive range.
We see 3 bond ETFs in the top quartile and some interest rate sensitive ETFs in the top quartile with Regional Banks (KRE), Consumer Staples (XLP), and Homebuilders (XHB). The bond ETFs were also in the top 4 slots of the second quartile.
The bottom quartile for the week saw 5 of the lines wagged by the tech sell-offs with the weightings in the NASDAQ and S&P 500 along with QQEW and XLK on the bottom and some Mag 7 influence undermining Consumer Discretionary (XLY) with Tesla, Amazon, and Home Depot feeling pressure. Energy (XLE, XOP) felt the worries around oil prices if Trump actually sells out Ukraine. That would help his inflation numbers at least.
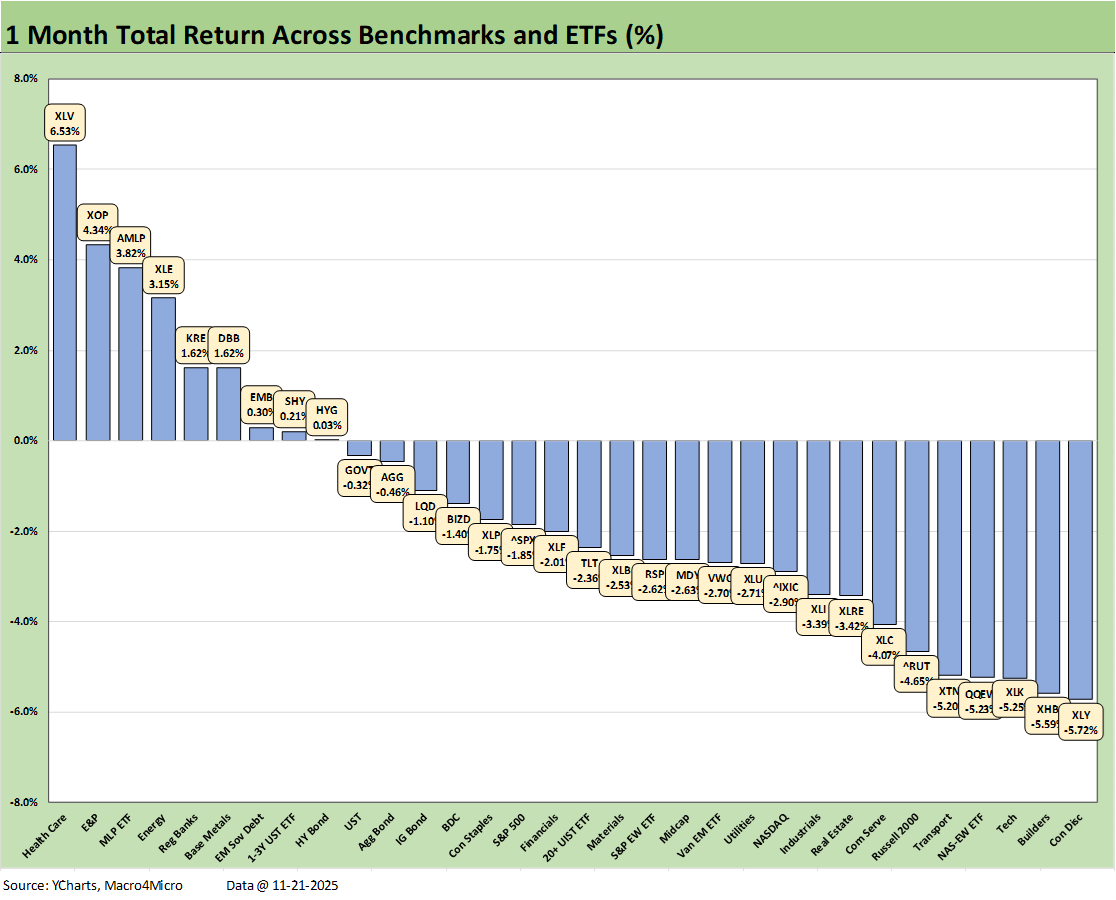
The 1-month numbers were grim at a score of 9-23 with 5 of 7 bond ETFs in the red. In the bottom quartile we see the heavy influence of tech and with the small cap Russell 2000 also getting hit hard in a sign of cyclical worries.
In the upper ranks, the volatile energy sector had a good month despite the past week posting weak numbers. The Health Care ETF (XLV) in the top quartile was riding the pharma rally. We also see the EM Sovereign Bond ETF (EMB) and short UST ETF (SHY) in the top quartile.

The 3-month timeline posted a score of 22-10 with Health Care (XLV) at #1 followed by Base Metals (DBB) with some tech in the top 5 with NASDAQ and XLK. E&P (XOP) made the top 5 with XLE in the top quartile. The long-duration UST ETF (TLT) was a notable member of the top quartile as was the small cap Russell 2000 with the long duration UST ETF (TLT).
The BDC ETF (BIZD) took a beatdown in last place at -8.9% on the private credit noise. The TLT in the top quartile was mirrored in the low quartile by weak numbers for Homebuilders (XHB), Materials (XLB), Real Estate (XLRE), and Consumer Staples (XLP).
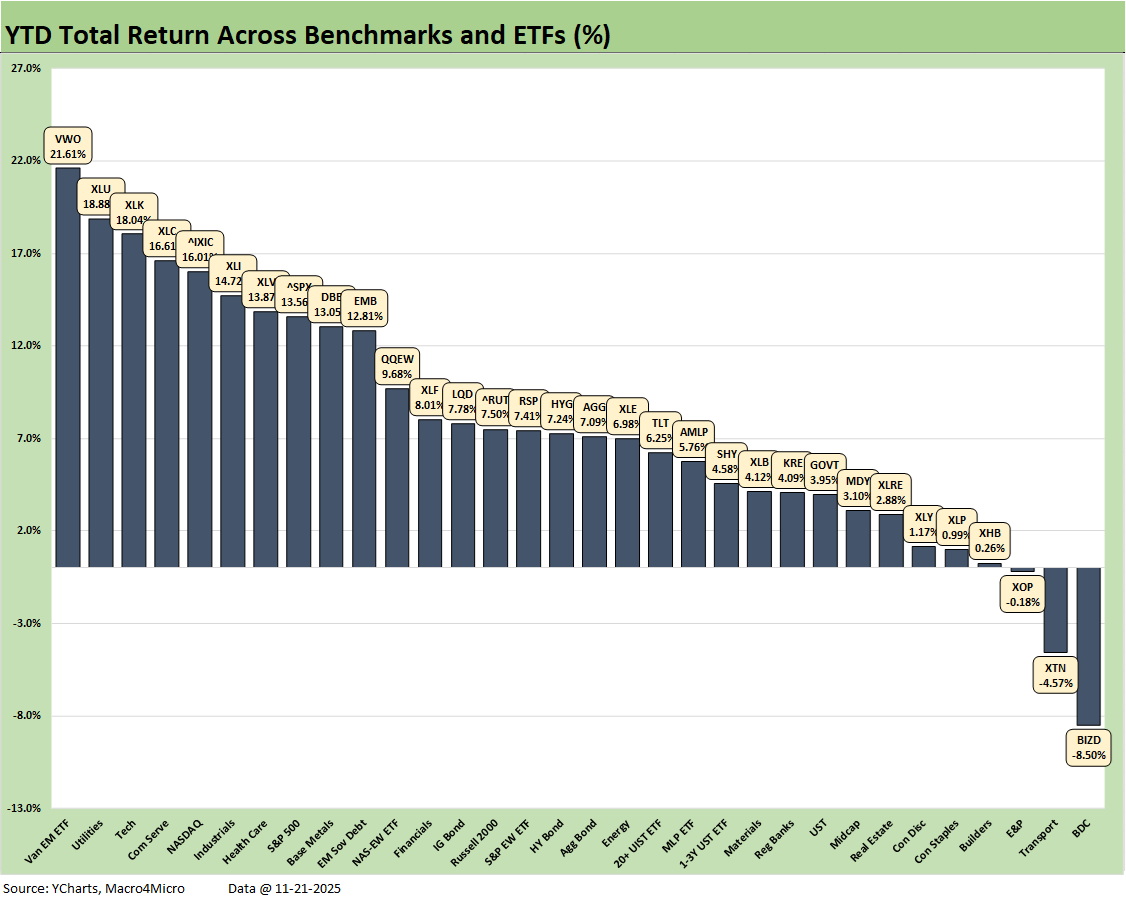
The YTD timeline returns posted the best score at 29-3 with BDCs on the bottom joined in the red zone by Transports (XTN) in the year of tariffs. E&P (XOP) was barely negative. The bottom quartile included Homebuilders (XHB) on stubborn mortgage rates and Real Estate (XLRE).
The winners included EM Equities (VWO) as those equities rode the dollar weakness as we cover in our trade partner comp separately (see Mini Market Lookback: FOMC Countdown 11-23-25).
The YTD leaders still have a lot of tech and tech-influenced with Tech ETF (XLK), Communications Services (XLC), NASDAQ, and the tech-heavy S&P 500. Utilities (XLU) has been a winner this year on fundamentals as well as rates while Industrials (XLI) offered a reassuring performance on the steady cycle in autos, aerospace & defense, and capital goods, among others. Health Care (XLV) also worked its way up into the upper ranks as the year proceeded.
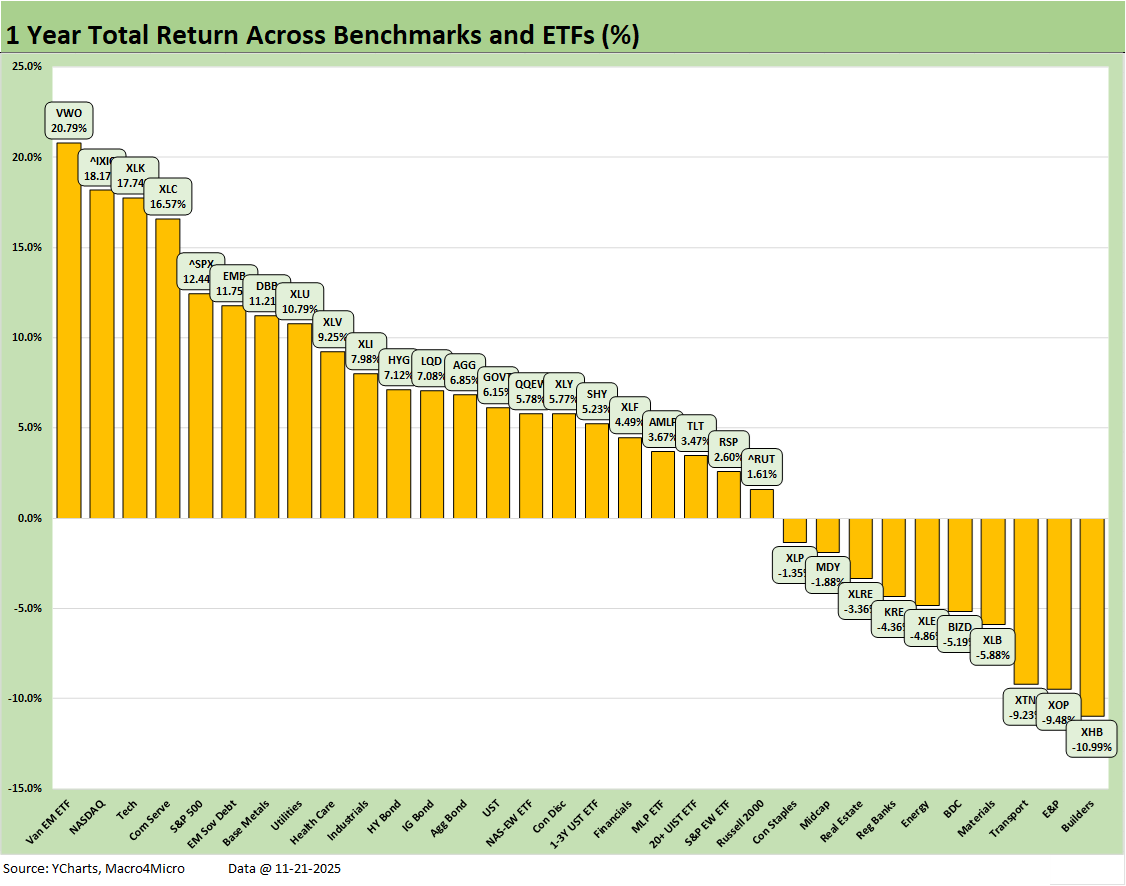
The LTM score was 22-10 with a Hi-Lo range of almost 32 points from EM Equities (VWO) at #1 to Homebuilders (XHB) in last place at #32. We see 4 of the top 5 with a heavy tech influence from #2 to #5 with NASDAQ, XLK, XLC and the S&P 500.
As already covered, the S&P 500 will need to finish 2025 in impressive fashion to match the 2024 and 2023 S&P 500 returns. The year 2024 was Part Two of the best 2-year run in the S&P 500 since the late 1990s, so that sets a high bar for the Trump stock market (see Footnotes & Flashbacks: Asset Returns for 2024 1-2-25). This year will likely not clear that bar.
The bond ETFs were all positive with EM Sovereigns (EMB) in the top quartile. We see 4 in the second quartile with HYG, LQD, AGG, and GOVT. In the third quartile was the “duration barbell” of SHY and TLT.
See also:
Mini Market Lookback: FOMC Countdown 11-23-25
Employment Sept 2025: In Data We Trust 11-20-25
Payrolls Sep25: Into the Weeds 11-20-25
Credit Markets: Show Me the Data 11-17-25
The Curve: Slopes Can Get Complicated 11-16-25
Mini Market Lookback: Tariff Policy Shift Tells an Obvious Story 11-15-25
Retail Gasoline Prices: Biblical Power to Control Global Commodities 11-13-25
Credit Markets: Budget Armistice or GOP Victory Day? 11-12-25
Simplifying the Affordability Question 11-11-25
The Curve: Back to the Future 11-9-25
Market Commetary: Asset Returns 11-9-25
Mini Market Lookback: All that Glitters… 11-8-25
Mini Market Lookback: Not Quite Magnificent Week 11-1-25
Synchrony: Credit Card Bellwether 10-30-25
Existing Home Sales Sept 2025: Staying in a Tight Range 10-26-25
Mini Market Lookback: Absence of Bad News Reigns 10-25-25
CPI September 2025: Headline Up, Core Down 10-24-25
General Motors Update: Same Ride, Smooth Enough 10-23-25
Mini Market Lookback: Healthy Banks, Mixed Economy, Poor Governance 10-18-25
Mini Market Lookback: Event Risk Revisited 10-11-25
Credit Profile: General Motors and GM Financial 10-9-25
Mini Market Lookback: Chess? Checkers? Set the game table on fire? 10-4-25
JOLTS Aug 2025: Tough math when “total unemployed > job openings” 9-30-25
Mini Market Lookback: Market Compartmentalization, Political Chaos 9-27-25
PCE August 2025: Very Slow Fuse 9-26-25
Durable Goods Aug 2025: Core Demand Stays Steady 9-25-25
2Q25 GDP Final Estimate: Big Upward Revision 9-25-25
New Homes Sales Aug 2025: Surprise Bounce, Revisions Ahead? 9-25-25
Mini Market Lookback: Easy Street 9-20-25
Home Starts August 2025: Bad News for Starts 9-17-25
Industrial Production Aug 2025: Capacity Utilization 9-16-25
Retail Sales Aug 2025: Resilience with Fraying Edges 9-16-25
Mini Market Lookback: Ugly Week in America, Mild in Markets 9-13-25
CPI August 2025: Slow Burn or Fleeting Adjustment? 9-11-25
PPI Aug 2025: For my next trick… 9-10-25
Mini Market Lookback: Job Trends Worst Since COVID 9-6-25