
Footnotes & Flashbacks: Credit Markets 11-18-24
The credit markets experienced a slight widening in a week that was more eventful in politics and economic releases.


A few more from the Fox crowd and we will have a Joint Chiefs team…
Spreads widened slightly and are still in the neighborhood of multicycle and multidecade lows with equities waiting for more catalysts before deciding to dial back allocations in a world where bonds seem vulnerable to inflation despite easing on the front end.
A circus of appointments this past week was a setback for those who had hopes for a higher road overhaul of critical US government functions, but it will take time for this to play out unless the Senate washes its hands of its constitutional duties. That is when Personnel=Policy =Economics will start to come into play for major industries such as Defense and Health Care (and Pharma) at the micro level among others.
In the meantime, the trade/tariffs and deportation risks have not taken hold – yet – in risky assets as the wagons are circling waiting for more tangible and specific inputs. The market hope is that the risk of triggering recession or inflation will deter Trump from excess on that front since elections have a history that is unkind to the party in charge after recession and inflation and his legislative ambitions could die in fall 2026.
On the most controversial and least qualified critical picks, the risks are much lower for the Senate to reject Gaetz and RFK Jr while Hegseth at Defense might jeopardize a GOP politician’s access to the right wing media and the conservative channels of Fox (see Footnotes & Flashbacks: Asset Returns 11-17-24). Even worse, the primary opponent selected by Trump to depose a Senator would get Fox backing. Add in the Musk clout on X and the Senate courage quotient might be hard to come by with an already-low starting point.

The above chart updates the running excess returns and total returns YTD for IG and HY as well as the credit tiers. Less duration and higher credit risk remain the winners.
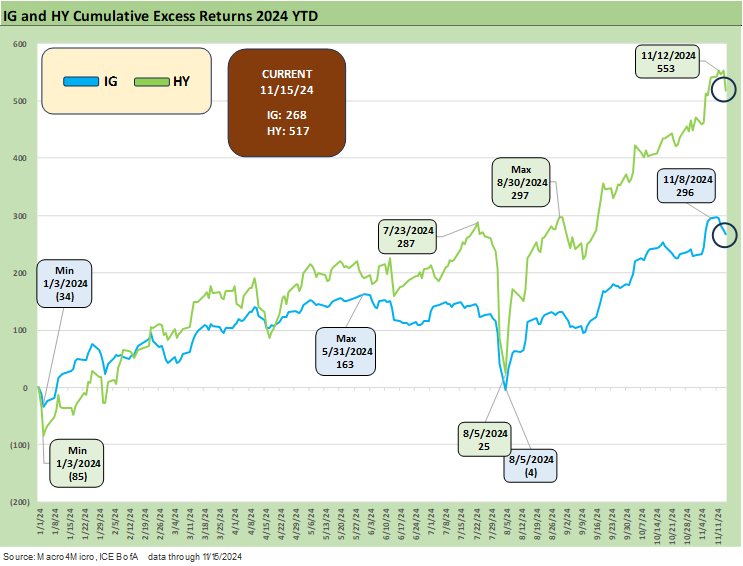
The above chart updates the running excess returns for IG vs. HY with credit risk maximization still the winning formula in 2024 in a rally that kicked into high gear in Nov-Dec 2023 and mostly stayed the course as HY spreads rode to multi-decade lows (see HY OAS Lows Memory Lane: 2024, 2007, and 1997 10-8-24).
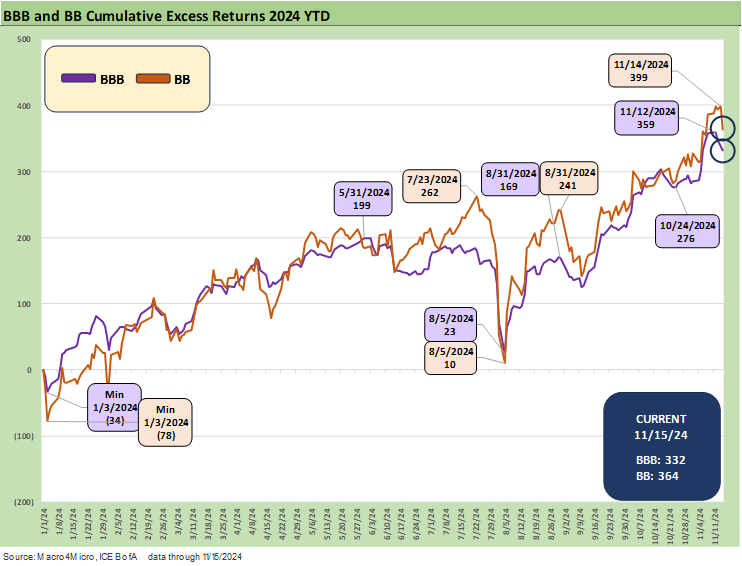
The update for the running BBB vs. BB excess returns shows the run rate down from the recent peaks but still strong on tighter spreads over recent months and the slow climb in coupons on refinancing or new money issuance in the post-tightening market.

The B vs. CCC excess return relationship shows the rewards of bullish risk appetites and favorable constituent migration changes and post-distressed exchange lineup as the year unfolded. The history of HY setbacks was often written on the back of late cycle deal excess, and those have not been the norm in HY bonds this time around. Private credit is the more PE deal-friendly and logical place given the ability to control the risk pricing without all the transparent volatility.
That shifting in allocation from HY bonds to private credit in theory materially reduces some of the “bottomless CCC” and “falling knife” price risk that comes with HY fund outflows across credit cycles when highly visible deal setbacks drive repricing. The risks are exponentially higher in CCC than the B tier with respect to long- term average default risk, but this realignment eases some of the historical B vs. CCC spread (or dollar price) gap risks in HY seen in prior credit cycle swoons (see The B vs. CCC Battle: Tough Neighborhood, Rough Players 7-7-24).

IG spreads widened by 3 bps on the week to a still-extremely-low +80 bps. Such spread levels take recent days back in this cycle to “lower lows” than seen in the post-crisis years as noted in the chart.

We have spent plenty of time revisiting prior credit cycle lows and this current pricing backdrop is like June 2007 (see HY OAS Lows Memory Lane: 2024, 2007, and 1997 10-8-24, HY Spreads: Celebrating Tumultuous Times at a Credit Peak 6-13-24 ). That 2007 period ended up as a bubble with the credit ratings tier mix lower and the deals on the low end more ambitiously leveraged in 2007.

The quality spread differentials stayed extremely tight as detailed in the Mini Market Lookback: Reality Checks (11-16-24). The +192 bps quality spread differential is modestly inside the +200 threshold, which is rare as the chart details.
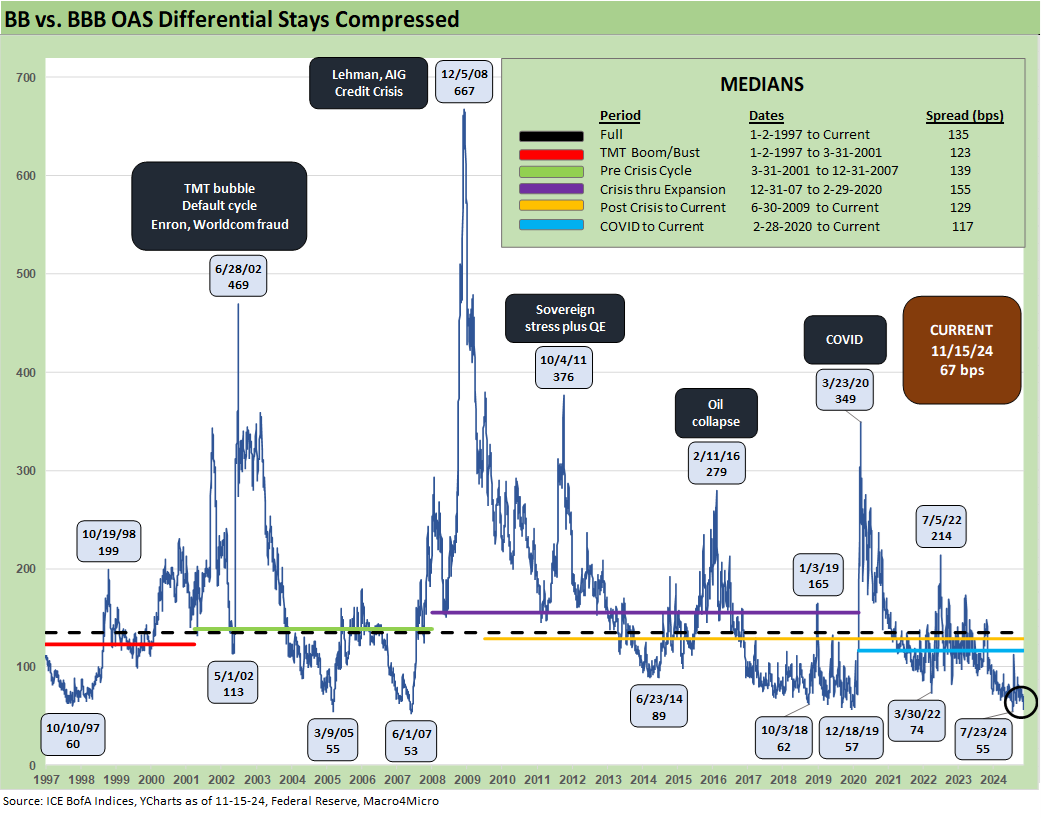
The above chart updates the “BB OAS minus BBB OAS” quality spread differential. At +67 bps, it is +7 bps wider and off the +55 bps lows seen in July.

The BB tier OAS widened by +10 bps on the week to +168 bps with essentially all of that on Friday (+11 bps). BB hit +157 bps on Thursday before the +11 bps widening. That move wider takes the BB tier OAS to -37 bps tighter YTD and -12 bps for the MTD period. We are well below the long-term and post-crisis medians of +300 bps and +304 bps respectively.

The B tier has been a key driver of spread compression in the core credit tier of the traditional HY market. For the week, B tier OAS was wider by +11 bps with +15 bps of that on Friday. That takes YTD B tier OAS contraction to -72 bps. Before the Friday widening, the B tier had hit a low of +254 at close on Thursday.

The above chart plots the B tier history vs. CCC to highlight the major swings across a period that included a credit bubble, a financial systemic crisis, and a pandemic.
The radical divergence of the CCC and B tiers from time to time make a statement on how equity-like risk and extreme volatility can kick into gear and turn CCCs into “high risk equities with coupons.” We have covered some of these histories in these commentaries (see The B vs. CCC Battle: Tough Neighborhood, Rough Players 7-7-24).
For this week, we saw the CCC tier move only +4 bps wider to take YTD compression to -177 bps on a combination of spread tightening and constituent mix changes.

The above chart shortens the timeline to the start of 2022 for a better granular view of the swings in the B tier vs. CCC tier. We see the peak CCC tier OAS during the worst of the inflation and rapid tightening. The road from +1200 bps handles to +725 bps was bumpy and came with some debt exchanges and moving targets in the issuer mix.
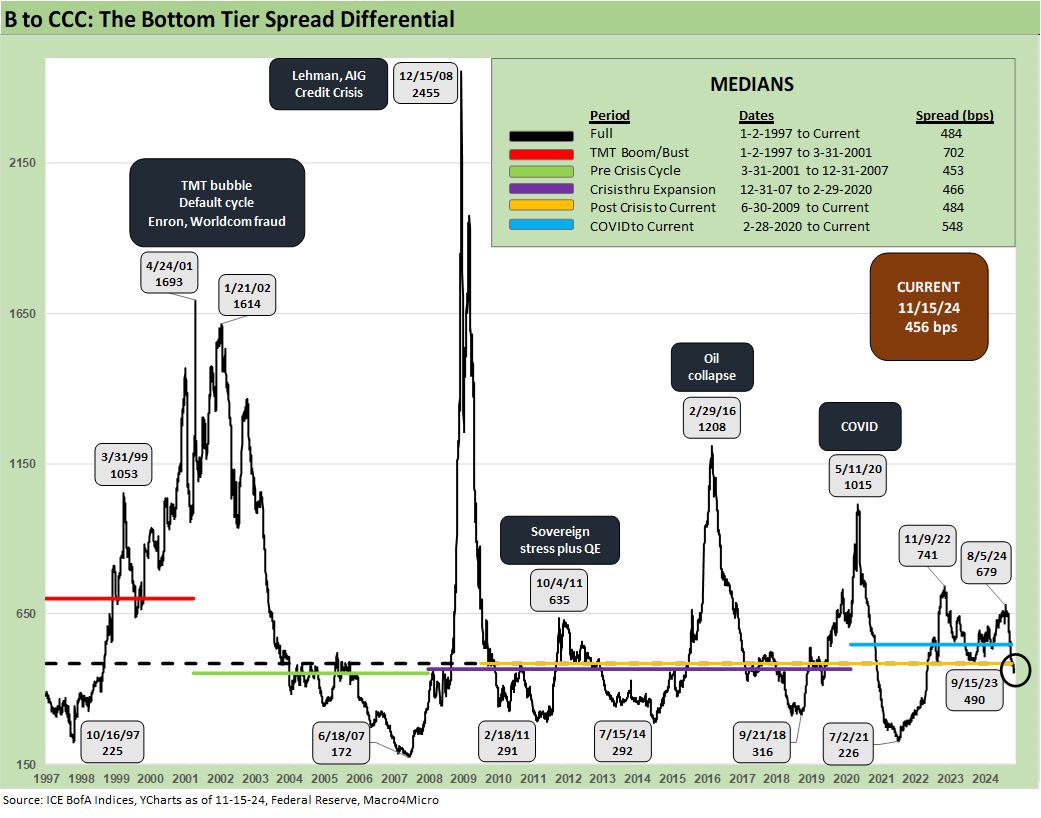
The above chart updates the long-term running CCC OAS minus B OAS quality spread differentials with the recent +456 bps modestly inside the long-term median of +484 bps.

With IG and HY spreads extremely tight and all-in yields low on the back of what are still extremely low UST rates even after the YTD setbacks on the UST curve shift, the all-in yield for IG YTW of 5.26% and HY YTW of 7.31% stack up as quite low from a few angles.
The long-term medians from 1997 are +4.7% for IG and +8.0% for HY, but that includes almost 14 years of ZIRP and brief normalization policies by the Fed. The more relevant comparison to us is the +6.1% for the IG median pre-ZIRP and pre-crisis and +9.3% in HY.
The current backdrop of slow easing in a post-inflation and post-tightening world are “remotely normal” in FOMC policy frameworks before a global systemic bank crisis turned the yield curve world on its head. We will see what abnormal events take hold for the Fed in 2025-2026 as the new administration seems determined to overhaul the Fed and FOMC “Project 2025 style.”

The above chart updates our weekly comparison of the IG YTW vs. prior credit cycle peaks in June 2007 and late 1997. We also include the UST curves for the same dates. IG yields are driven by the exceptionally low UST curve in this market that also sees some of the tightest spreads experienced across the cycles with the exception of fall 1997 as detailed earlier in this commentary.

We do the same exercise for HY YTW that we do for IG in the prior chart. The lower UST curve stands out from earlier credit cycle peaks with similar spread lows seen in those earlier markets of June 2007 and Dec 1997.
See also:
Footnotes & Flashbacks: State of Yields 11-17-24
Footnotes & Flashbacks: Asset Returns 11-17-24
Mini Market Lookback: Reality Checks 11-16-24
Industrial Production: Capacity Utilization Circling Lower 11-15-24
Retail Sales Oct 2024: Durable Consumers 11-15-24
Credit Crib Note: United Rentals (URI) 11-14-24
CPI Oct 2024: Calm Before the Confusion 11-13-24
Footnotes & Flashbacks: Credit Markets 11-12-24
Footnotes & Flashbacks: State of Yields 11-11-24
Footnotes & Flashbacks: Asset Returns 11-10-24
Mini Market Lookback: Extrapolation Time? 11-9-24
The Inflation Explanation: The Easiest Answer 11-8-24
Fixed Investment in 3Q24: Into the Weeds 11-7-24
Morning After Lightning Round 11-6-24
Payroll Oct 2024: Noise vs. Notes 11-2-24
All the Presidents’ Stocks: Beware Jedi Mind Tricks 11-1-24
PCE Inflation Sept 2024: Personal Income and Outlays 10-31-24
Employment Cost Index Sept 2024: Positive Trend 10-31-24
3Q24 GDP Update: Bell Lap Is Here 10-30-24
The Politics of Objective GDP Numbers: “Flex Facts” on Growth 10-30-24
JOLTS Sept 2024: Solid but Lower, Signals for Payroll Day? 10-29-24
Durable Goods Sept 2024: Taking a Breather 10-25-24
New Home Sales: All About the Rates 10-25-24
PulteGroup 3Q24: Pushing through Rate Challenges 10-23-24
Existing Home Sales Sept 2024: Weakening Volumes, Rate Trends Worse 10-23-24
State Unemployment Rates: Reality Update 10-22-24
Housing Starts Sept 2024: Long Game Meets Long Rates 10-18-24
CarMax: Why Do We Watch KMX as a Bellwether? 10-3-24
Select Histories:
Tariffs: The EU Meets the New World…Again…Maybe 10-29-24
Trump, Trade, and Tariffs: Northern Exposure, Canada Risk 10-25-24
Trump at Economic Club of Chicago: Thoughts on Autos 10-17-24
HY OAS Lows Memory Lane: 2024, 2007, and 1997 10-8-24
Credit Returns: Sept YTD and Rolling Months 10-1-24
HY Industry Mix: Damage Report 8-7-24
Volatility and the VIX Vapors: A Lookback from 1997 8-6-24
HY Pain: A 2018 Lookback to Ponder 8-3-24
Presidential GDP Dance Off: Clinton vs. Trump 7-27-24
Presidential GDP Dance Off: Reagan vs. Trump 7-27-24
The B vs. CCC Battle: Tough Neighborhood, Rough Players 7-7-24
HY Spreads: Celebrating Tumultuous Times at a Credit Peak 6-13-24
Credit Markets Across the Decades 4-8-24
Credit Cycles: Historical Lightning Round 4-8-24
Histories: Asset Return Journey from 2016 to 2023 1-21-24
Credit Performance: Excess Return Differentials in 2023 1-1-24
HY vs. IG Excess and Total Returns Across Cycles: The UST Kicker 12-11-23
HY Multicycle Spreads, Excess Returns, Total Returns 12-5-23
US Debt % GDP: Raiders of the Lost Treasury 5-29-23
 |
|