
Footnotes & Flashbacks: State of Yields 11-18-24
We update our yield collection after a mild bear steepener and revisit “sweeping mandate” as the world’s most abused term.


Another bear steepener this week kept UST bulls on edge when the real test of inflation and FOMC reactions and any material governance changes at the Fed lie ahead in 2025.
The migration of yields from here will get trickier as the usual economic releases have to be framed against the shifting weight of speculation on what tariffs and mass deportation will do in the context of consumer and industry fundamentals and how it all flows through into inflation metrics.
Among the bigger wildcards in coming months is the game plan from the incoming administration on how it will seek to subjugate the Fed either by unilateral stewardship changes (i.e., Powell litigation) or legislative action with the GOP’s sweep of Congress.
After a smaller winning popular vote margin than Biden in 2020, Obama in 2008/2012, and Bush in 2004, the idea of a “sweeping mandate” is ludicrous when held up to the facts, but a big surprise is easy to inflate into the latest false reality. Control is control, however, and the GOP have it.
With 53 seats (when the appointments are finalized) in the Senate, Trump saw the Democrats win 4 out of 5 Senate seats in the swing state elections and barely lost the PA Senate seat, leaving Trump fully in charge at the helm but hardly with a license to purge the military and run amok and off the rails in the Justice Department.
We already looked at the weekly UST deltas and time series for the Freddie Mac 30Y benchmark and 10Y UST in Mini Market Lookback: Reality Checks 11-16-24. In this commentary, we update the rest of the weekly yield collection but also spend some time framing the politics as the policy issues and risks just saw the plot thicken with some wild nominee moves by Trump. The forward handicapping of policy and behavior of the leadership ranks has not been this tied to a single person (rather than world events) since the Civil Rights era and Vietnam. Unlike FDR in the New Deal, Trump controls the Supreme Court.
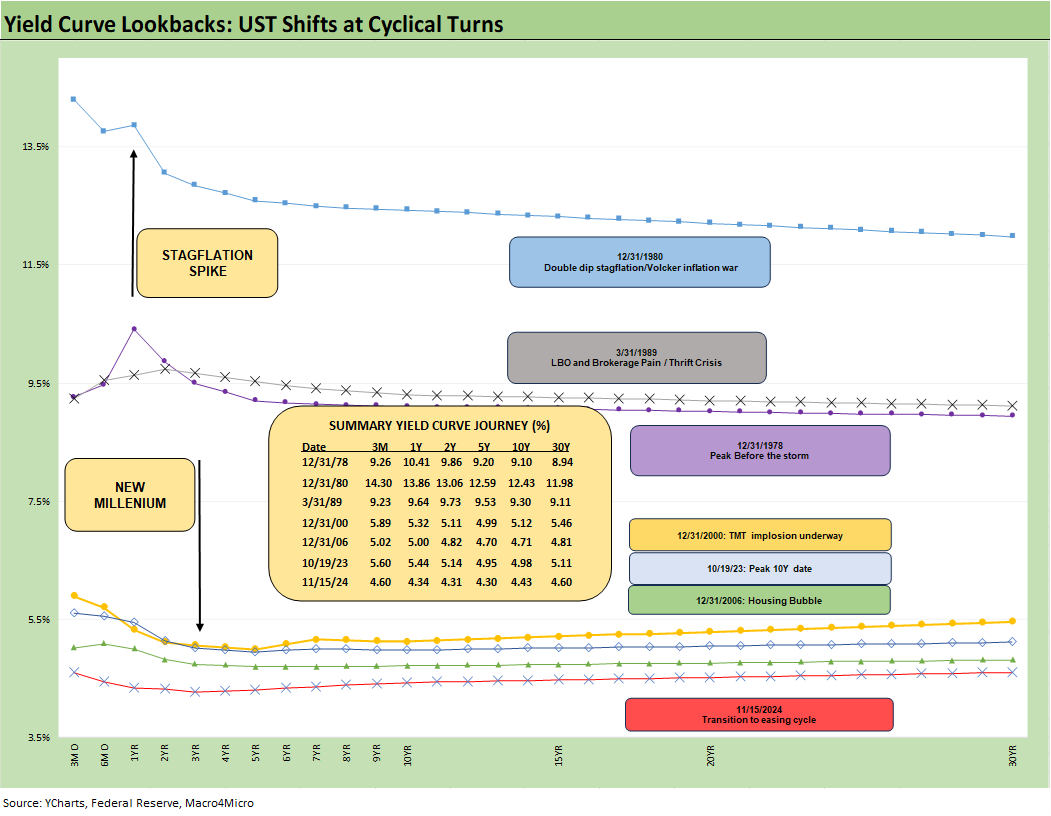
We look at this same yield curve history each week for a reminder of what unfolded across past elections, monetary backdrops, cyclical turns, and the politics of the times. The easy takeaway is that we are looking at one of the lowest UST backdrops vs. the pre-crisis, pre-ZIRP cycles even after the adverse UST shift beyond the 2Y UST YTD 2024.
For the political backdrops, you could argue that there were only two “sweeping mandates” in this mix with one by Reagan in 1984 and one by Obama in 2008. Reagan got it in his second term and Obama arguably had a first-term mandate with a sweep of the House and Senate and margin of victory in the popular vote of well over 9 million. It did not last with 2010 bringing the biggest swing in the House balance since 1946.
Even with the smaller voting base of the period, both of Reagan’s margins of victories in the popular vote were bigger than Trump’s and so were both of Obama’s. Bush in 2004 was also bigger. Both Bush in 2004 (55 in Senate) and Obama in 2008 (57 Senate seats) had bigger swings to a higher Senate control than Trump’s 53.
We already looked at what landslides really look like in an earlier commentary (see Mini Market Lookback: Extrapolation Time? 11-9-24). These types of things are worth keeping in mind if we keep going down this path of Trump asking the Senate to not exercise its constitutional duty and challenge the quality and competence of his nominees. The quality, experience and competence of the early wave is threatening on multiple levels. That is notably the case for proposed appointments for Attorney General, Defense, Health Care and National Intelligence.
No matter how you talk around it, the old math still works: Economics = Policy, Policy = Personnel. That means Personnel = Economics.
“Sweeping mandate” as the world’s most abused term…
“A big surprise on swing state sweep” is not the same as “sweeping mandate” when you are sitting on only 50% of the popular vote (per updated CNN map as more votes trickle in) and a small – but crucial – advantage in the House and Senate. Trump’s popular vote margin at this point is now less than what Bush gained against Kerry in 2004 and is less than 1/3 of Obama’s victory over McCain (the count continues in CA). It is also less than Obama’s margin against Romney. The outcome does show a much better performance than his prior two popular vote defeats (which of course he claimed were both fraudulent).
After a while, there is also a simple reality of “what you earned” and “why they voted for you” as opposed to “why the other person lost” and “why they voted against her” and “why so many stayed home.” We will vote with the “throw the bums out” tradition seen in the US for generations when things go wrong in the economy. That happened to Nixon/Ford (the inflation, recession, and Watergate trifecta), Carter (inflation, recession), and George HW Bush in 1992 (recession).
Team Trump also lost Senate races in Michigan, Wisconsin, Arizona, and Nevada and barely won the Senate race in Pennsylvania by just over 17 thousand votes (as we go to print, using CNN graphic updates). That difference in the PA Senate race is around 1/4 of the stadium capacity of the Philadelphia Eagles (and about the same for the Pittsburgh Steelers). Dave McCormick won the state with 48.8% of the vote over his competitor Bob Casey at 48.6%. That is a win – not a license for Trump to burn down the institutions of the Federal government. Then again, that PA Senate election is in recount and litigation. The Democrat, Senator Casey, has not conceded yet. The fact is he lost as too many stayed home.
With only 53 seats in the Senate for Trump, that is still below the 55 held by Bush after 2004 and the 57 held by Obama after 2008. The GOP gained a net 4 seats in 2024 with Pennsylvania, West Virginia, Montana, and the red tide finally catching up with Sherrod Brown in Ohio as his opponent Bernie Moreno, who won in a “landslide” with 50% of the vote. In the clash of the true swing states, the score was 4-1 Democrats with PA barely flipping by just over 17K votes and less than 49% of the vote. There is no way to call Montana, West Virginia, and Ohio swing states at the Presidential level.
The reality of the numbers is that the election was a huge disappointment for Democrats, but we have to invoke the Princess Bride’s Inigo Montoya for some caution on the words “sweeping mandate” (“that word does not mean what you think it means”). Taking that as a mandate for purging the military, seizing de facto control of the Fed, and putting a mental moonbeam in charge of just under 1/5 of the GDP (health care) shows some alarming lack of judgment and raises more of the same questions around authoritarian intent to destroy established institutions and drive out qualified personnel.
The economic fallout will be hard to assess this early in the game, but the ability to flirt with record stock markets and multidecade lows in credit spreads will not promise extremely favorable risk-reward symmetry as 2025 unfolds. The debt ceiling, the “Day 1” priorities, and more transparency on tariffs, deportation, and Ukraine are on the short list alongside what will be a tense process for the motley crew of initial nominees as Trump commands his Senate to not have hearings and votes and use recess appointments to avoid scrutiny. Hearings would also reveal the lack of factual grasp and experience of the nominees. You cannot get more authoritarian than that Senate request! Well actually, he can.
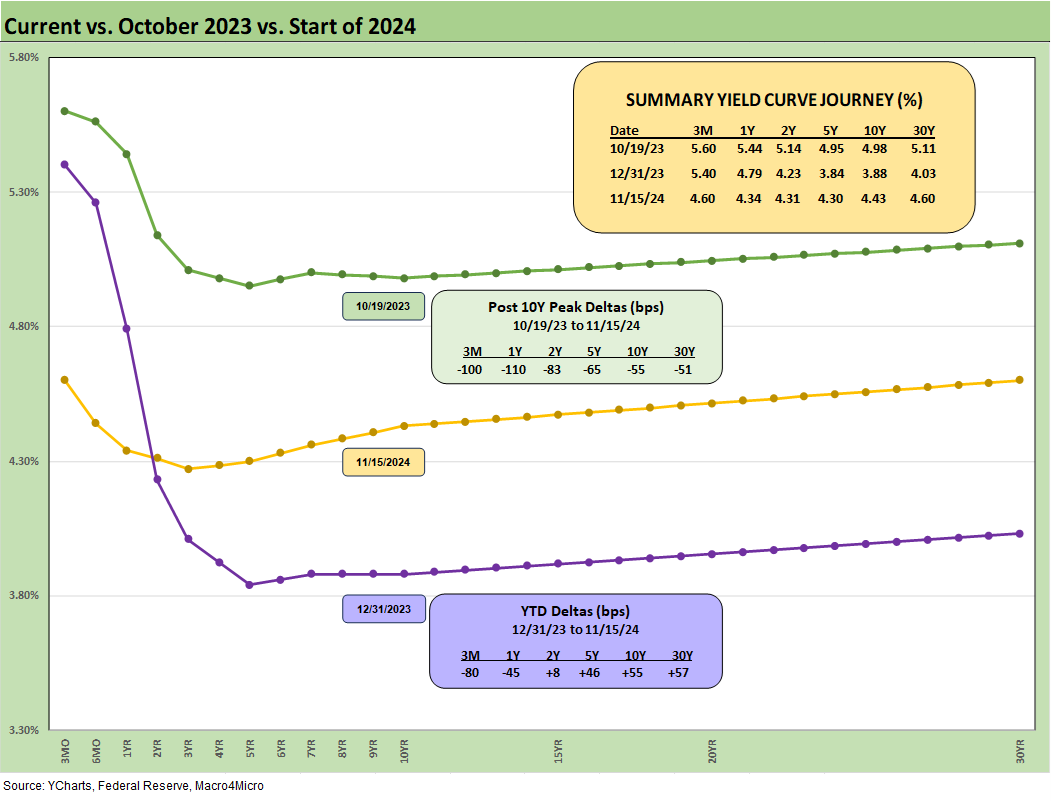
The above chart updates the UST curve shift and yield details from the 10-19-23 peak date for the 10Y UST, at 12-31-23, and YTD through Friday. For the YTD move, we see the upward shift and mild bear steepening from the 2Y UST to 30Y UST. We also see the slow Fed effects flowing into the flattening on the front end. The FOMC effects roll into the slow migration to a flatter UST from 3M UST with another -25 bps fed funds move due in Dec 2024.
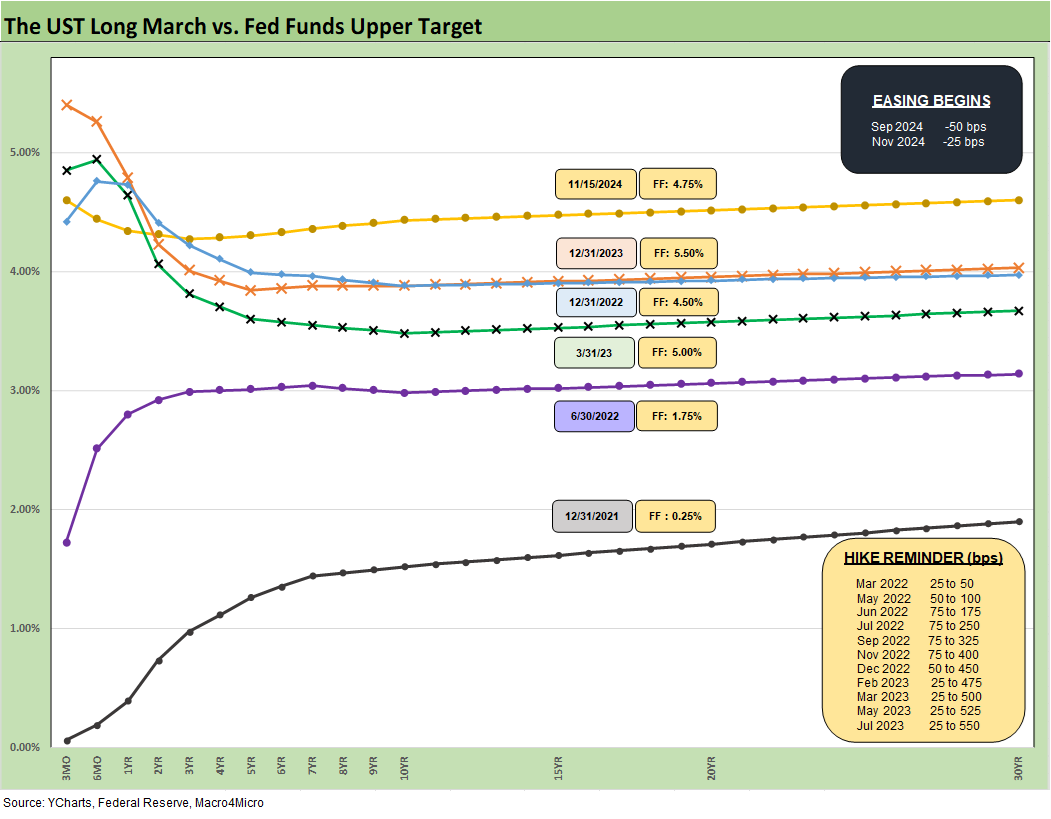
The above chart includes our reminder box detailing the dates and magnitude of the FOMC hikes and now the easing actions. The overlapping 12-31-22 vs. 12-31-23 UST curves offer a reminder that a 100 bps differential in fed funds does not automatically translate into a material move in the 10Y UST. That is especially the case with record borrowing needs and an expansion still very much underway. We will get the second estimate on 3Q24 GDP next week.
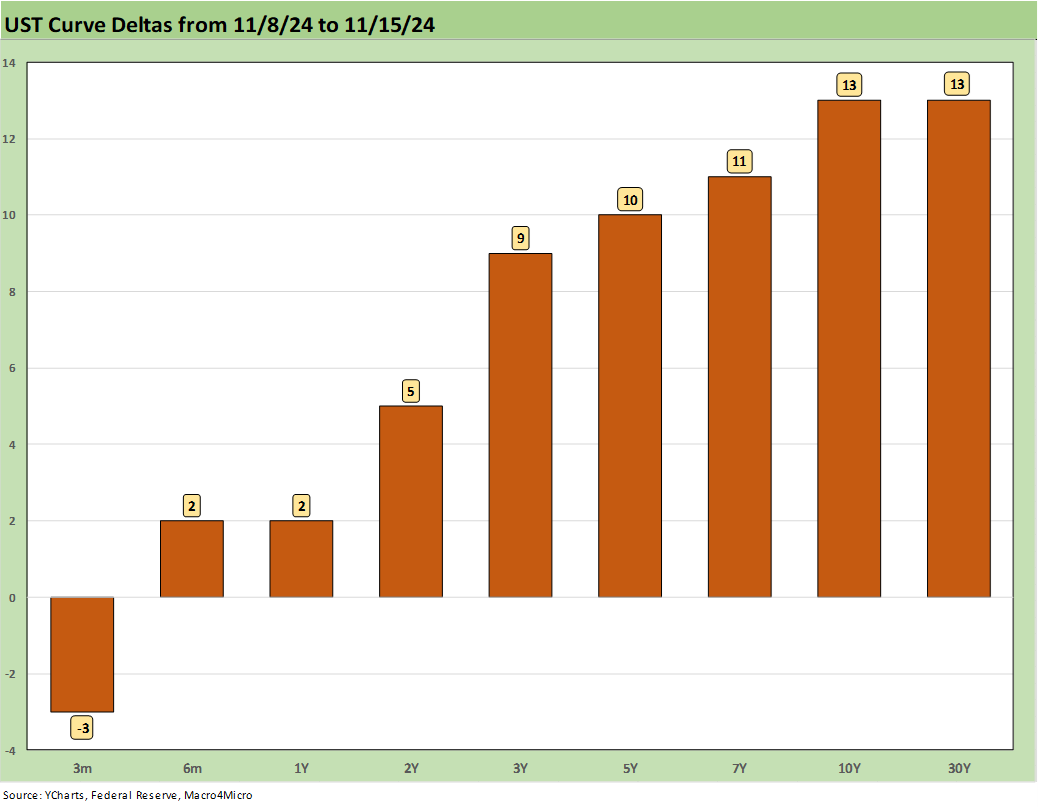
The above chart updates the weekly UST deltas as already covered in the Mini Lookback. A bear steepener drove underperformance of bond ETFs yet again (see Footnotes & Flashbacks: Asset Returns 11-17-24).
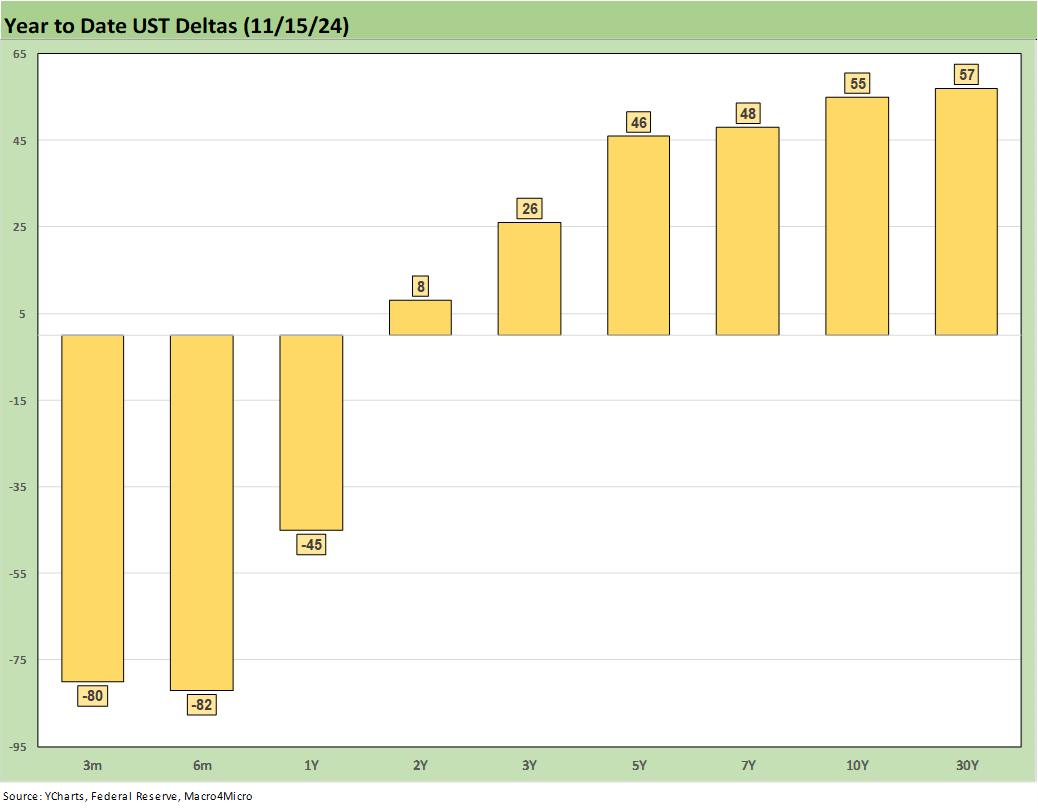
The YTD UST deltas show the front end moving lower and the 2Y to 30Y moving higher in what is a rational response to UST supply and stubborn services inflation, the threats to inflation from tariffs, and uncertainty over wage pressures that could flow from mass deportation.
The deportation “bid-offer” from the GOP lineup seems to run at 1.3 million-20 million. The fact is the “freight and logistics” assets for such a large-scale deportation of multiple millions do not exist. Alternatively, it would require mass military mobilization domestically (hold that thought on the Hegseth nomination). Even moving 1 million to 2 million deportations in a year would take Herculean efforts under the law and are challenging enough with the realities on the ground. “The law” is also a major question (hold that thought on the Gaetz nomination).
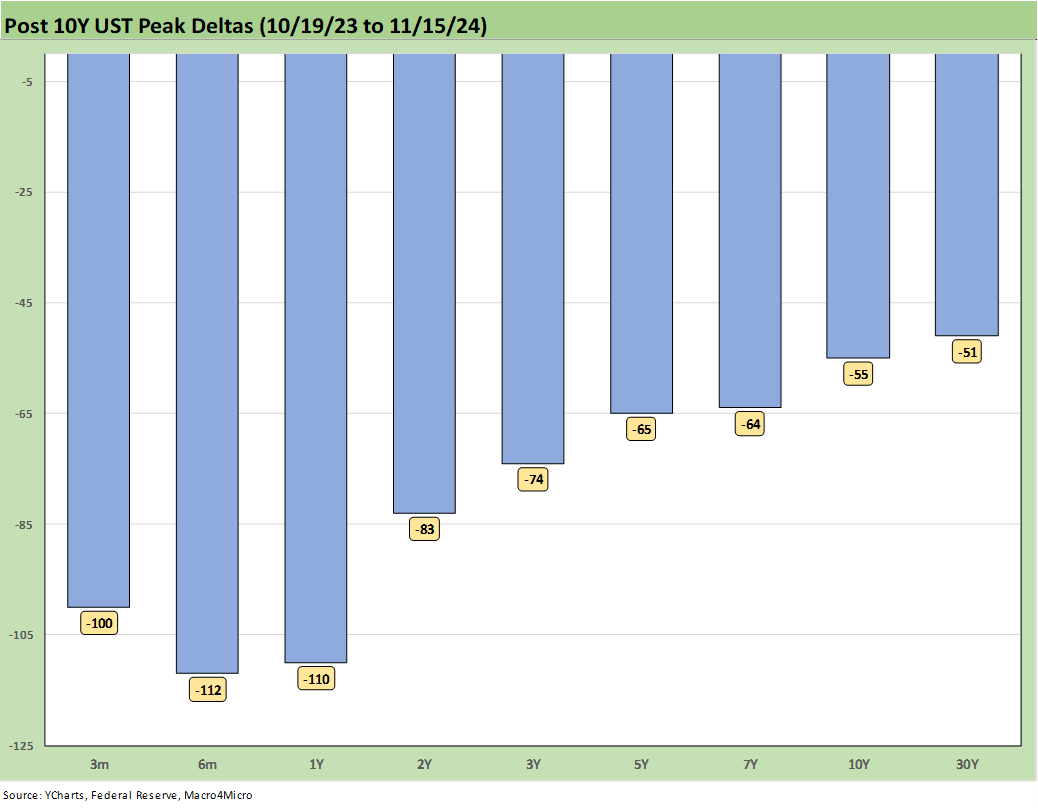
The materially favorable shift in the UST curve from the 10-19-23 peak date of the 10Y UST is captured above. That move came alongside lower CPI and PCE inflation and steady and solid economic growth. The bull steepening from 10-19-23 is now giving way to a bear steepening with the moving parts revolving around the usual economic variables. The inflation ingredients now include the added spices of tariffs and mass deportation and how that flows into imported goods prices and labor market disruptions.
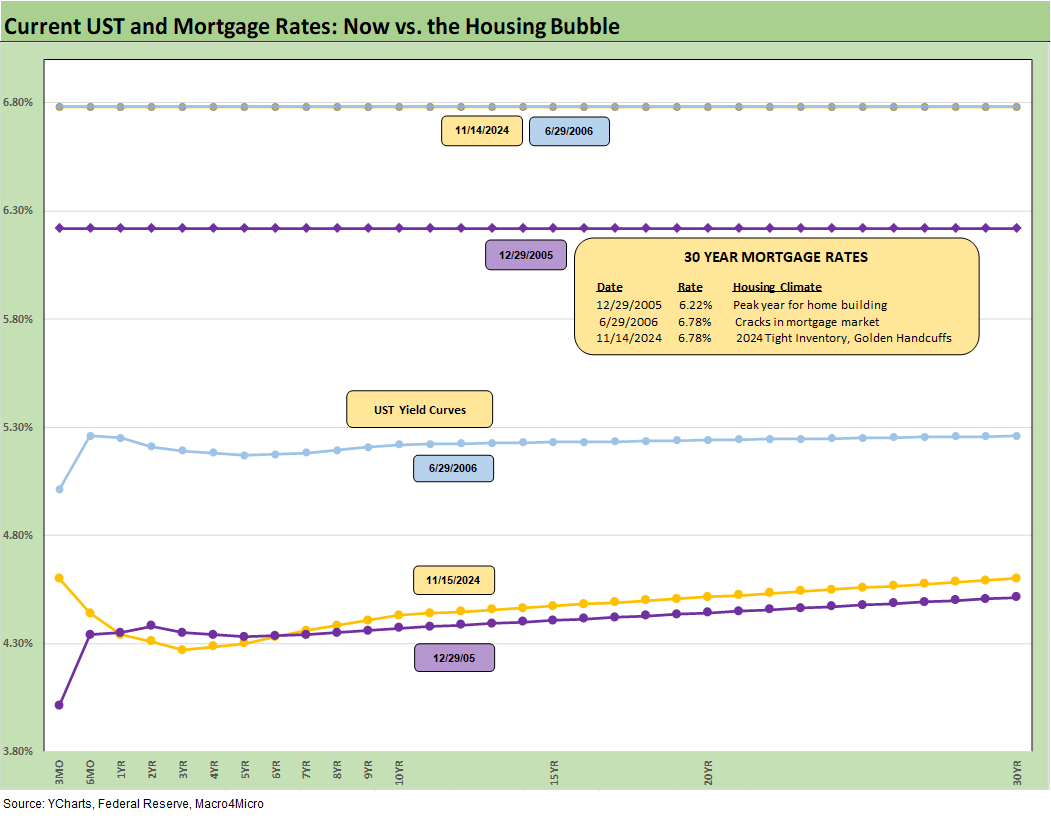
The above chart updates our weekly comparison of the latest Freddie Mac 30Y benchmark (set each Thursday) and UST curve from the close of last week to earlier periods from the peak homebuilding year (2005) and initial RMBS asset quality jitters in mid-2006.
The current UST curve has now moved above the Dec 2005 UST with the 30Y mortgage rates of today right on top of mid-2006 when UST rates were materially higher in the 10Y UST area. Getting mortgage rates lower will be a major challenge with the anxiety around longer UST rates.
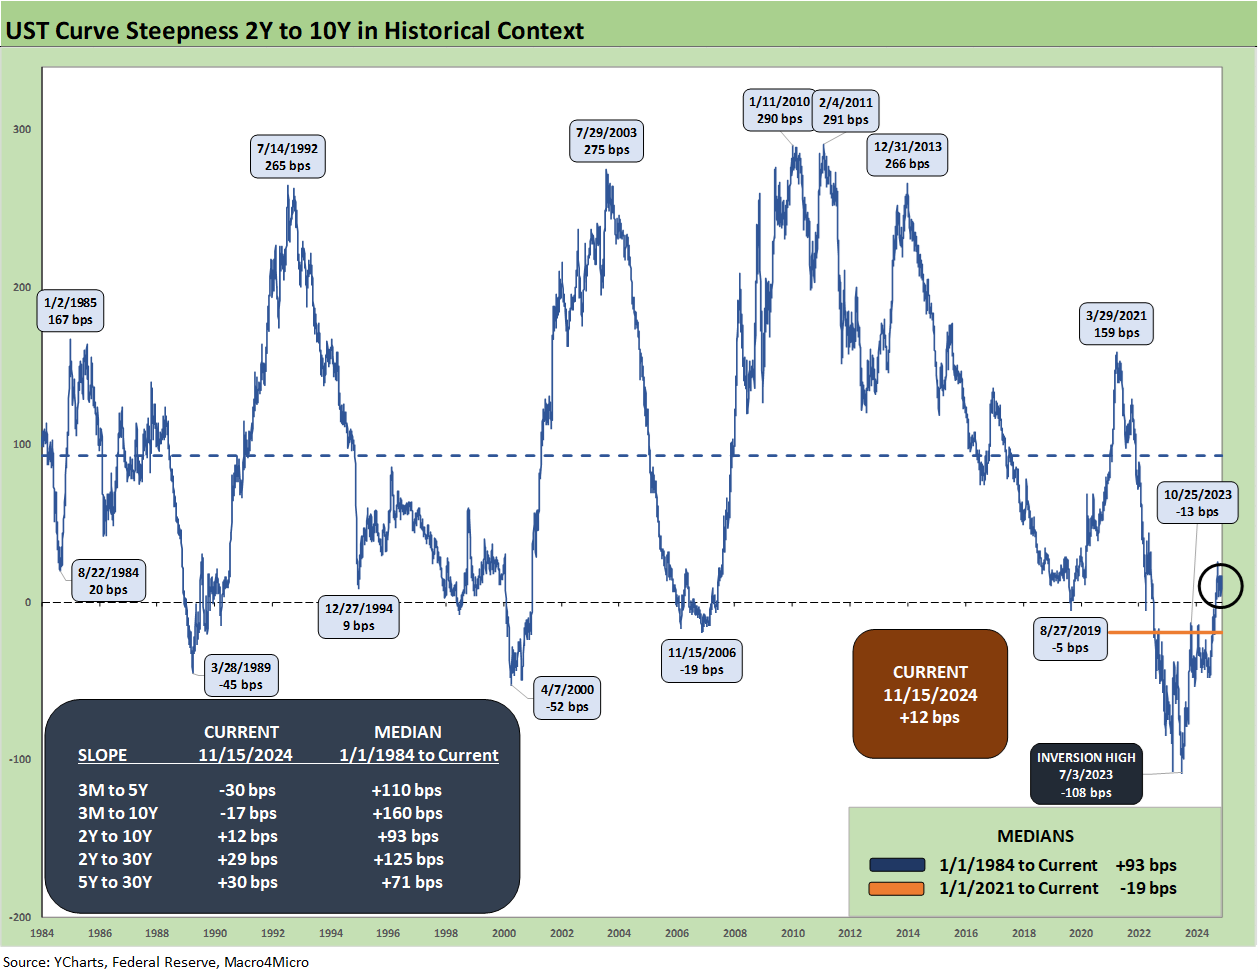
The above chart updates the 2Y to 10Y UST slope in a time series from 1984. We see +12 bps for an upward slope, but that remains well inside the long-term median of +93 bps. Getting the UST curve in a later-cycle stage to move toward flatter from 3M or from 2Y will need help from inflation metrics as well as the Fed. That does not mean the 10Y UST will not fight the move if the economy stays strong and services CPI stubborn.
That stubborn inflation will not get easier with tariffs building in front end costs that need to be passed on or “eaten” by the buyer of the goods (see Trump at Economic Club of Chicago: Thoughts on Autos 10-17-24, Trump, Trade, and Tariffs: Northern Exposure, Canada Risk 10-25-24, Tariffs: The EU Meets the New World…Again…Maybe 10-29-24, Facts Matter: China Syndrome on Trade 9-10-24).
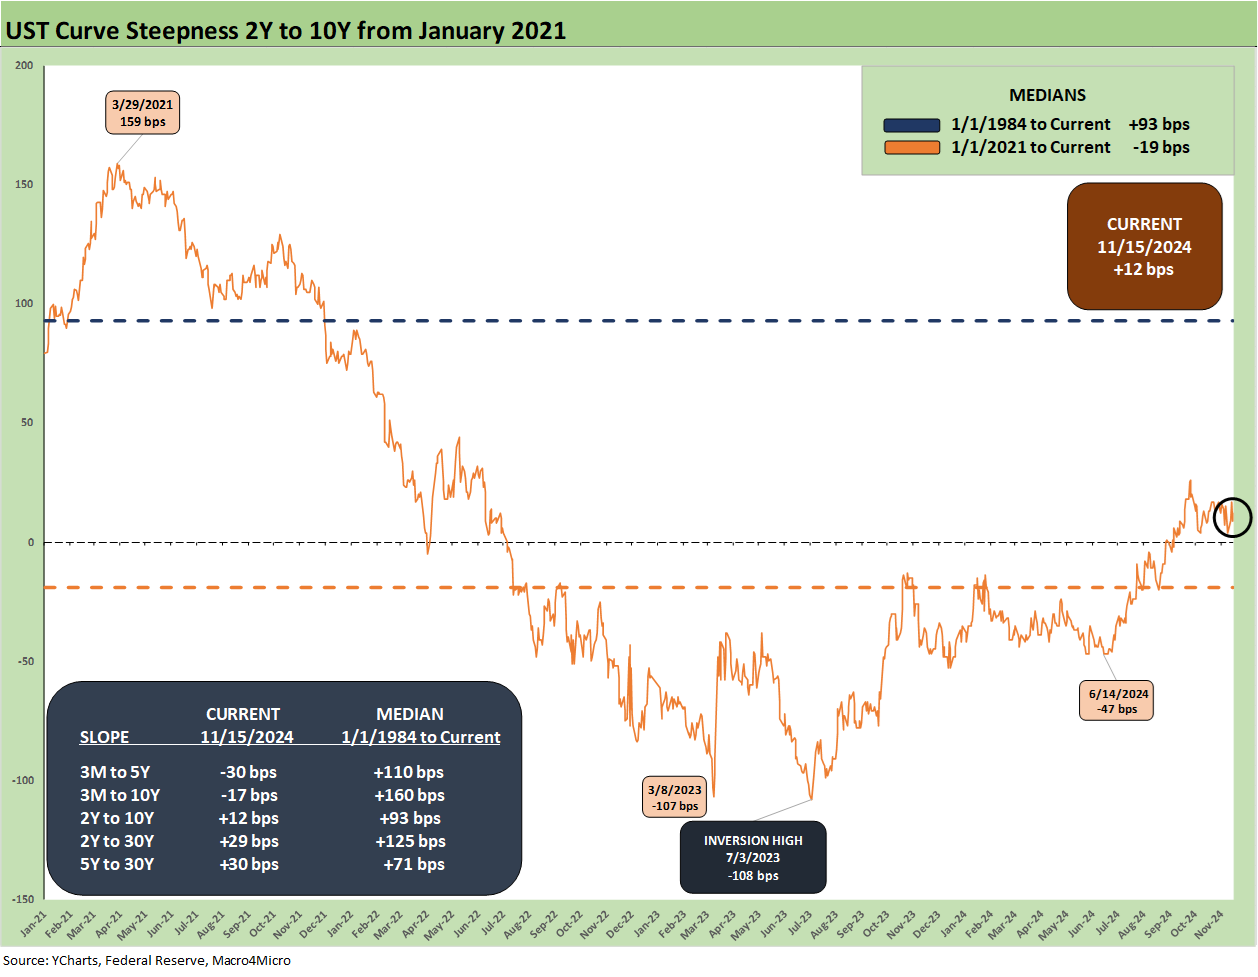
The above chart shortens up the 2Y to 10Y UST slope ride from early 2021 when ZIRP was in place and ahead of the March 2022 start of the tightening cycle. The peak slope of +159 bps in March 2021 to a peak inversion of -108 bps in July 2023 will be one for the ages in the context of a sustained expansion. We saw record inversion to record steepness on the short end back in the Volcker years, but that was in a much more brutal stagflation swing.
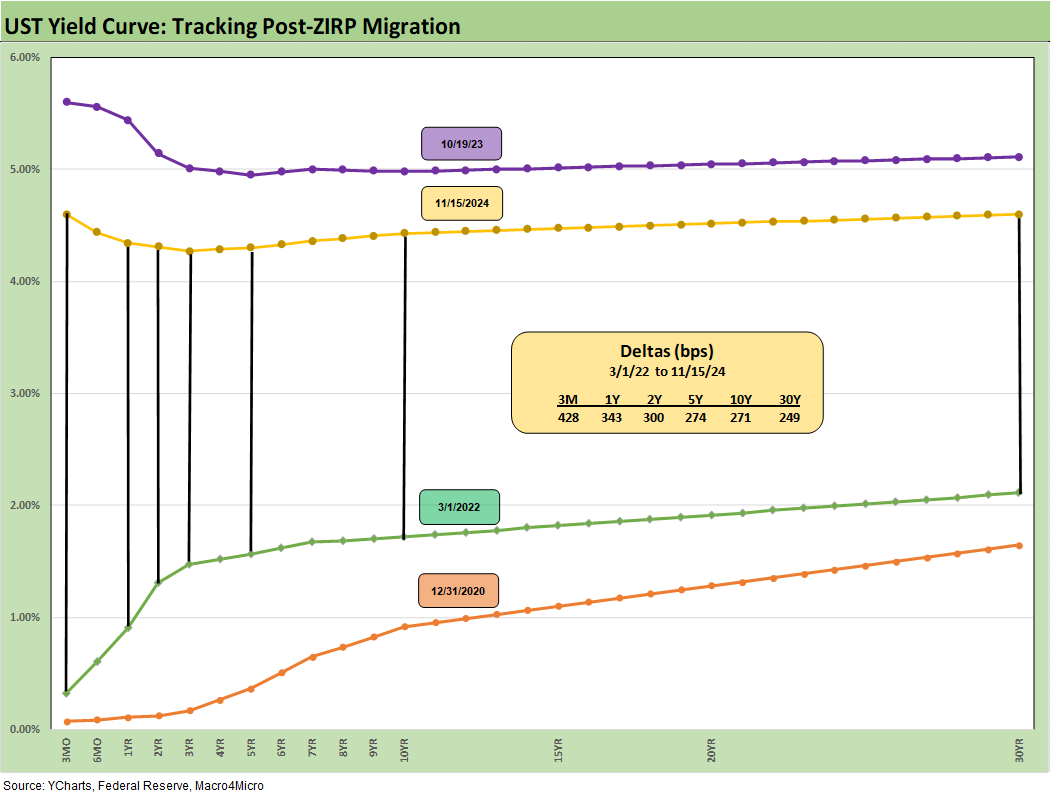
The above chart wraps with the running UST deltas from the start of March 2022, which was the month when ZIRP ended (effective 3-17-22). We also include the UST curve from 12-31-20 and UST curve from the peak 10Y UST date of 10-19-23 as frames of reference. Econ nerds and monetary experts will be studying these events and market reactions for generations to come in the same way Volcker’s years are studied.
The next stage might get even more scrutiny given the unprecedented nature of the tariff and deportation plans that no one has experienced in the history of the Federal Reserve. A century ago, the US had the Immigration Act in 1924, but that was not a mass deportation of so many employed people where jobs might need to be filled. The Immigration Act was to keep people out (mostly non-English speaking people and Catholics or “wets” during Prohibition or “all of the above”). Asia (China) had already been banned in 1882 by the Exclusion Act. That was beefed up later to exclude other Asians rather than just China.
We also had Smoot-Hawley for tariffs, but that was 1930 and is not cited by Trump for obvious reasons. We note that Trump keeps citing McKinley (using inaccurate history of course), but the Fed was not created until 1913 under Wilson. The Wilson team in Versailles spent a lot of time hyping free trade globally. In other words, history is not offering much help. That said, the simple statement that “buyer pays” is not part of the Team Trump dialogue, so history matters little in a current world where the facts are not part of the discussion.
See also:
Footnotes & Flashbacks: Asset Returns 11-17-24
Mini Market Lookback: Reality Checks 11-16-24
Industrial Production: Capacity Utilization Circling Lower 11-15-24
Retail Sales Oct 2024: Durable Consumers 11-15-24
Credit Crib Note: United Rentals (URI) 11-14-24
CPI Oct 2024: Calm Before the Confusion 11-13-24
Footnotes & Flashbacks: Credit Markets 11-12-24
Footnotes & Flashbacks: State of Yields 11-11-24
Footnotes & Flashbacks: Asset Returns 11-10-24
Mini Market Lookback: Extrapolation Time? 11-9-24
The Inflation Explanation: The Easiest Answer 11-8-24
Fixed Investment in 3Q24: Into the Weeds 11-7-24
Morning After Lightning Round 11-6-24
Payroll Oct 2024: Noise vs. Notes 11-2-24
All the Presidents’ Stocks: Beware Jedi Mind Tricks 11-1-24
PCE Inflation Sept 2024: Personal Income and Outlays 10-31-24
Employment Cost Index Sept 2024: Positive Trend 10-31-24
3Q24 GDP Update: Bell Lap Is Here 10-30-24
The Politics of Objective GDP Numbers: “Flex Facts” on Growth 10-30-24
Tariffs: The EU Meets the New World…Again…Maybe 10-29-24
JOLTS Sept 2024: Solid but Lower, Signals for Payroll Day? 10-29-24
Trump, Trade, and Tariffs: Northern Exposure, Canada Risk 10-25-24
Durable Goods Sept 2024: Taking a Breather 10-25-24
New Home Sales: All About the Rates 10-25-24
PulteGroup 3Q24: Pushing through Rate Challenges 10-23-24
Existing Home Sales Sept 2024: Weakening Volumes, Rate Trends Worse 10-23-24
State Unemployment Rates: Reality Update 10-22-24
Housing Starts Sept 2024: Long Game Meets Long Rates 10-18-24
Trump at Economic Club of Chicago: Thoughts on Autos 10-17-24