
New Home Sales: All About the Rates
We post a belated new home sales note for Sept after good news sailed by with rising rates inflating worries for Oct and hitting builder equities this week.


With mortgages and the UST curve taking a beating in Oct and 30Y mortgages back to levels just under 7% today, the Sept home sales numbers were going to be a minor factor as they were solid but quickly forgotten with the UST curve and mortgage bouncing higher in the new month.
A busy stretch of homebuilder earnings this week posted numbers that were generally constructive, but we saw a broad sell-off in builder equities after a very impressive run for the Homebuilder ETF (XHB) last week at #1 by a substantial margin in LTM performance at +73%.
XHB also had a strong 3-month run and #2 position at 11.7% before the setbacks in UST curve action and mortgage rates in Oct sent builder stocks tumbling into this week.
The +4.1% sequential rise in new single family home sales for Sept and +6.3% YoY saw sequential median home prices popping to $426.3K in Sept 2024 from $410.9K in Aug 2024 and essentially flat YoY vs. $426.1K in Sept 2023.
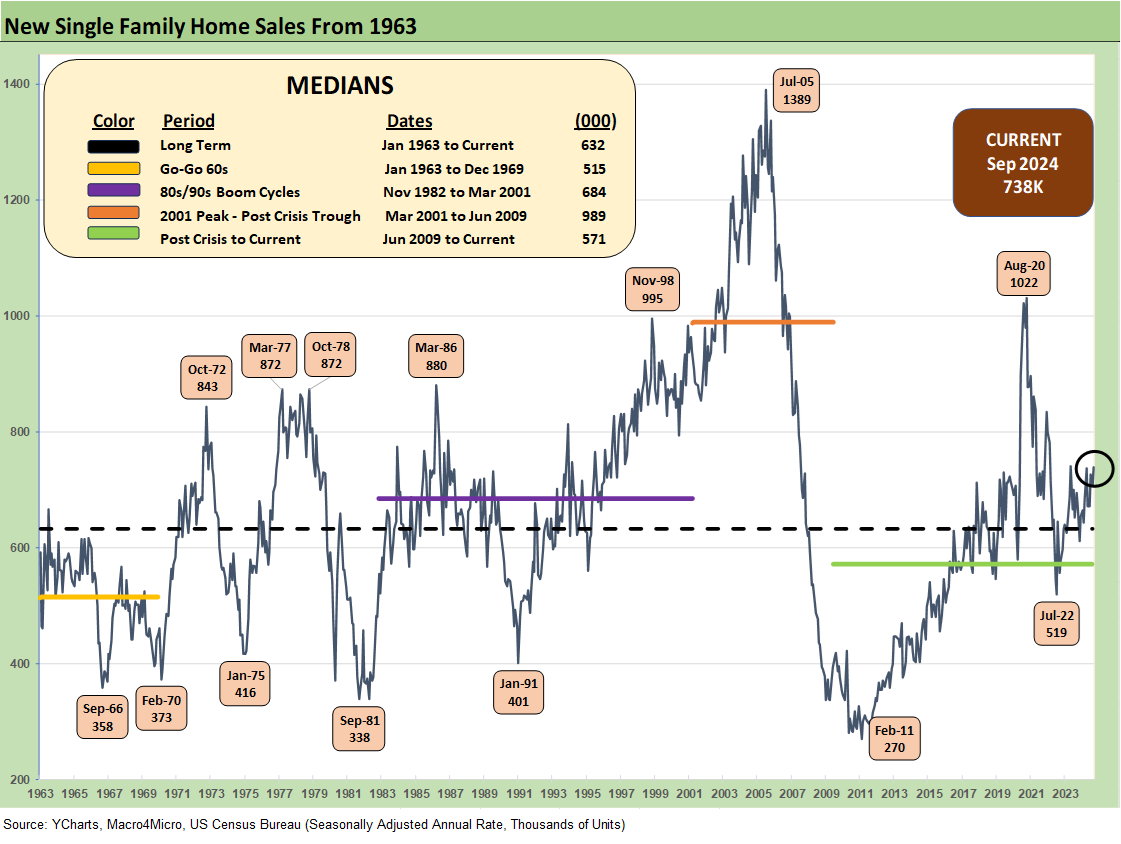
The above chart updates the time series for new single family home sales from 1963, and the current run rate of 738K is above all the medians posted in the box with the exception of the housing bubble boom of March 2001 to the June 2009 recession trough when 989K was the median. That peak came in a market that led to a housing sector collapse to a low in new home sales of +270K in Feb 2011, which was down over 80% from the 2005 peak.
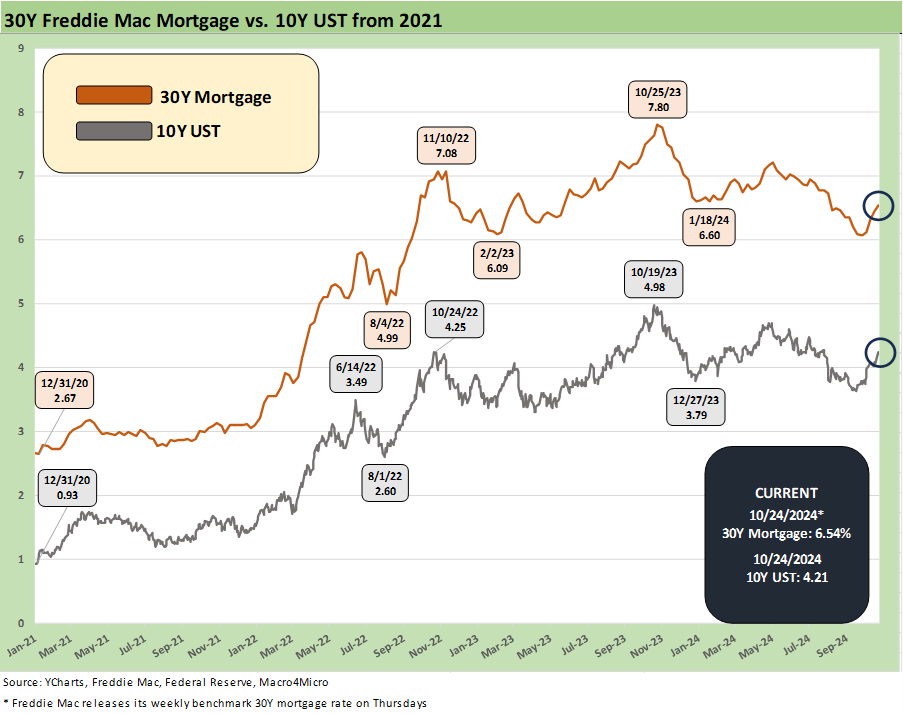
The above chart highlights the wild ride of the 10Y UST and Freddie 30Y mortgage rates across the tightening cycle. We look at the trend in the yield curve in detail each week, and this month has been a very tough one for duration. The ability of the longer end of the UST curve and mortgages to decline will face challenges when it comes to following the easing cycle to lower rates (see Footnotes & Flashbacks: State of Yields 10-21-24).
Since the Fed eased and hopes for the 10Y UST to follow were picking up, the 10Y UST that wags the 30Y mortgage had headed higher on very strong payroll numbers followed by a series of constructive inflation reports and consumer indicators (see Payroll Sept 2024: Rushing the Gate 10-4-24, Retail Sales Sep 2024: Taking the Helm on PCE? 10-17-24, CPI Sept 2024: Warm Blooded, Not Hot 10-10-24).
We saw Freddie 30Y mortgages get down inside 6.1% at the end of September just before the payroll release to 6.08% (see Footnotes & Flashbacks: State of Yields 9-29-24). That has reversed quickly in recent weeks. The broader range of 30Y mortgage rate surveys were around 6.9% today with Freddie Mac’s criteria at 6.54% at yesterday’s noon release time for the weekly benchmarks.
We saw homebuilder equities beaten up this week with our peer group all in the red with some in double digit negative price moves. That came even as some solid Sept 2024 quarterly earnings reports rolled out with more coming next week (see PulteGroup 3Q24: Pushing through Rate Challenges 10-23-24).
For builder equities, it is now a debate over valuation and how far they have run. Volumes for the quarter have been strong in earnings while average selling prices have stalled overall, but with more mixed across regional operating segments.
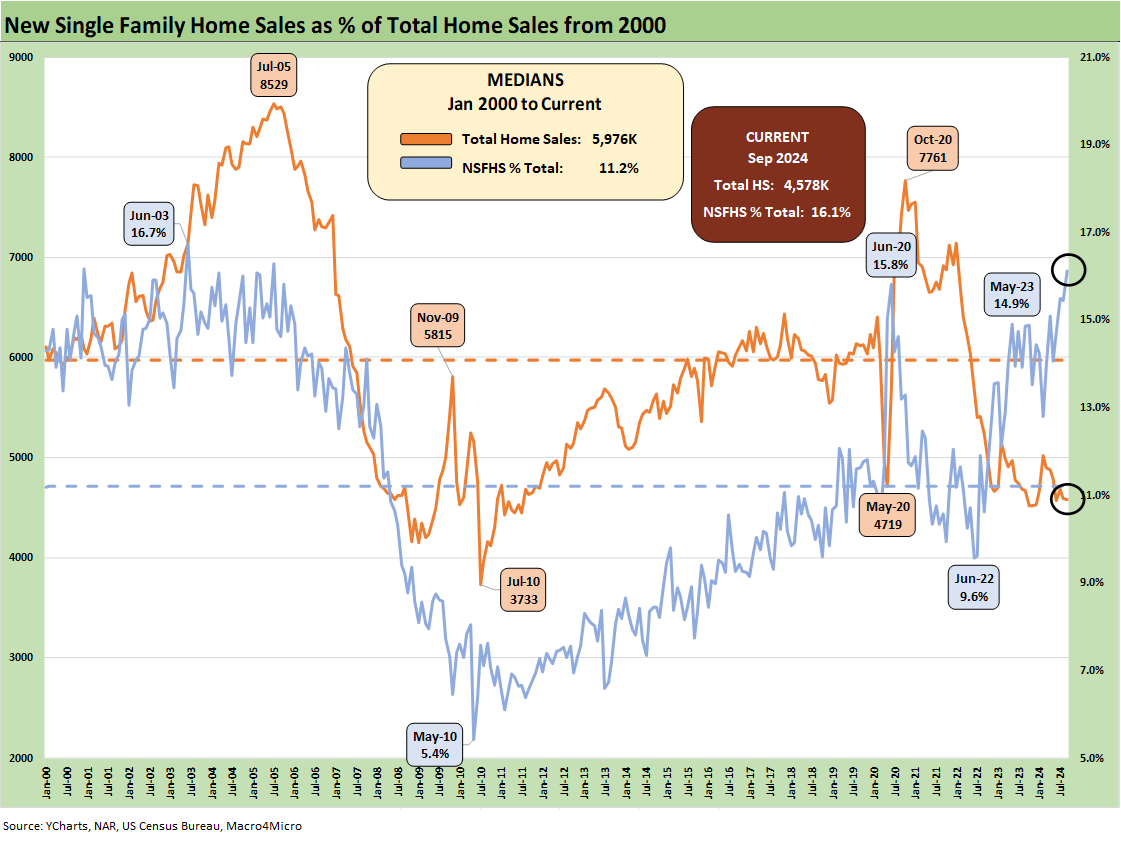
The above chart updates the market share held by new homes within the total single family home sales universe (existing + new). Builders continue to outperform existing home sales using their range of incentive programs and ability to deliver inventory the “old fashioned way” by building it at cost and at a price that allows them to make a solid gross margin even after factoring in incentive costs (mortgage buydowns, fee wavers, etc.). The new home sales share was 16.1% of total sales for the month vs. the long-term median of 11.2%.
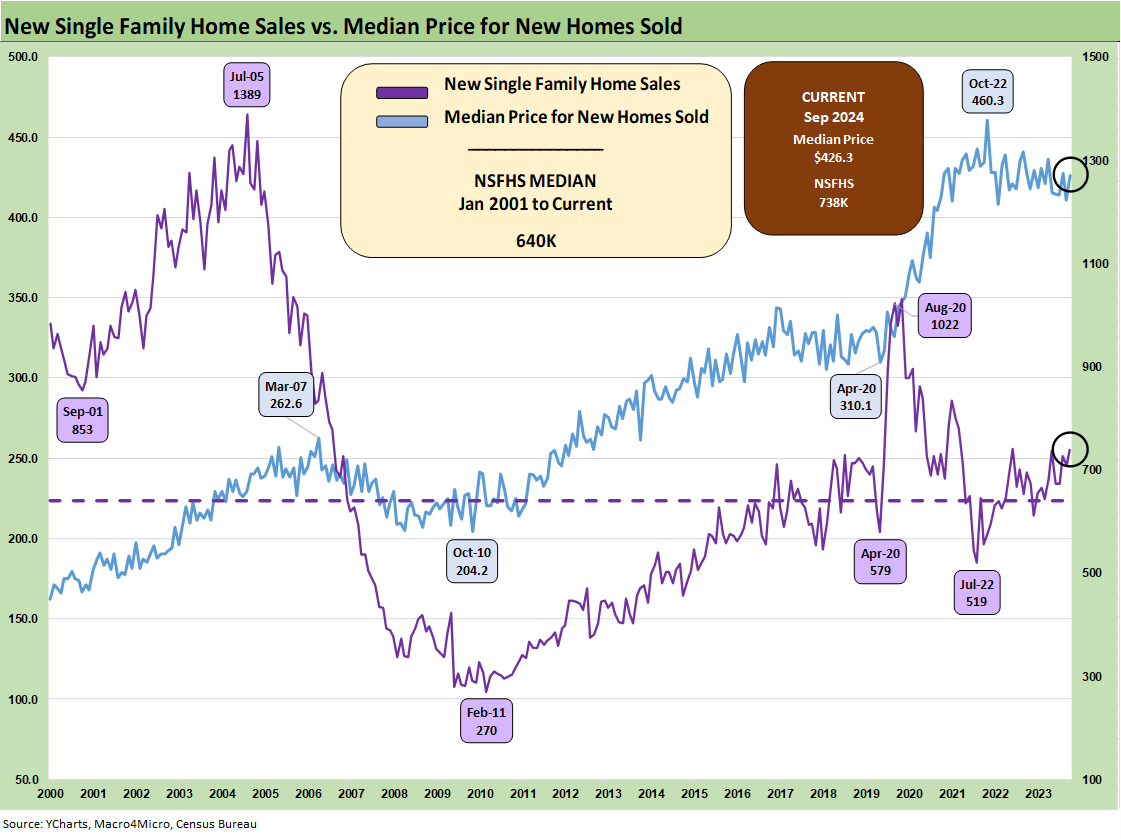
The above chart plots the volume of new home sales set against the median price for the timeline. The 738K in volume is running well ahead of the long-term median from Jan 2001 of 640K with a median price of $426.3K. That level is below the $460.3K peak median of Oct 2022.
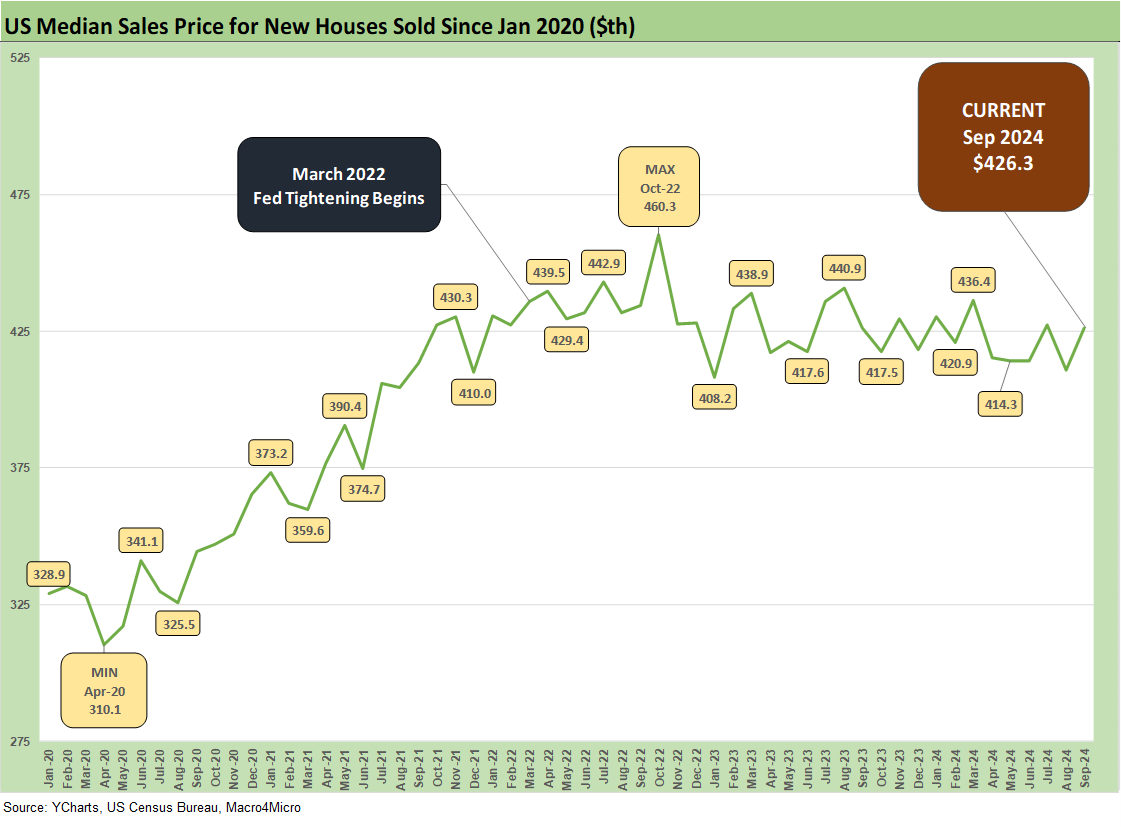
The above chart gives a simpler visual on the path of median sales prices with the Sept level of $426.3 materially above the $310.K seen back at the COVID lows. The current median price is similar to the median price around the start of the tightening cycle. These price levels always come with the asterisk of geographic mix and product tiers.
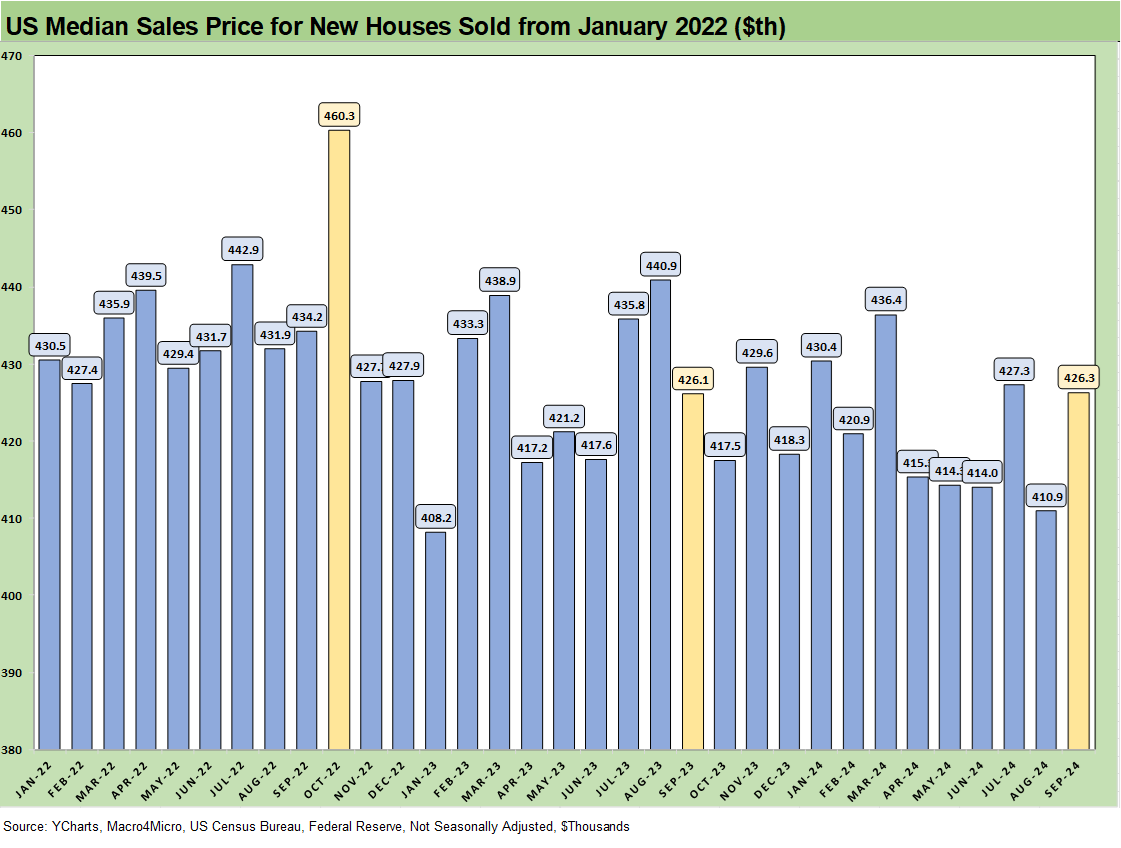
The above chart updates the monthly median sales price for each month from Jan 2022 or just ahead of the end of ZIRP, the start of the tightening cycle, and the journey to the first easing in Sept 2024. The Oct 2023 UST peak saw a price of $417.5K.
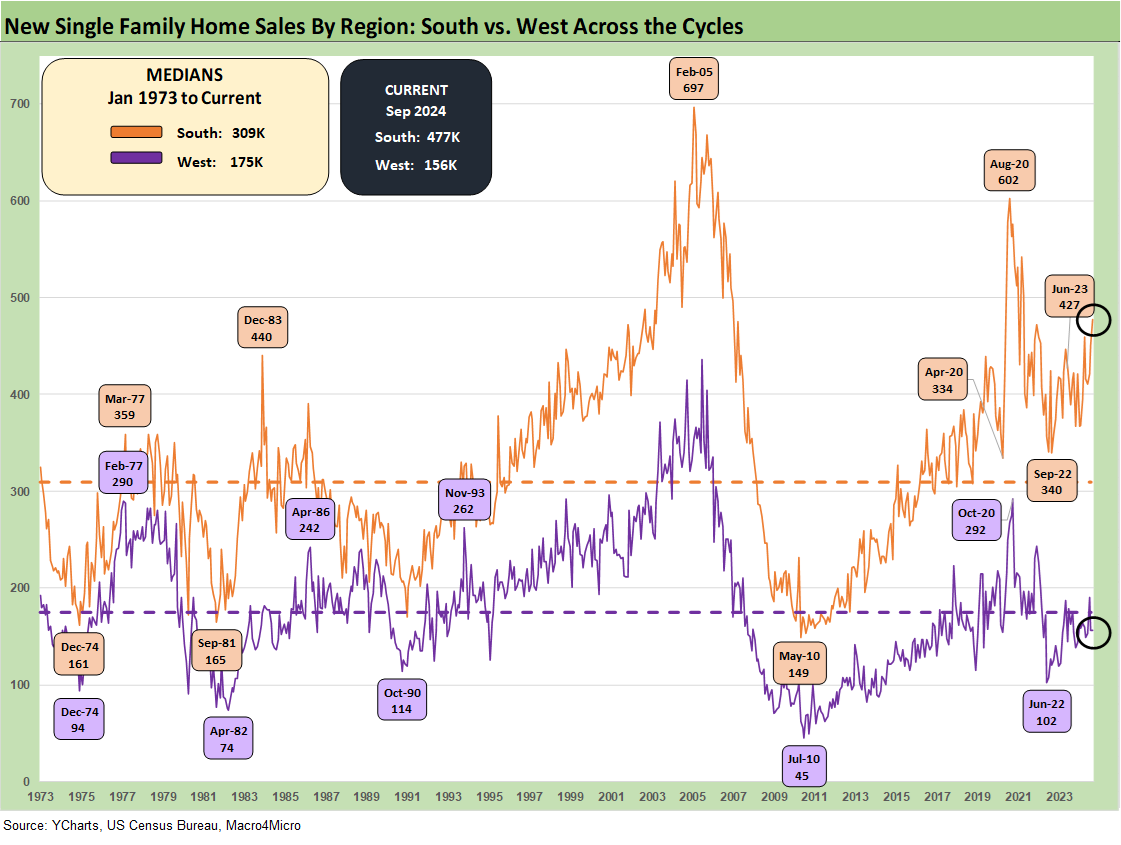
The above chart updates the new home sales history back to 1973 for the South and West regional markets that are the #1 and #2 single family markets. The South this month comprised 65% of total sales and the West amounted to 21%. On a not seasonally adjusted (NSA) basis, which gets closer to the actual volume in the trenches, we see the YTD sales volume at +3.4% in total with the South region at +1.1% and the West at +3.4%.
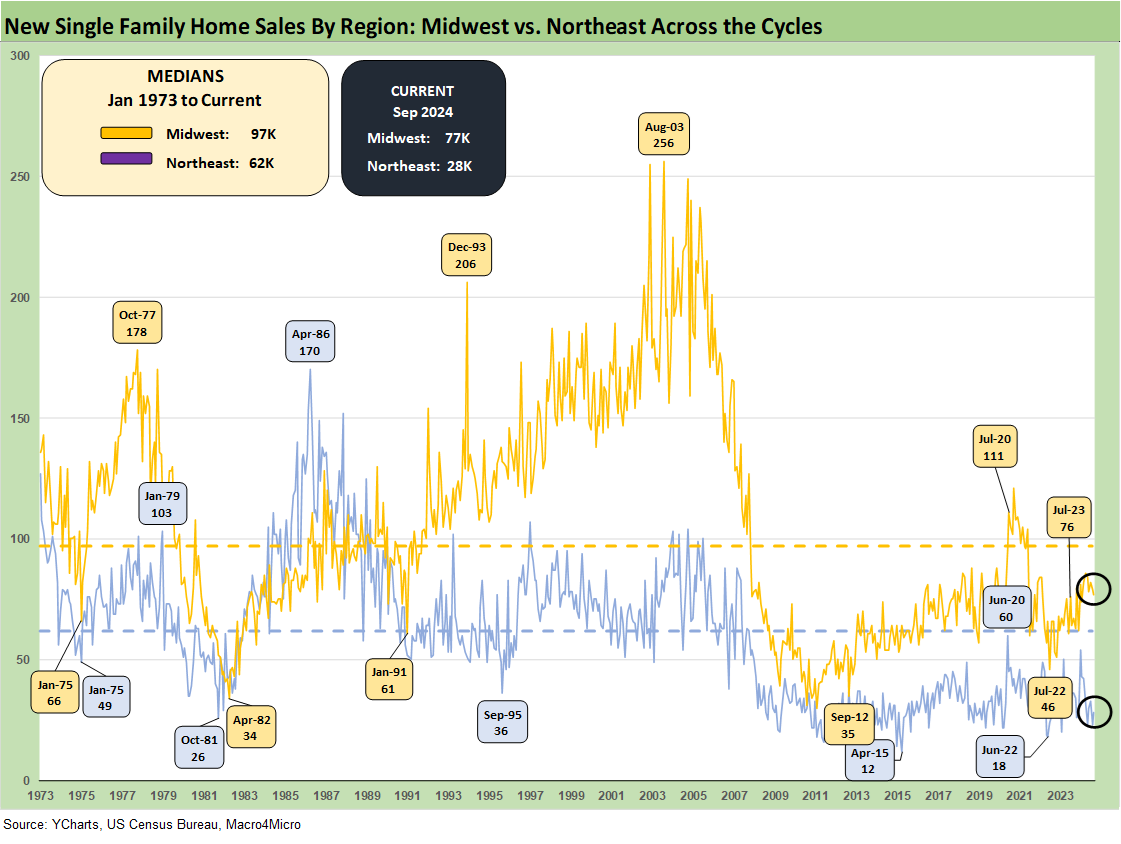
The two smallest markets include the Midwest at 10% of total and Northeast at 4% of total with sales derived on a SAAR basis. On a not seasonally adjusted (NSA) basis, we see the Midwest sales volume at +19.2% YTD and the Northeast at -1.1%.
See also:
Durable Goods Sept 2024: Taking a Breather 10-25-24
Trump, Trade, and Tariffs: Northern Exposure, Canada Risk 10-25-24
State Unemployment Rates: Reality Update 10-22-24
Footnotes & Flashbacks: Credit Markets 10-21-24
Footnotes & Flashbacks: State of Yields 10-21-24
Footnotes & Flashbacks: Asset Returns 10-20-24
Mini Market Lookback: Banks Deliver, Equities Feel the Joy 10-19-24
Trump at Economic Club of Chicago: Thoughts on Autos 10-17-24
Retail Sales Sep 2024: Taking the Helm on PCE? 10-17-24
Industrial Production: Capacity Utilization Soft, Comparability Impaired 10-17-24
CPI Sept 2024: Warm Blooded, Not Hot 10-10-24
HY OAS Lows Memory Lane: 2024, 2007, and 1997 10-8-24
Payroll Sept 2024: Rushing the Gate 10-4-24
Credit Returns: Sept YTD and Rolling Months 10-1-24
Housing and Homebuilders:
Existing Home Sales Sept 2024: Weakening Volumes, Rate Trends Worse 10-23-24
PulteGroup 3Q24: Pushing through Rate Challenges 10-23-24
Housing Starts Sept 2024: Long Game Meets Long Rates 10-18-24
KB Home: Steady Growth, Slower Motion 9-26-24
New Home Sales Aug 2024: Waiting Game on Mortgages or Supply? 9-25-24
Lennar: Bulletproof Credit Despite Margin Squeeze 9-23-24
Existing Homes Sales Aug 2024: Mortgages Still Rule 9-19-24
Home Starts Aug 2024: Mortgage Rates to Kickstart Hopes Ahead? 9-18-24
Harris Housing Plan: The South’s Gonna Do It Again!? 8-28-24
New Home Sales July 2024: To Get by with a Little Help from My Feds? 8-24-24
Credit Crib Note: PulteGroup (PHM) 8-11-24
Credit Crib Note: D.R. Horton (DHI) 8-8-24
New Homes Sales June 2024: Half Time? Waiting for Mortgage Trends 7-24-24
Homebuilder Equities: “Morning After” on Rate Optimism 7-12-24
Homebuilders: Equity Performance and Size Rankings 7-11-24
Credit Crib Note: KB Home 7-9-24
Lennar: Key Metrics Still Tell a Positive Macro Story 6-20-24
Credit Crib Note: NVR, Inc. 5-28-24