
PCE Inflation Sept 2024: Personal Income and Outlays
Headline PCE inflation was favorable while Core PCE stayed sticky tied to the usual culprit of Services. Income and Consumption were neck-and-neck.


The Sept 2024 Personal Income & Outlays release showed a solid consumer sector on income and personal consumption expenditure trends.
We see helpful overall inflation profiles in headline PCE and related line items even if falling a bit short on Core PCE inflation for the needs of UST bulls.
Headline PCE MoM of +0.2% saw Services at +0.3% with Goods at -0.1% rolling up into YoY PCE at +2.1% but Core PCE at a stubborn +2.7% in a Services-heavy economy.

The above chart frames “fed funds minus Core PCE” as one gauge of the real fed funds relationship. The inversion from the 3M UST is still a glaring anomaly in the context of past cycles and especially a cycle where the FOMC has returned to easing mode (see Footnotes & Flashbacks: State of Yields 10-27-24).
At the current +2.2% differential, the FOMC has ample room to “shave some points” without actually getting back to the long-term median of +1.3%. The FOMC will not get back to the negative fed funds of late 2022 that actually constituted “accommodation” even while hiking (see Fed Funds-CPI Differentials: Reversion Time?10-11-22, Fed Funds, CPI, and the Stairway to Where? 10-20-22, Fed Funds vs. PCE Price Index: What is Normal? 10-31-22).
A reversal of fed funds and inflation back into negative real fed funds would take a shocking shift in inflation or some type of major energy problem and supplier chain meltdown. The former would take a material Iran escalation and bigger problems in the Middle East. The latter (supplier chain breakdown) would take some idiot starting a major trade war.
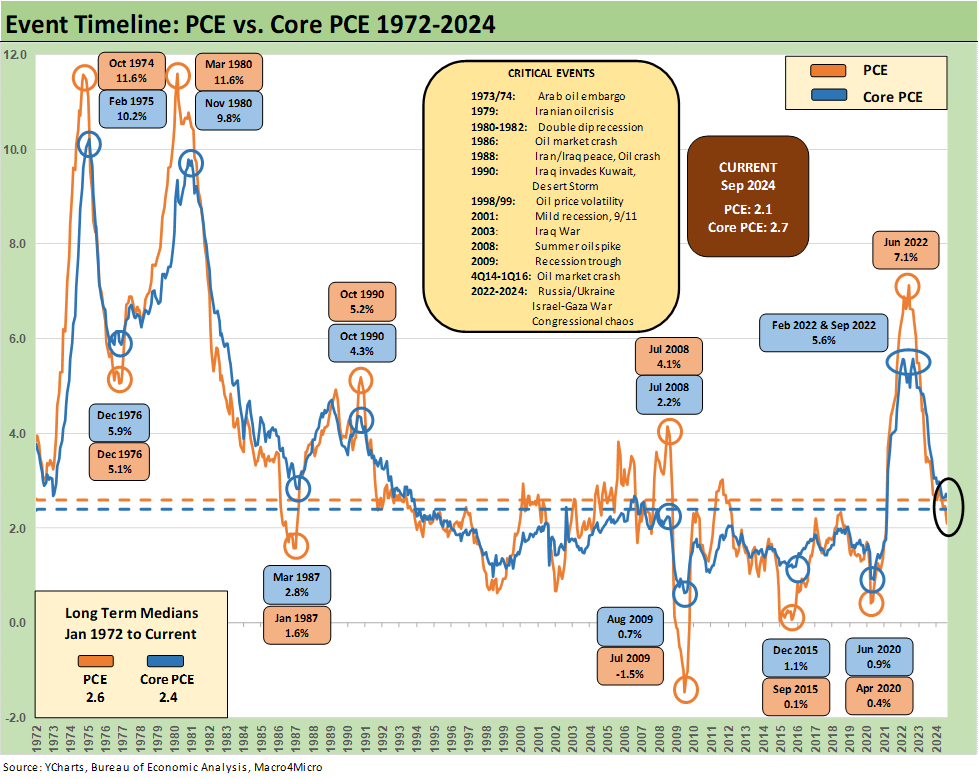
The above chart updates the running timelines from 1972 for PCE vs. Core PCE. We include a box with some critical events for memory lane. The history of PCE offers a reminder that this inflation cycle of 2022-2024 was a walk in the park compared to the post-oil embargo stagflation that started in late 1973 and turned into a case study in pain during 1974 before it ended in early 1975.
The chart then revisits round two of brutal inflation in 1979 as Volcker arrived on the scene. The Iranian mini-oil crisis in 1979 was on the way into the double-dip recession and stagflation period of 1980-1982.
This long-term timeline offers the median data points of +2.6% for headline PCE (i.e. we are now well below median at +2.1%) and a Core PCE median of +2.4% (we are now above median on Core PCE at +2.7%).
This history tends to call into question the feasibility of a 2.0% target, but that is why FOMC members like to be ambiguous on the term “inflation target” to the point of using Core PCE or headline PCE at their leisure.
The Headline PCE of the early/mid-1970s and 1979-1982 had a heavy dose of energy inflation pressure. In this current market, energy is deflating again. Energy deflates in a way that Food inflation generally does not (see Inflation Timelines: Cyclical Histories, Key CPI Buckets 11-20-23). Energy cuts across raw material costs (notably petrochemicals), power, and freight and logistics pricing that passes costs along. It is about a lot more than consumers at the gasoline pump.

The above chart updates Headline PCE vs. Core PCE with a shorter timeline of 1997-2024. The timeline shows the median of Headline PCE at +1.9% and Core PCE at +1.7% but those numbers included (in no special order) a heavy dose of ZIRP, two recessions, a few oil price crashes, a systemic bank system crisis, a housing bubble implosion, a pandemic, and the longest recession since the Great Depression.

The above chart updates the long-term differential between Headline PCE and Core PCE, and the takeaway is that the difference is negligible at the median. Dislocations between the two are usually wrapped around major swings in energy pricing.

Getting into the consumption vs. income trends, we look at the timeline from just before the tightening cycle. We see strong PCE and income both of this week’s releases. The consumer weighed in with very strong PCE numbers in the first estimate of 3Q24 GDP (see 3Q24 GDP Update: Bell Lap Is Here 10-30-24). The strength in 3Q24 PCE at +3.7% saw +6.0% in Goods with +8.1% in Durables and +4.9% in Nondurables. PCE also saw a smaller +2.6% growth in Services for 3Q24, but the Services line in dollar amount is around double the Goods line.
In the PCE report above for Sept, we see MoM growth of +0.5% in current dollars vs. +0.3% for current dollar income. The chart above captures the pattern of the Income vs. PCE relationship since just before the end of ZIRP in March 2022.
For YoY, we see Real Personal Consumption Expenditures at +3.1% vs. Real Disposable Income at +3.1%. The YoY breakdown for real PCE Goods is +2.8% (Durables +3.4%, Nondurables +2.5%) and Services at +3.2%.
When the smoke clears on the moving parts of Personal Income, Disposable Personal Income and Personal Outlays, the savings rate ticked lower in Sept to +4.6%, down from +4.8% in Aug 2024 and below the 5% handles seen earlier in 1H24.

The above is a replay chart we use each month to flag the DPI swings that came with the three COVID relief/stimulus packages with two under Trump and one under Biden. Trump signed the CARES Act in March 2020 (shows up in the DPI in April 2020) and Trump also signed the Dec 2020 legislation disbursed in Jan 2021 (he never seems to mention that one!). Biden signed the America Rescue Plan (disbursed in March 2021). The DPI and PCE wave tied to each of those shows up in the chart above.
As a reminder, the vaccine was just becoming available on a wide scale in early 2021 after the vaccine approval headline hit around Nov 9, 2020. There was still a deadly version of the virus hammering the country before a less threatening round of COVID later in 2021 and beyond. That factors into demand patterns and inexact lag effects.
The typical simplistic and misleading economic “analysis” by Trump and his partisans is that the single stimulus plan signed by Biden in early 2021 was the cause of all inflation. He forgets the one he signed in Dec 2020 disbursed in Jan 2021 and the invasion of Ukraine by Russia and his pal Putin in Feb 2022 that also saw an ensuing spike in inflation to a June 2022 CPI high 9.1%.
The widespread supplier chain meltdowns and freight and logistics rates that literally multiplied get zero airtime from Trump or allies. That lack of grasp on supplier chains is why Trump is so willing to dive back into a tariff-based strategy that already failed in 2018-2019. He plans to go that trade clash route again in 2025-2026 but in more spectacular fashion given its proposed scale. The tariff-inflation or tariff-capex-expense linkage just does not sink into his economic plan thought process.
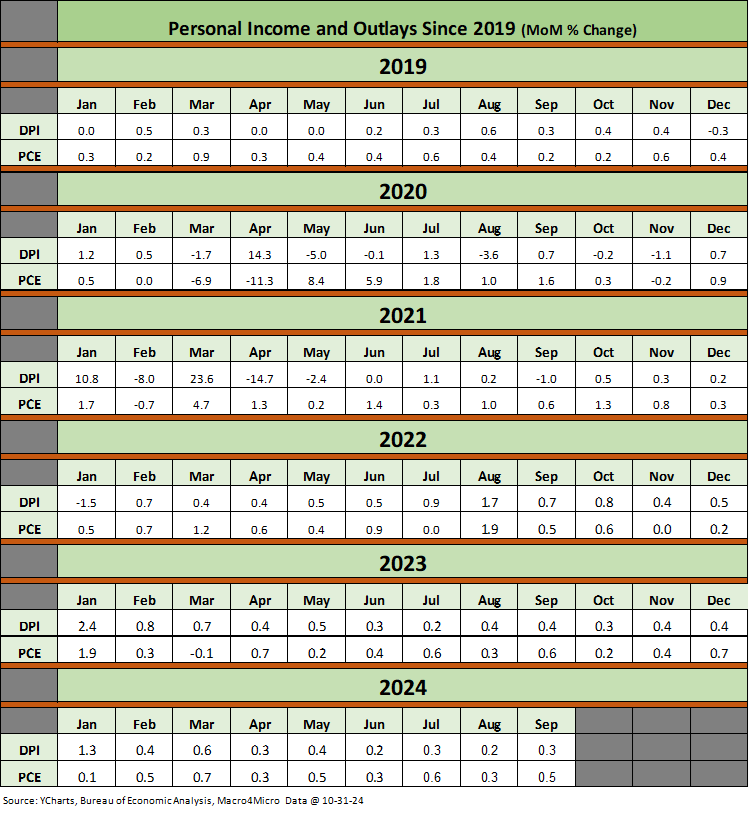
The above table updates the running MoM details for Disposable Personal Income (DPI) and Personal Consumption Expenditures (PCE). In the first glance at this release each month, we look at the Price Index data first, but the next stop is that income vs. outlays relationship.
The history for MoM moves (above) is for browsing purposes across the pre-COVID period into COVID, the stimulus periods, the inflation spike, the tightening cycle, and now in the early stages of the easing cycle.
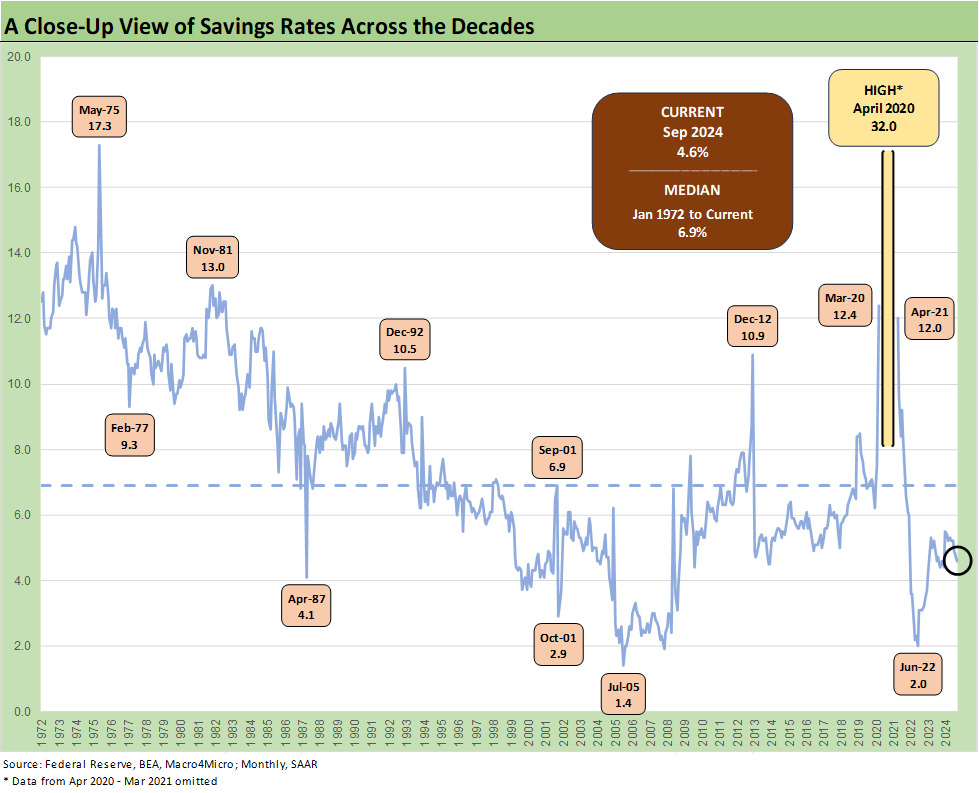
We wrap with the savings rate timeline from the bad old days of the early 1970s across the periods of stagflation, recessions, bubbles, excess credit for consumers and corporations, the systemic panic, the easy money of the post-crisis ZIRP years, and then into the first major inflation fighting period since the “Big One” 4 decades ago.
The current 4.6% savings rate is below the 6.9% long-term median but well above the June 2022 lows of 2.0%. The 1.4% lows of July 2005 came during the peak homebuilding year and the period of peak refi and high LTV blank checks.
See also:
Employment Cost Index Sept 2024: Positive Trend 10-31-24
3Q24 GDP Update: Bell Lap Is Here 10-30-24
The Politics of Objective GDP Numbers: “Flex Facts” on Growth 10-30-24
Tariffs: The EU Meets the New World…Again…Maybe 10-29-24
Footnotes & Flashbacks: Credit Markets 10-28-24
Footnotes & Flashbacks: State of Yields 10-27-24
Footnotes & Flashbacks: Asset Returns 10-27-24
Mini Market Lookback: Burners on Full 10-27-24
Trump, Trade, and Tariffs: Northern Exposure, Canada Risk 10-25-24
Durable Goods Sept 2024: Taking a Breather 10-25-24
New Home Sales: All About the Rates 10-25-24
PulteGroup 3Q24: Pushing through Rate Challenges 10-23-24
Existing Home Sales Sept 2024: Weakening Volumes, Rate Trends Worse 10-23-24
State Unemployment Rates: Reality Update 10-22-24
Housing Starts Sept 2024: Long Game Meets Long Rates 10-18-24
Trump at Economic Club of Chicago: Thoughts on Autos 10-17-24
Retail Sales Sep 2024: Taking the Helm on PCE? 10-17-24
Industrial Production: Capacity Utilization Soft, Comparability Impaired 10-17-24
CPI Sept 2024: Warm Blooded, Not Hot 10-10-24
HY OAS Lows Memory Lane: 2024, 2007, and 1997 10-8-24