
Footnotes & Flashbacks: Asset Returns 11-10-24
Election week moved the needle on a wide range of benchmarks and industry groups with a heavy reliance on hope for the 2025 variables.

You told me China pays the tariffs!? Bite him Toto!
The wild election week brought a risk rally and confused UST curve as the markets were also able to avoid a conniving unethical certification process and more capitol ultraviolence that would have been a lot worse this time.
From here, the revenue and earnings handicapping should start to morph into more transparent forward valuation assumptions including estimating tariffs (How soon? How high? How much retaliation? Supply-demand imbalances and pricing impact?) and mass deportation side-effects on trade and geopolitics (How many? Where from? Reactions from other countries, notably Mexico? Use of tariffs for deportation leverage? Wage inflation impact? Spiral of violence?).
With credit spreads tighter and in line with mid-2007 and late 1997 trading levels, relative value in credit markets will be harder to defend, but the asset allocation decision faces a juggling act of fundamentals, duration risk, and a shrinking return on cash that will need to be reallocated.
For now, the expectation of materially less regulation and a rollback of many rules and Biden policies keeps bullish valuation assumptions intact. Some key markets can rely on the rollback of agency powers after the Chevron case (i.e., judges rule on interpretation, not the agencies) and a partisan Supreme Court that is more about Trump than statutes, common sense, and the Constitution.

The above chart updates the return metrics for the major debt and equity benchmarks we track each week. The rolling 1-month for debt shows 3 of 4 in negative range for the 1-month period after all 4 were negative last week. HY had another round of spread compression with a -10 bps tightening on Friday to bring the week to -20 bps (see Mini Market Lookback: Extrapolation Time? 11-9-24).
The election was sobering for the “pro-Democracy “and “integrity in the White House” crowd, but a few years of inflation sent the Harris team to a defeat similar to those seen after past bouts of serious inflation pain. We saw the curse of inflation in past years derail President Ford in 1976 and later President Carter in 1980. The 2024 election was the first Presidential election coming off a brutal round of inflation since Reagan-Carter. Such inflation spikes are rare and the electorate is now 3 for 3 on that score in the postwar era (see The Inflation Explanation: The Easiest Answer 11-8-24).
There will be no shortage of griping and “morning after” recriminations on how it all played out and what it says about the electorate, but we have had so many more dramatic beatdowns in past years. It is good process to do the short list thought drill on how a guy like Trump could win a majority and what led to Harris getting almost 11 million less votes than Biden in 2020 with the back end of the votes still rolling in (see Morning After Lightning Round 11-6-24).
You can lay the election results off on inflation as the easy answer or the rampant mis/disinformation on the economy with a voter base losing interest in facts and concepts. You can make it about race and gender, Latino alpha males on hormones, or gender caps that did not play out as planned for women with their doomsday device of Rose v. Wade. The abortion weapon in the vote ended up more like a pack of firecrackers than a guided missile. That was a shock to many.
The postmortem focus also could be dominated by bitterness over Biden getting cocky and not up to the job, then waiting too long, and almost rigging the process for Harris (who ran a great campaign in a short time). Some felt that took away the ability to escape blame when another candidate could separate themselves from Biden/Harris policies. That seems to be the short gripe list. Merrick Garland sitting on his hands for too long did not get much airtime.
Emotions will soon meet the boring, objective “debits and credits” of policy…
The venting is therapeutic, but it does not matter for the next round of market events and asset return performance. That will be about fundamental trends across industries, asset quality, revenue and earnings, etc. Every tariff paid is an economic event and accounting entry. Trump has never been great at accounting integrity according to the courts, but even he must understand that payment is a “credit” to someone’s cash account.
Trump is either lying or stupid on the tariff topic. On the other hand, he might just be smart enough to know he can lie to stupid people who might believe the selling country – not the buyer – pays the tariff. The “debit side” of the tariff’s “credit to cash” for the buyer is not worth debating any more than where the sun rises.
Let’s say for argument’s sake all equity analysts know the difference. Their models into 2025 will require some consideration over what tariffs mean for cost of sales (e.g. tariffs and inventory costs), how that might flow into prices, and what higher prices would mean for inflation and what higher prices mean for volumes (the “elasticity thing”). Do the prices of many things go up (shaking up the Fed and market valuation discount rates) and then does the volume slide (e.g., on higher auto prices)? Will the supply-demand be so out of balance to add even more price pressure?
If economics is the “dismal science” that does not go away, the thrills and excitement of double entry accounting and FASB rules come into play as well. Those get typed into excels by analysts and then they decide if there will be flat multiples or contraction or expansion in multiples. That will be interesting soon enough when the decisions and policies start flowing into place.
For now, there is a lot of “wait and see” and more than a little “FOMO” in the price action since you know (and knew) the economy was going well and now you will get more M&A, lower regulatory obstacles, lower floating rate debt, and lower corporate taxes than you would have under Harris.
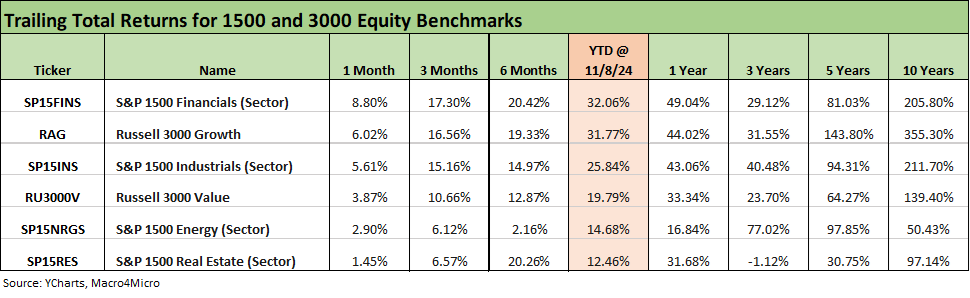
The above chart updates the 1500 and 3000 series, and we see the banner week from small caps especially after the election. We line up the asset classes in descending order of YTD returns. It is notable that the 1-month is in the same order as YTD. Energy and Real Estate are the lines that have swung around quite a bit this year on either oil prices or UST rates (or adverse or positive real estate headlines).
We see Financials and Growth back on top after numerous Regionals and SMid banks were getting hammered on real estate fears along the way. The Real Estate asset quality anxiety has not only subsided, but the Regional Bank ETF (KRE) keeps showing up in the top tier of performance. KRE is #1 this week, for 1-month and for LTM as we detail further below in our group of 32 benchmarks and ETFs. When Financials, Growth and Industrials lead the way in the rankings as they have been since before the election, that is a good news proposition overall.
The question then is “Why do we need a radical overhaul of trade that flows directly into the consumer and corporate sector?” The tariff fixation and mass deportations are policies that look like bad economics to us (and many others). We will see whether economics and brutal social divisions can reconcile and keep the markets out of more inflation and more market setbacks at a time when the deficit and sovereign debt story is getting scarier each year (see US Debt % GDP: Raiders of the Lost Treasury 5-29-23).
The rolling return visual
In the next section, we get into the details of the 32 ETFs and benchmarks for a mix of the trailing periods. Below we offer a condensed 4-chart view for an easy visual on how the mix of positive vs. negative returns shape up. This is a useful exercise we do each week looking for signals across industry groups and asset classes. We also have a YTD version that we include in the broader commentary on the time horizons further below.

The immediate visual grabber is a great 1-week, great 3-month and stellar LTM. We see a mixed 1-month on the back of an adverse move in rates hitting bond ETFs and some interest rate sensitive equities. We don’t include YTD in the above chart, but that time horizon only posted a single negative with the long duration 20+ Year UST ETF still in the red YTD. The LTM duration winnings include the massive UST rally of late 2023.
The Magnificent 7+ heavy ETFs…
Some of the benchmarks and industry ETFs we include have issuer concentration elements that leave them wagged by a few names. When looking across some of the bellwether industry and subsector ETFs in the rankings, it is good to keep in mind which narrow ETFs (vs. broad market benchmarks) get wagged more by the “Magnificent 7” including Consumer Discretionary (XLY) with Amazon and Tesla, Tech (XLK) with Microsoft, Apple, and NVIDIA, and Communications Services (XLC) with Alphabet and Meta.

We already looked at the tech bellwether performance in the Mini Lookback we posted yesterday. The Tech bellwethers came up all positive this week with Tesla riding the Team Trump bandwagon or maybe the Elon/Donny love train. Some might argue Musk was the Conductor and owned the locomotive transporting the misinformation supply. Either way, Tesla rang up 29% on the week and 65% over 3 months. Apple and Microsoft lagged on the week. For 3 months, only AAPL, MSFT, and GOOG were in single digits.

The 1-week asset returns show the strongest set of numbers with the collection of short time horizons the best since late 2023. Regional Banks (KRE), the small cap Rusell 2000 (RUT), Financials (XLF), and Midcaps (MDY) in the top quartile are very reassuring since the mix tells a story of a market perception of balance rather than the Mag 7 fixation that had dominated much of 2023-2024. We see Industrials (XLI) just on the other side of the top quartile at #9, so the mix is favorably balanced.
The asset quality confidence was very much in evidence during earnings season for the largest banks. An interesting trend from here if rates keep rising and tariffs and duration have the expected negative effect on the economy is how rates flow into the banks and the risk of more longer-term real estate valuation pressures.

The 1-month numbers are much better this week after the prior two weeks had ugly return numbers. For this week, the rolling 1-month numbers still show bond funds holding 4 of the 8 slots in the bottom quartile. We see the long duration UST 20+Y ETF (TLT) last among bond ETFs. Interest rate sensitive equities were under pressure, and we see Homebuilders (XHB) in last place. EM questions and debates on China show up in the EM Equities (VWO) and Base Metals (DBB) weakness.
The winners put up some exceptional numbers with Regional Banks (KRE) at #1 and small caps (RUT), Midcaps (MDY) and tech-centric NASDAQ all in the top quartile. We are not fully following the plot on Transports (XTN) other than Airlines doing very well the past month coming out of earnings season. The cyclical and tonnage wildcard would be very unpredictable in the event of major trade flow disruptions for other Transport subsectors. Then again, the potential for a heavy inventory build ahead of Trump tariffs could make for some additional discovery into year end and early 2025 ahead of the countdown to tariffs getting implemented.

The running 3-months kept the beat going that had already been in place for many industry groups during 3Q24 earnings season and in the aftermath of the Fed easing. The score of 30-2 is a favorable sequential move from last week’s 23-9 with only 2 bond ETFs (TLT, GOVT) in the red zone. We see 6 bond ETFs in the bottom quartile joined by the Healthcare ETF (XLV) and Consumer Staples (XLP).
The median of the 32 line items for 3-month returns was over +8% which is a juicy run rate with almost half the 32 (15 of 32) in double digit return range. Consumer Discretionary (XLY) weighed in at #1 at +24.1% on very strong numbers from Tesla (+61.5%) and Amazon (+25.6%). Regional Banks (KRE) posted a strong #2 at over +23% with Transports at #3 at almost 21%. Financials (XLF), Small Caps (RUT), and Industrials (XLI) all in the top quartile warm the heart on the way into a major test of resilience for so many industries with tariffs and mass deportation on the horizon and a potential struggle to see longer rates move lower.
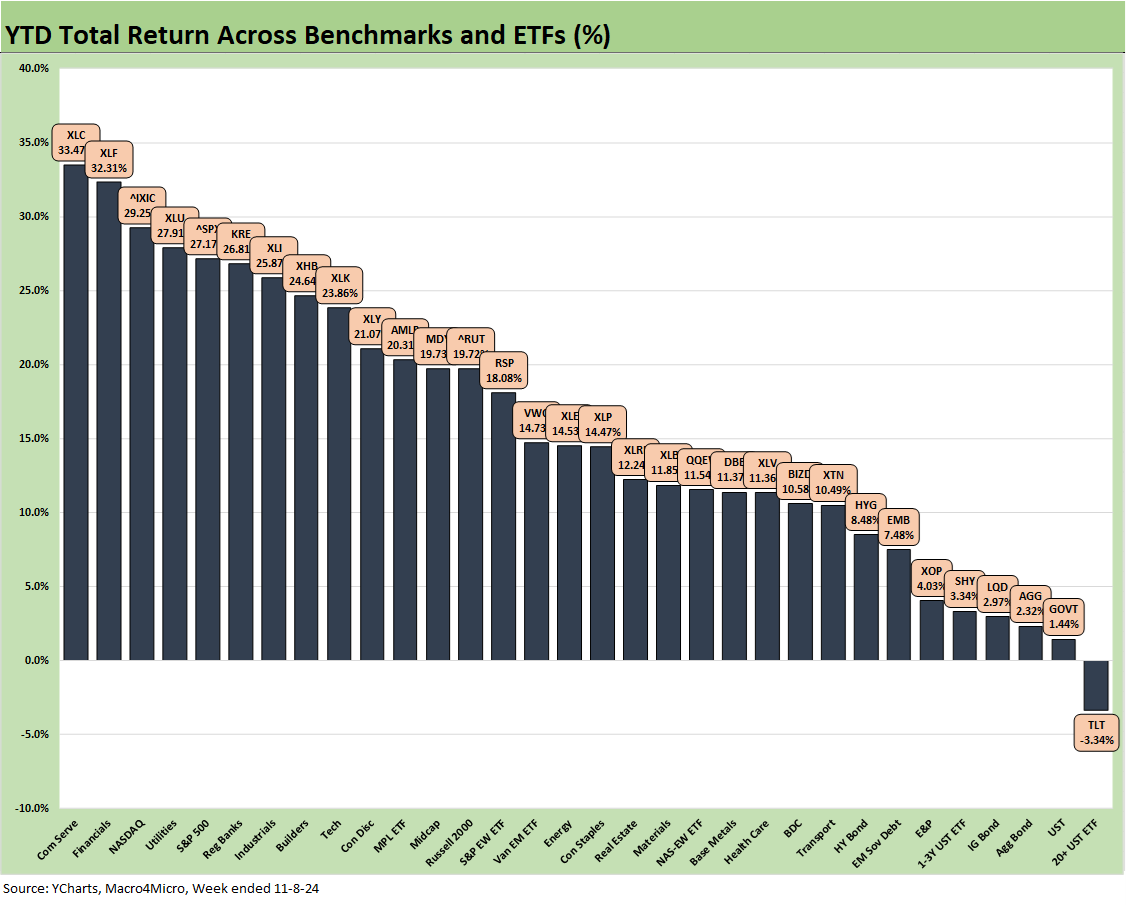
The YTD timeline has a score of 31-1 with only the long duration UST ETF (TLT) in the red. The range from top to bottom is almost 37 points with the median return for the mix at around 14.5%
We see bond ETFs holding the bottom 5 and 7 of 8 in the bottom quartile with E&P (XOP) the only equity ETF in the bottom quartile. We see 24 of 32 in double digits and 24 of 25 equity benchmarks and ETFs in double digits. The top quartile is all above 20% with the #1 Communications Services (XLC) at 33.5% and #2 Financials (XLF) at 32.3%.
The top quartile includes the two large cap benchmarks in the NASDAQ and S&P 500 with the two financial ETFs (KRE XLF), Industrials (XLI), Utilities (XLU), and Homebuilders (XHB) for a healthy mix. The main Mag 7 line items included Communications Services (XLC) in the mix, but the Tech ETF (XLK) was in the second quartile and NASDAQ 100 Equal Weight ETF (QQEW) was in the third quartile.

The LTM returns detailed above show a clean sweep in positive territory at 32-0 and the two ETFs on the bottom north of 5%. The Regional Bank ETF (KRE) is at #1 at almost +60% followed by Homebuilders (XHB) at #2 and +55% and Financials (XLF) at #3 and +48.5%.
A healthy financial system is never a bad sign when heading into a period of policy uncertainty, and the anxiety around commercial real estate threats to the regionals seems to be fading. The scenario of more consolidation, less regulatory checks on mergers and capital rules are getting more investors optimistic. Trump likes loose credit in the market.
Within the top quartile on an LTM basis, we see Communications Services (XLC) as the top performer across the tech-heavy chain and the Tech ETF (XLK) down across the line in the upper end of the second quartile. As a gut check on breadth, we see NASDAQ, Small Caps, the S&P 500, and Midcaps running from #6 to #9 in that order. We also see Industrials (XLI) in the top 5 in another healthy sign of diversification in the upper ranks.
See also:
Mini Market Lookback: Extrapolation Time? 11-9-24
The Inflation Explanation: The Easiest Answer 11-8-24
Fixed Investment in 3Q24: Into the Weeds 11-7-24
Morning After Lightning Round 11-6-24
Footnotes & Flashbacks: Credit Markets 11-4-24
Footnotes & Flashbacks: State of Yields 11-3-24
Footnotes & Flashbacks: Asset Returns 11-3-24
Mini Market Lookback: Showtime 11-3-24
Payroll Oct 2024: Noise vs. Notes 11-2-24
All the Presidents’ Stocks: Beware Jedi Mind Tricks 11-1-24
PCE Inflation Sept 2024: Personal Income and Outlays 10-31-24
Employment Cost Index Sept 2024: Positive Trend 10-31-24
3Q24 GDP Update: Bell Lap Is Here 10-30-24
The Politics of Objective GDP Numbers: “Flex Facts” on Growth 10-30-24
Tariffs: The EU Meets the New World…Again…Maybe 10-29-24
JOLTS Sept 2024: Solid but Lower, Signals for Payroll Day? 10-29-24
Trump, Trade, and Tariffs: Northern Exposure, Canada Risk 10-25-24
Durable Goods Sept 2024: Taking a Breather 10-25-24
New Home Sales: All About the Rates 10-25-24
PulteGroup 3Q24: Pushing through Rate Challenges 10-23-24
Existing Home Sales Sept 2024: Weakening Volumes, Rate Trends Worse 10-23-24
State Unemployment Rates: Reality Update 10-22-24
Housing Starts Sept 2024: Long Game Meets Long Rates 10-18-24
Trump at Economic Club of Chicago: Thoughts on Autos 10-17-24
CPI Sept 2024: Warm Blooded, Not Hot 10-10-24
HY OAS Lows Memory Lane: 2024, 2007, and 1997 10-8-24