
Footnotes & Flashbacks: Credit Markets 11-12-24
Equity rallies and credit contraction dominated the week, but the market will need to start rethinking the moving parts of policy in 1Q25.


Stephen Miller gears up for mass deportation in the “nation of immigrants.”
The credit markets stayed relatively quiet in a wild week of policy angst with risk pricing bullish and credit taking its cue from a major equity market rally with HY posting a -20 bps contraction on the week and IG crossing below the +80 bps threshold (see Footnotes & Flashbacks: Asset Returns 11-10-24).
The UST curve showed a case of nerves on Election Day before trending back down slightly while still well above Sept lows in the 10Y (see Footnotes & Flashbacks: State of Yields 11-11-24). As trading opens up today, the 10Y UST is heading higher again (+8 bps as we go to print).
The ability to keep emotions in check will be contained for now with less of a debt ceiling default threat and negligible likelihood of the crazies showing up on Jan 6 (with more guns this time) and markets generally liking certainty. From here the question will soon get back to “The certainty of what?!” The details on the scale of deportations and tariffs need some “filling in.”
The election leaves the GOP in charge with the odds for GOP House control remaining high. The election postmortems for the markets now need to be more about framing the forward risks than a Democratic Party autopsy (see Morning After Lightning Round 11-6-24, The Inflation Explanation: The Easiest Answer 11-8-24).
The biggest challenge for the market is framing what record tariffs will mean on a global scale and what “mass deportation” means in the minds of Trump and Miller in terms of scale and pace and related labor market and PCE fallout (see Trump at Economic Club of Chicago: Thoughts on Autos 10-17-24, Trump, Trade, and Tariffs: Northern Exposure, Canada Risk 10-25-24, Tariffs: The EU Meets the New World…Again…Maybe 10-29-24).

The above chart updates the YTD total returns and excess returns for IG and HY and by credit tier. Despite the setbacks on duration, the spread contraction and coupons carried the day. Many expected better news on duration in 2024, but credit spread contraction and slowly rising coupon rates made the difference for a solid performance in HY.
We see the total return for HY only modestly below the long-term nominal returns for equities, so that is in the “good news” category even if higher total returns were on the wish list. The low end of HY in CCCs provided strong numbers and a rational level of incremental returns for the higher risk taken. That is the way they write it up in the playbook.

IG and the BBB duration and spread challenge drama: The BBB tier is almost like an asset class by itself at a size of $4.2 trillion in face value. That is a multiple of the entire IG market back in 2007. The BBB tier has grown almost 6-fold since the June 2007 credit cycle peak. As we discussed along the way, the relative positioning in duration and credit risk appetite is the main wrestling match from here and the “BBB/BB combo” has been popular. We see shorter duration and middle tier risk (BBB and BB) is not a case of “no guts, no glory.” The tariff rhetoric and mass deportation still strikes us as shockingly bad economics that may have worked for political purposes short term.
Bank system confidence: The post-Trump rally in bank stocks sends a good message to the credit markets and health of the banks in a period that could see some policy execution risk on any combination of domestic economic “confusion” (tariffs, deportation) or geopolitics (Ukraine/Russia, Taiwan/China, Middle East with Gaza/Iran risks and potential Saudi policy shifts, etc.).
The tariff and deportation risk factor: We saw Jim Jordan on the weekend show circuit not willing to say more than 1.3 million in deportation numbers (and those were convicted criminals) and evaded attempts to say more with the election over. That leaves the bid-offer at 1 million-20 million or so, which obviously is a wide range of potential outcomes (!). Tariffs beckon as well, so the reaction of the markets will not run amok with risk aversion unless Trump offers more details and the decisions are more actionable in substance.
The 1997 comp: The 1997 and 2007 markets offer useful frames of reference with recent spread trends (see HY OAS Lows Memory Lane: 2024, 2007, and 1997 10-8-24). The IG and HY lows of 1997 saw HY below the +300 bps line for most of the year as the TMT binge was still cranking up. The 4Q97 period saw the Asian crisis start to spread, and then emerging markets went totally off the rails in 1998 (Russia default) and was a contributing factor to LTCM and multiple Fed cuts. During the late 1990s, global banks and brokers were swarming the US credit markets as Glass Steagall barriers were effectively gone and the securities firms still in the game. Overall, it was a grim underwriting cycle. The current HY bond cycle is much lower risk than 1997-1998 (today’s riskiest deals are in private credit). The year 1997 saw two more years of expansion, and that is the hope for 2025 subject to tariff and deportation outcomes.
The 2007 credit bubble: The comparable spreads to 2007 can make some investors extremely nervous, but the banks and brokers were ticking time bombs back in that bubble. Structured credit excess and de facto unlimited counterparty exposure (poorly measured or not measured) and domino risk left a fuse burning on the US and European bank system. That is not the case today by any stretch – unless everything in Dodd-Frank gets rolled back and anything the Fed or SEC did is erased. We doubt that will be a priority for GOP, who are locked in on rolling back a lot of regulations and prior programs (including Obamacare). Capital rules, taxes, fair lending regs, and kneecapping the CFPB runs across many headlines that rank high on theoretical wish lists in the bank trade press. The main victories that banks and shareholders are looking for could fall in the area of capital and mergers/consolidation.
Coupons matter: The distinction between yields and coupons has been a major item in HY in recent years after the ZIRP refinancing wave. Coupons will climb in 2025-2026 as new issue yields bring higher coupons with more new issue in a 7% yield market in HY. The slow and steady recovery in coupons will keep unfolding via new money issuance and refi trades. More cash income makes for a better story from the current par weighted coupon of 4.3% in IG (4.5% BBB) and 6.35% in HY (5.8% BB).
Duration: As with BB and HY lite, we also see more duration-lite strategies after the drama and pain of ZIRP flowing into a tightening cycle. The soaring levels of UST debt issuance also will need homes. To the extent the easy money of yields over 5% in cash are gone, there will be a need to opportunistically extend or reallocate toward risk. Many advisors will say “time to extend,” but the simple reality is that inflation risk lurks in tariffs and Trump will be looking to assure that the FOMC eases. That is a Trump vs. Fed battle that will come. The easy strategy is to focus inside 5 years with medium grade IG risk and reasonable quality HY. After all, a lower UST in 2Y-5Y could limit duration risk and allow opportunities for refi and extension in HY.
High yield quality mix and private credit as allocation detour: The BB tier as a focal point and the rise of HY lite strategies have left the BB tier well positioned. BBs are over 53% of HY index market value and 52% of face value and in stable hands. Quality spread waves are a fact of life but default risk in the tier presents lower risk than the exponentially higher average default rate than the B tier. That exponentially higher risk also applied to the move into the CCC tier. In the end, HY bonds present very low overall default risk and the outlook on that front is favorable in historical context. The most aggressively leveraged private equity deals are over in private credit and not concentrated in the HY bond universe as in past cycles.

The BBB vs. BB excess return convergence YTD might be worrisome for those who set their sundial by what the rating agencies say, but the performance has been consistent across the year and even inverted a few times. We would argue that it is always a good idea not to fixate on ratings per se and pick the name and sector concentration. For example, Energy is a huge BBB tier concentration on the cusp as is Autos, TMT, and Transport to name a few. There is a lot of room to maneuver on both sides of what is a relatively arbitrary speculative grade cusp.

The B vs. CCC tier excess return differential is perhaps the biggest surprise in 2024 given the numbers put up by the CCC tier. The constituent differentials and migration in and out of the CCC tier is always an adventure as defaulted bonds drop out and the downgraded Bs (sometime falling knives) drop in.

IG index spreads ran tighter by -9 bps to levels that are multidecade lows and inside the March 2005 +79 bps. The all-time lows of +53 bps of Oct 1997 would be very hard to reach.
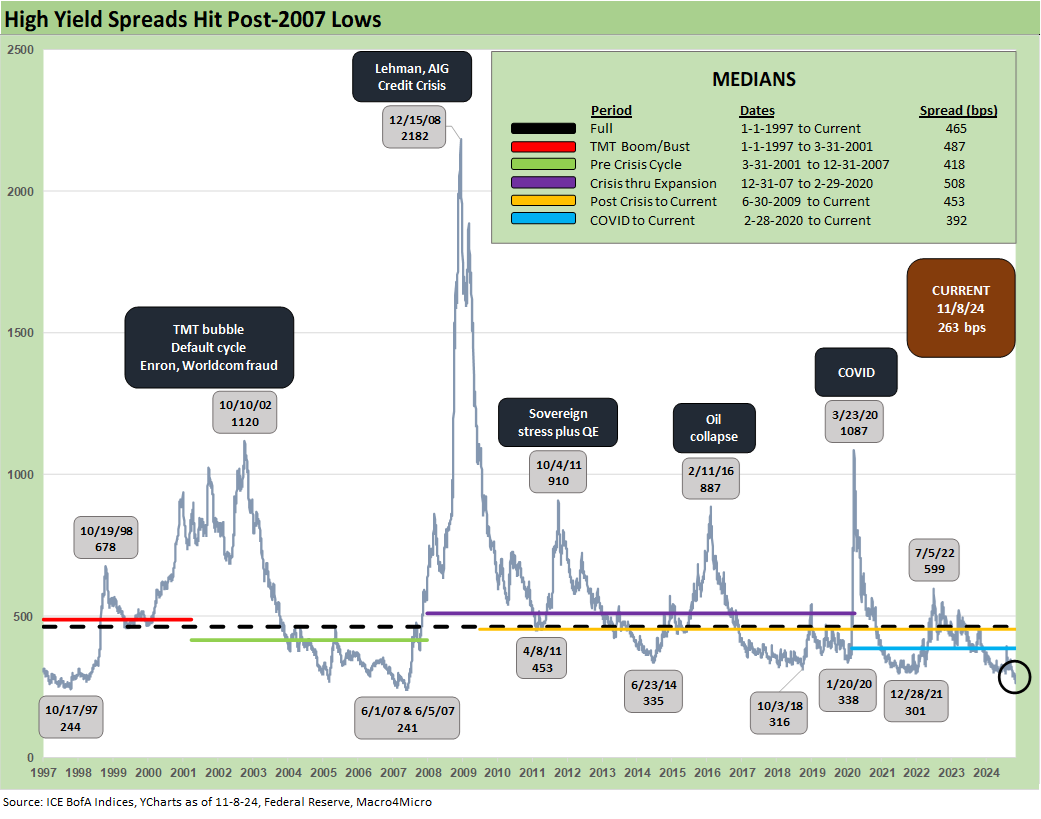
HY spreads ran tighter by -20 bps on the week including -10 bps on Friday as we covered in our Mini Lookback on the weekend (see Mini Market Lookback: Extrapolation Time? 11-9-24). The BB tier moved tighter by -17 bps, the B tier by -26 bps and CCC tier -20 bps.

The “HY OAS minus IG OAS” quality spread differential compressed more this week to +186 bps from +197 bps last week. That leaves relative credit compensation well below the long-term median of +327 bps.
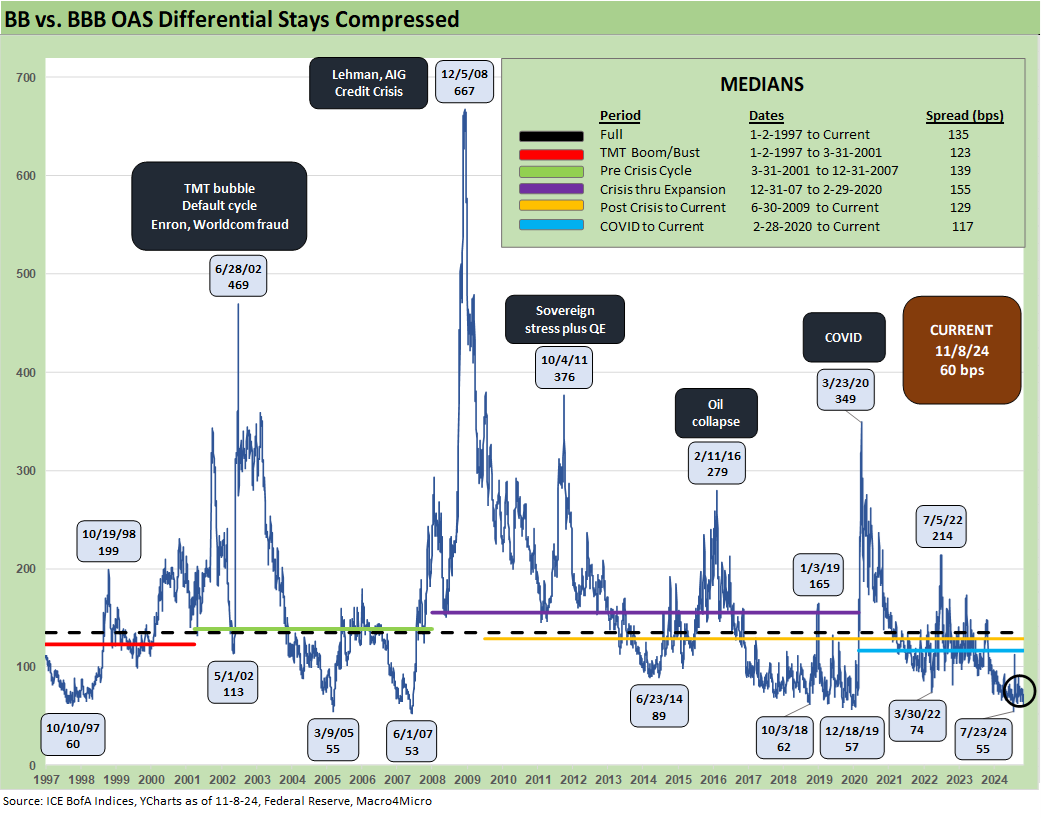
The “BBB OAS minus BB tier OAS” differential narrowed back to +60 bps this week from +68 bps last week. That is well inside the +135 bps median. The multicycle low of +55 bps in July 2024 was on top of the early June 2007 and March 2005 lows. The current +60 is on top of the Oct 1997 lows.
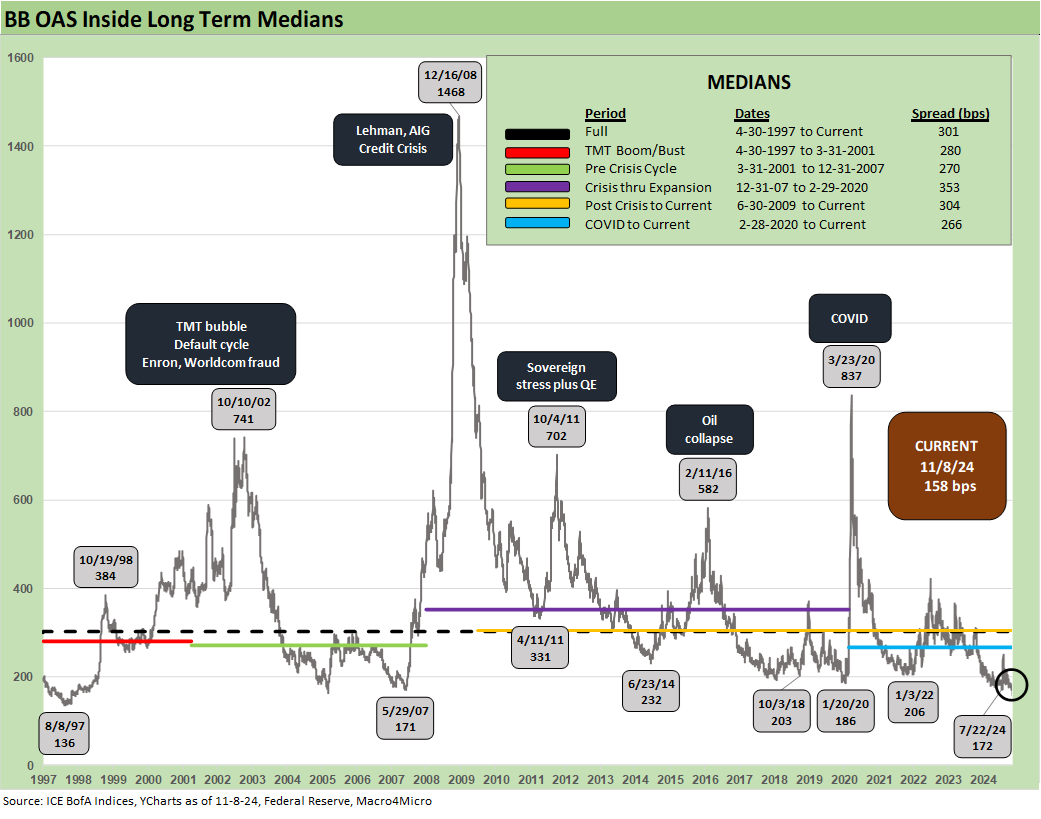
The BB tier OAS of +158 bps is now inside the late May 2007 lows and moving closer to the August 1997 low of +136 bps. Recent post-crisis BB tier lows includes Jan 2020 at +186 bps, but the decline to below the +200 bps line was rare in past credit cycle peaks and well inside the +301 bps long-term median.

The B tier OAS was true to the pattern overall with a decline to +258 bps from +284 bps last week. That brings the B tier even closer to the June 2007 low of +236 bps and inside the 1997 lows. The long-term median is +468 bps.

The above chart updates the long-term time series for the B and CCC tier OAS that also highlights some of the brutal periods when the CCC tier diverged materially. We have looked at the uglier bouts of volatility in earlier credit commentaries when the B vs. CCC tier differentials were measured in dozens of points and the bonds behaved more like high risk equities, often trading at steep discounts to theoretical recovery value (see The B vs. CCC Battle: Tough Neighborhood, Rough Players 7-7-24).

The above chart shortens up the timeline for a more granular look at the B vs. CCC pattern across the tightening cycle and then into the rally and initial easing. There were plenty of constituent changes and more than a few distressed exchanges along the way (e.g. Carvana) that always make the aggregate CCC OAS a comparability problem across time. The rally to +721 on the CCC tier is inside the post-1997 median of +959.

The long term “CCC OAS minus B tier OAS” differential is plotted above from 1997. The current +463 bps level is near but inside the long-term median of +485 bps.
A look at yields…

The above chart updates the long-term history from 1997 for the IG YTW vs. the HY YTW. We see the pre-crisis median as the most relevant comparison given the post-crisis and COVID distortions of Fed policy (ZIRP, QE, normalization) that pull down the long-term median to 4.7% for IG and 8.0% for HY when you include a long stretch of ZIRP and other anomalies.
The pre-crisis median of 6.1% for IG and 9.3% for HY offer a more reasonable guide under more typical monetary policy frameworks and cyclical credit pricing. The current market presents near record low peak credit cycle spreads and an extremely low UST curve in context of the years outside ZIRP (see Footnotes & Flashbacks: State of Yields 11-11-24). The result is 5.1% in IG and 7.1% in HY.
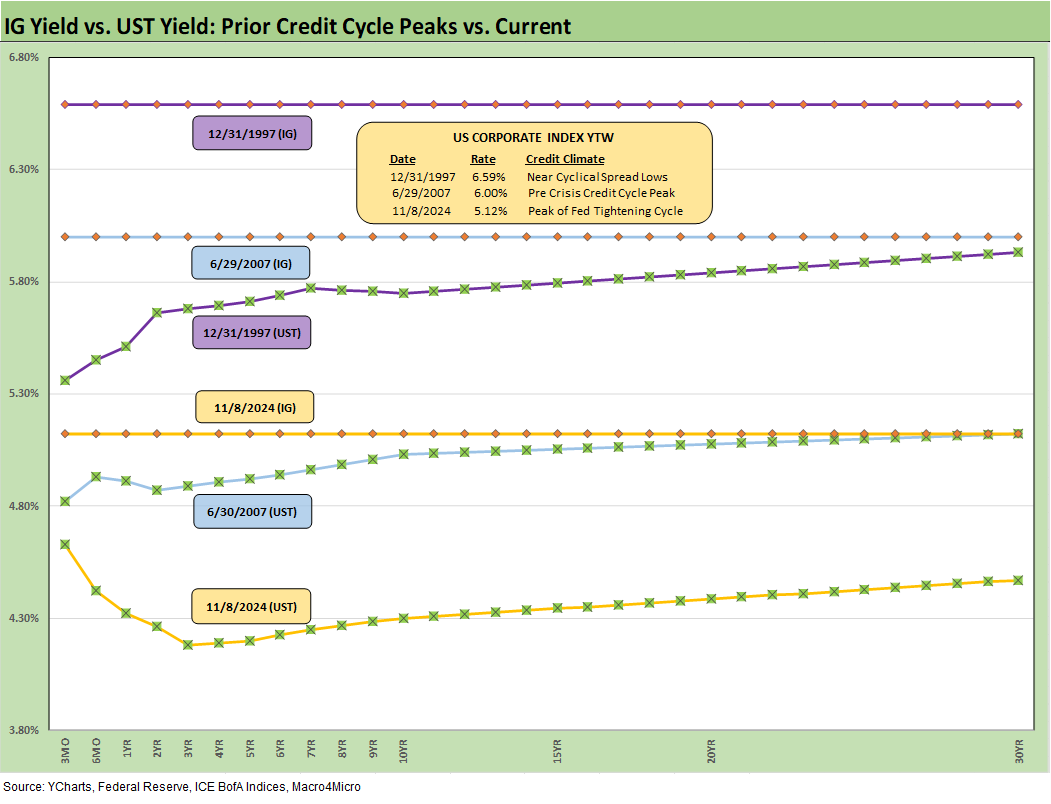
We update the most recent IG YTW on the horizontal lines and frame that against two of the most notable credit cycle peaks in June 2007 and late 1997. We also plot UST curves for each of those periods as frames of reference.
Despite the backup in UST yields during 2024, we still see a major divergence from prior peak credit cycle periods. Credit spreads now vs. then are not materially different, but the UST is meaningfully below those prior cycles.
Another notable distinction is those earlier UST curves in Dec 1997 and June 2007 were upward sloping from 3M (with a notch and minor inversion beyond 6M in June 2007). In contrast, the curve today is still notably inverted on the front end. How that curve shape will migrate toward flat is the debate with lower fed funds the easier call for now.

The above chart does the same exercise for HY that we used in the prior IG chart. Once again, the HY spread backdrop for both were very tight. We looked at some of these peaks and spread lows across time in another commentary (see HY Spreads: Celebrating Tumultuous Times at a Credit Peak 6-13-24).
See also:
Footnotes & Flashbacks: State of Yields 11-11-24
Footnotes & Flashbacks: Asset Returns 11-10-24
Mini Market Lookback: Extrapolation Time? 11-9-24
The Inflation Explanation: The Easiest Answer 11-8-24
Fixed Investment in 3Q24: Into the Weeds 11-7-24
Morning After Lightning Round 11-6-24
Payroll Oct 2024: Noise vs. Notes 11-2-24
All the Presidents’ Stocks: Beware Jedi Mind Tricks 11-1-24
PCE Inflation Sept 2024: Personal Income and Outlays 10-31-24
Employment Cost Index Sept 2024: Positive Trend 10-31-24
3Q24 GDP Update: Bell Lap Is Here 10-30-24
The Politics of Objective GDP Numbers: “Flex Facts” on Growth 10-30-24
Tariffs: The EU Meets the New World…Again…Maybe 10-29-24
JOLTS Sept 2024: Solid but Lower, Signals for Payroll Day? 10-29-24
Trump, Trade, and Tariffs: Northern Exposure, Canada Risk 10-25-24
Durable Goods Sept 2024: Taking a Breather 10-25-24
New Home Sales: All About the Rates 10-25-24
PulteGroup 3Q24: Pushing through Rate Challenges 10-23-24
Existing Home Sales Sept 2024: Weakening Volumes, Rate Trends Worse 10-23-24
State Unemployment Rates: Reality Update 10-22-24
Housing Starts Sept 2024: Long Game Meets Long Rates 10-18-24
Trump at Economic Club of Chicago: Thoughts on Autos 10-17-24
CPI Sept 2024: Warm Blooded, Not Hot 10-10-24
CarMax: Why Do We Watch KMX as a Bellwether? 10-3-24
Select Histories:
HY OAS Lows Memory Lane: 2024, 2007, and 1997 10-8-24
Credit Returns: Sept YTD and Rolling Months 10-1-24
HY Industry Mix: Damage Report 8-7-24
Volatility and the VIX Vapors: A Lookback from 1997 8-6-24
HY Pain: A 2018 Lookback to Ponder 8-3-24
Presidential GDP Dance Off: Clinton vs. Trump 7-27-24
Presidential GDP Dance Off: Reagan vs. Trump 7-27-24
The B vs. CCC Battle: Tough Neighborhood, Rough Players 7-7-24
HY Spreads: Celebrating Tumultuous Times at a Credit Peak 6-13-24
Credit Markets Across the Decades 4-8-24
Credit Cycles: Historical Lightning Round 4-8-24
Histories: Asset Return Journey from 2016 to 2023 1-21-24
Credit Performance: Excess Return Differentials in 2023 1-1-24
HY vs. IG Excess and Total Returns Across Cycles: The UST Kicker 12-11-23
HY Multicycle Spreads, Excess Returns, Total Returns 12-5-23
US Debt % GDP: Raiders of the Lost Treasury 5-29-23