
Employment Cost Index Sept 2024: Positive Trend
The Employment Cost Index ticks lower again in a positive trend for inflation and unit costs, but compensation growth is still ahead of inflation.


“Be happy in your work? We will pay above inflation…”
The decline in the ECI to +3.9% continues a favorable trend seen in 2024 with both wages and benefits moving lower but not quickly enough to signal consumer sector alarm with a healthy balance in place for now.
There is a tendency on the street and in the business media to avoid too many attempts to frame mass deportation fallout on compensation and the labor pool as a variable, but it remains the T-Rex in the room.
Private sector non-union jobs bring up the rear in compensation growth, and the theory is that the lower-pay services sectors especially will get hit the hardest on labor shortages.
Meanwhile, the idea of widespread tariffs is going to raise some questions on wage expectations on the employee side to meet rising prices while at the same time putting some industries in the crosshairs to retrench if such trade and deportation policies disrupt the status quo.
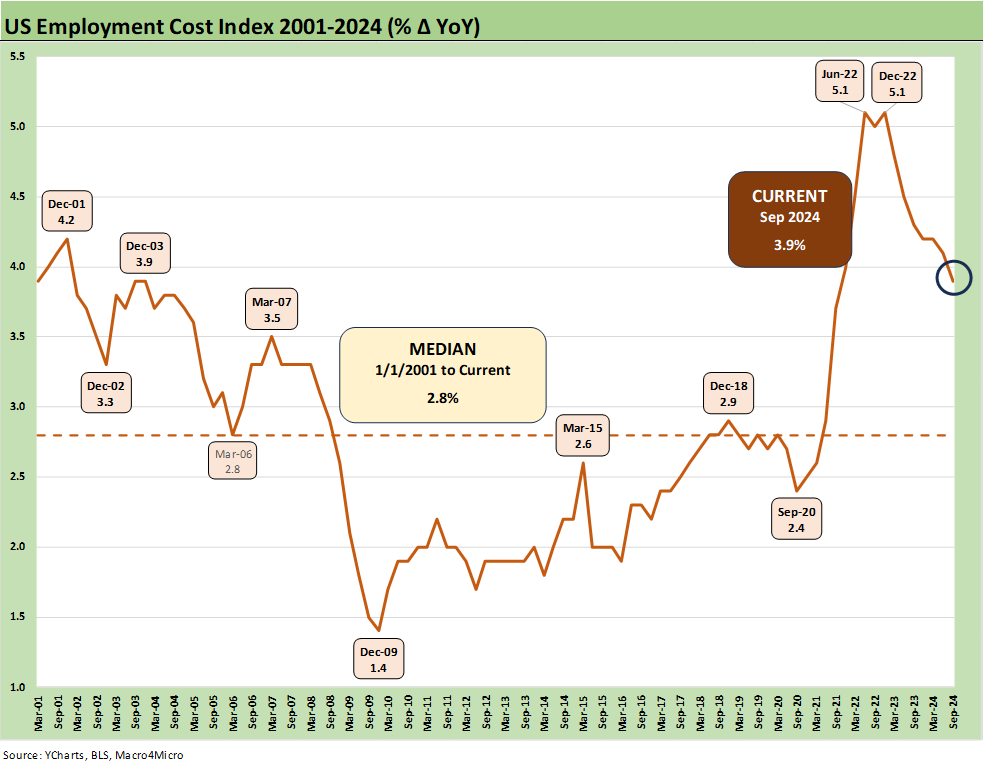
The above ECI chart offers some more good news for the overall macro story with another sequential improvement in an important indicator that often flies under the radar screen (see links at bottom). The trend line for compensation costs moved lower again to below the 4.0% line with the +3.9% print in the September quarter. That is down from +4.1% in 2Q24 (see The Employment Cost Index June 2024 8-1-24) and +4.2% in the March quarter (see Employment Cost Index March 2024: Sticky is as Sticky Does 4-30-24).
The slight decline in the ECI is mirrored in Wages and Salaries at +3.9% in 3Q24 vs. +4.2% in 2Q24 while “Benefits” of +3.7% in 3Q24 was down a tick from +3.8% in 2Q24. The good news of a modest decline mitigates (in theory) some of the pass-through pressure on the wage-price connection. There are more than a few asterisks across private and public sector categories and how those will play out based on supply-demand for both labor and the related goods/services pricing. The shifts can be different across the union and non-union employee base.
The variance can be material across types of industries and collective bargaining status. For example, State and Local government compensation costs were +4.7% in 3Q24 vs. +3.6% for the private sector. The state and local growth was down from +4.9% in 2Q24 while the private sector was down from +3.9% in 2Q24. Private sector union workers weighed in at +5.8% with non-union at +3.4%.
The bottom line on these numbers is that they are moving in the right direction but still signal a healthy demand for labor that allows compensation to beat inflation.
Some major league battles of supply and demand ahead?
The “mass deportation” signs that were carried around proudly by attendees at the RNC in Milwaukee have been reflected in the latest Trump speech at Madison Square Garden with the “largest mass deportation in history” cited as a priority for “Day 1.” If that plan goes ahead, the ECI metrics into 2025 could be in for a serious rattling in the non-union private sector category, where presumably much of that target population (‘target” literally) is working. Some other subsectors such as construction are also exposed. That is a “stay-tuned” variable.
In the government ranks, the questions are not so easy with Trump looking to deploy the Project 2025 plan and purge large swaths of the Federal government work force that will also inevitably spill over into the state and local budgets on the connection points on programs that may be canceled or stripped of budgets. With Musk teed up to be the slasher in chief and general delivery boy of mass human carnage, it’s impossible to not to anticipate significant disruptions in ECI metrics and broadly in the labor pool. Musk is looking to move up to the next mass termination level from his gaming chair.
Mass deportations in tandem with mass terminations may not unfold subject to election outcomes, but the supply and demand for labor is still a wildcard for compensation and inflation trends. In a connection tied to policy plans, the potential for widespread tariffs will have effects on personnel budgets in many industries. We will cross that bridge when we come to it.
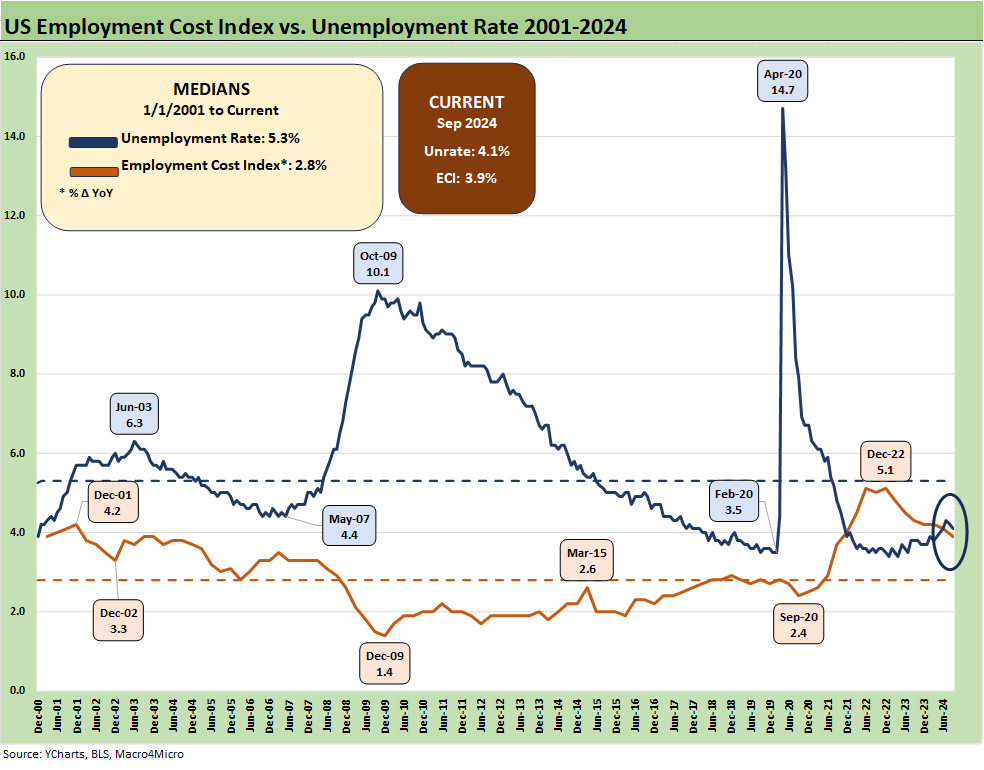
The above chart updates the simple relationship between unemployment and the ECI. The “bodies available” connection with “bodies needed” is intuitive in supply and demand. That always comes with the caveat of the mix across region, occupation and relative skill sets.
The issues around mass deportation will likely be the single biggest driving factor. The absence of mass deportation together with any pronounced trends toward economic contraction (recession) and consumer weakness could drive the low-end wage inflation lower more quickly. Mass deportation would have the opposite effect. The status quo is rate risk, and the economic status quo has been better in 2024 overall. We have a “brace for impact” risk dead ahead.
Employment Cost Index:
The Employment Cost Index June 2024 8-1-24
Employment Cost Index March 2024: Sticky is as Sticky Does 4-30-24
Employment Cost Index Dec 2023: Compensation Mixed Picture 1-31-24
Employment Cost Index Sept 2023: Expect the Expected 10-31-23
Employment Cost Index: Rings of the Redwood 7-28-23
Employment Cost Index: Slow Motion 4-28-23
Employment Cost Index: Labor vs. Capital …Tide Turning or Swirling? 2-1-23
See also:
3Q24 GDP Update: Bell Lap Is Here 10-30-24
The Politics of Objective GDP Numbers: “Flex Facts” on Growth 10-30-24
Tariffs: The EU Meets the New World…Again…Maybe 10-29-24
Footnotes & Flashbacks: Credit Markets 10-28-24
Footnotes & Flashbacks: State of Yields 10-27-24
Footnotes & Flashbacks: Asset Returns 10-27-24
Mini Market Lookback: Burners on Full 10-27-24
Trump, Trade, and Tariffs: Northern Exposure, Canada Risk 10-25-24
Durable Goods Sept 2024: Taking a Breather 10-25-24
New Home Sales: All About the Rates 10-25-24
PulteGroup 3Q24: Pushing through Rate Challenges 10-23-24
Existing Home Sales Sept 2024: Weakening Volumes, Rate Trends Worse 10-23-24
State Unemployment Rates: Reality Update 10-22-24
Housing Starts Sept 2024: Long Game Meets Long Rates 10-18-24
Trump at Economic Club of Chicago: Thoughts on Autos 10-17-24
Retail Sales Sep 2024: Taking the Helm on PCE? 10-17-24
Industrial Production: Capacity Utilization Soft, Comparability Impaired 10-17-24
CPI Sept 2024: Warm Blooded, Not Hot 10-10-24
HY OAS Lows Memory Lane: 2024, 2007, and 1997 10-8-24