
Payroll Oct 2024: Noise vs. Notes
We give some context to a distorted payroll month that will be quickly forgotten with the biggest moving parts of policy dead ahead.


The expectation of a lot of noise made for a heavy dose of forceful ambiguity in the early reactions to a minimal 12K payroll number. We needed to toggle back and forth between the “Household” and “Establishment” data in considering how to frame the effects of strikes, weather, and basic unemployment rate math across the totals of employed, unemployed, and the civilian labor force.
In a month like this, it is always good to head back to the occupational line items for a sanity check on where there was (or more to the point) was not payroll contraction. We look at payroll total by industry groups in the second half of the commentary.
The unemployment rate was unchanged at +4.1% from the Household Survey with 150K more people unemployed at 6.98 million in a civilian labor force that shrunk by -220K to 168.5 million. The number of employed declined by -368K in a series of moving parts that never makes sense to most humans.
In the establishment data, total payroll was around a high at 159 million for those who like to focus on the “Mo Paychecks, Mo Money, Mo Spending” school of economics that has been showing PCE driving higher and sustaining economic growth as it did in this week’s releases (see PCE Inflation Sept 2024: Personal Income and Outlays 10-31-24, 3Q24 GDP Update: Bell Lap Is Here 10-30-24).

The above bar chart shows the monthly job adds history from March 2022, which marked the end of ZIRP and the start of the tightening cycle. This timeline also marked the start of the energy dislocations and first full month of Russia-Ukraine economic impacts after the late Feb 2022 invasion (Feb 24, 2022).
For Oct 2024, we see 12K on job adds with more than a few asterisks stapled to it. The above chart includes the negative payroll revisions for Sept of -81K to +78K and Aug revisions of -31K to +223K. Almost all major industry groups were positive with the job losses in the Establishment Survey concentrated on transportation (Boeing strike) and Administrative and Waste Services (-48.5K in Temporary Help Services). To oversimplify, Boeing and “Temps” totaled over 80K without even thinking through Boeing supplier chain issues or businesses still closed from storm damage.
The payroll data was going to be especially important for Oct given how the Sept 2024 numbers roiled the UST market and called into question the FOMC’s move to -50 bps in round 1 of the easing process with the next one teed up for this coming week. The natural questions revolve around where the Fed might go from here in Nov-Dec 2024 as the first anniversary of the monster UST shift and equity and credit risk rallies of last year are upon us (see Footnotes & Flashbacks: Asset Returns 1-1-24, Footnotes & Flashbacks: State of Yields 1-1-24).
BLS and the storm effects…
The impact of the storm is not the main event in the bigger economic picture after a week with such strong PCE numbers, net favorable inflation results, good Employment Cost Index numbers for sentiment, and a JOLTS release that shows openings down but only slightly below the Trump era peak (Nov 2018) (see Employment Cost Index Sept 2024: Positive Trend 10-31-24).
Even if we add back some very reasonable strike numbers and lowball the weather effects, we get back to a low payroll number north of 100K that does not step on the FOMC game plan of easing. The debate on FOMC easing this coming week (-25 or -50 bps) got airtime in the face of 12K in adds. Another -50 bps this week would be a shocker to us.
With respect to the storm distortions, below we cut and paste the BLS commentary on how it treats such events:
From the establishment survey:
In the establishment survey, the reference period is the pay period that includes the 12th of the month. Unusually severe weather is more likely to have an impact on average weekly hours than on employment. Average weekly hours are estimated for paid time during the pay period, including pay for holidays, sick leave, or other time off. The impact of severe weather on hours estimates typically, but not always, results in a reduction in average weekly hours. For example, some employees may be off work for part of the pay period and not receive pay for the time missed, while some workers, such as those dealing with cleanup or repair, may work extra hours.
It is not possible to precisely quantify the effect of extreme weather on payroll employment estimates. In order for severe weather conditions to reduce employment estimates, employees have to be off work without pay for the entire pay period. Employees who receive pay for any part of the pay period, even 1 hour, are counted in the payroll employment figures.
From the Household Survey:
In the household survey, the reference period is generally the calendar week that includes the 12th of the month. People who miss the entire week's work for weather-related events are counted as employed whether or not they are paid for the time off. The household survey collects data on the number of people who had a job but were not at work due to bad weather. It also provides a measure of the number of people who usually work full time but had reduced hours due to bad weather.
The above is worth being aware of even if a few days from now the Oct payroll stats will be heading to the “mental delete file,” and the forward-looking range of outcomes for post-election policy will dominate all discussions on where payroll trends, pricing (and tariffs) will play out, and what it all means for late year capital budgeting decisions and working capital management planning (i.e. inventory and supplier orders) based on forward sales expectations and how to “time tariffs” if Trump gets the brass ring.
Jobs and the UST curve and the Fed…
The UST inversion anomaly did not get much discussion as a factor in the decision handicapping we heard. We reiterate that the extraordinary nature of the front-end inversion from 3M UST to 5Y/10Y give the Fed room to maneuver as 25 bps would keep the fed funds minus PCE above the long-term median.
That type of UST curve disconnect does not have a precedent in a steady expansion. As someone who had a 23% prime plus loan in the early 1980s, the bout of record steepness to record inversions was a whiplash moment under Volcker, but that was in a market where the misery index had reached painful levels at the time even after peaking in June 1980 at 22%.
We have seen major inversions from fed funds and 3M UST before, but with a run rate for 3Q24 showing a headline PCE of 1.5% framed in the GDP release and the 2.1% in the Sept PCE numbers, that relationship from 3M UST is very much an aberration relative to the bad old days of 1980-1982 (see 3Q24 GDP Update: Bell Lap Is Here 10-30-24, PCE Inflation Sept 2024: Personal Income and Outlays 10-31-24).
We will be updating the yield story line in our weekly Footnotes publication.
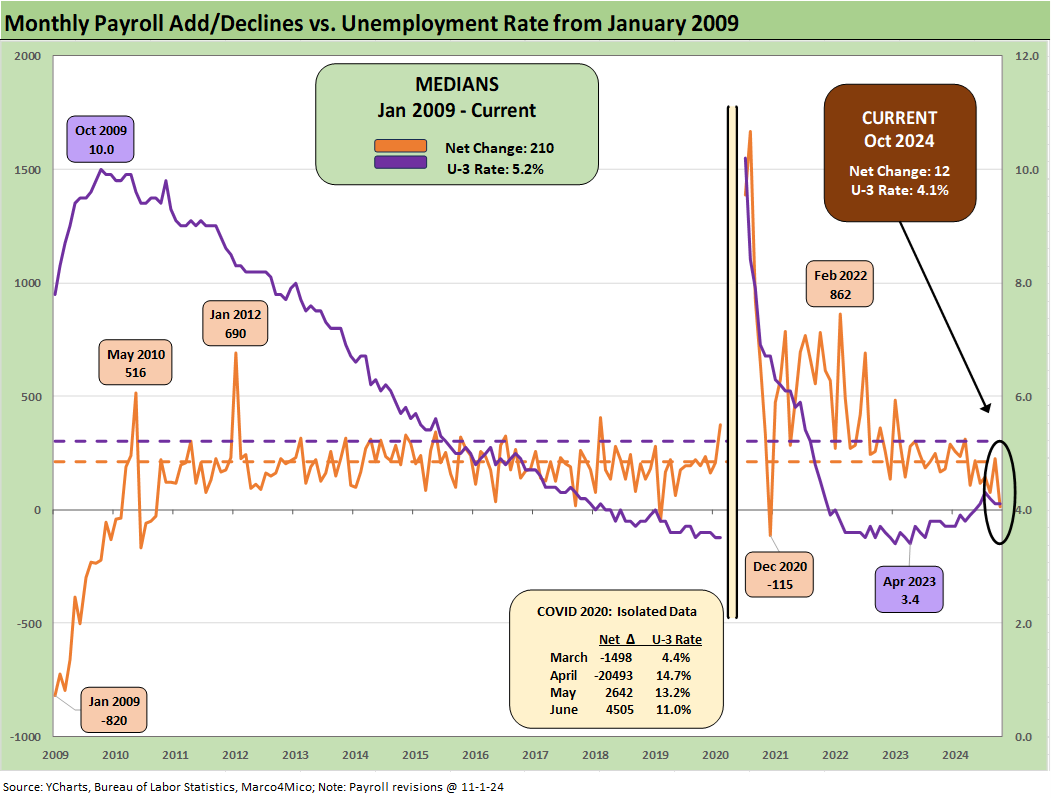
The above chart plots monthly payroll adds vs. the U-3 unemployment rate since the peak of the credit crisis. The U-3 was flat at +4.1% despite the moving parts as described in the bullets above. The 4.1% unemployment rate is important, but the main issue to us is the number of bodies getting paychecks and the quality of the occupation lines detailed further below. If these show relative stability the 12K will be old news by Monday.
One of the big problems in the jobs boom cycle was labor shortages that fed inflation, and those trends are easing. That is, until millions of employed bodies get on the Stephen Miller Express in a mass deportation program. The Oct number for average hourly earnings weighed in at +4.0% and is running ahead of inflation.
The direction of jobs and earnings are up for some structural challenges ahead, and it is hard to find many to frame up what mass deportation means outside the think tanks and the politically axed. Having spent a good number of years on the sell side, I can only imagine the pressure the research teams and economists are facing not to color too far outside the lines on scenario analysis that leans too heavily in the direction of what could be seen as partisan views. Of course, the street is inclined to lean on the defensive side.
Those with a heavy stake in wealth management and touchy clients have some unstated (or only stated by the water fountain) guidelines on where to send signals rather than yell out loud (think third base coach communicating a steal sign to a runner). Some topics are to be avoided or delivered as cloudy risk variables.
These tariffs and deportation programs will be massively damaging economically and financially at the household level even if some will feel some visceral satisfaction (for whatever reason). Toss in some ACA fears to consider in household budgets or concerns around employment (e.g. promises of mass terminations in the Federal workforce), and the propensity to consume will not be unaffected.
Where the Day 1 promises might tie into the payroll statistics is more than a little inexact. The mass deportation scenarios could prove very shocking in terms of the impact on a few key lines: civilian labor force (168.5 million), total employed (161.5 million), and total unemployed (6.98 million).
When you start looking at these numbers in the context of even just a few million employed getting “Millered” and start considering the higher end estimates of 15 million or higher (we heard 21 million from Trump in one speech) and then consider the economic fallout, you can start coming up with some very scary payroll setbacks. It is like a pandemic type of count - only self-inflicted. That in turn can flow directly into supplier chains and expense and revenue lines. The term “multiplier effects” cuts both ways.

The above chart updates the U-3 unemployment rate vs. U-6 structural unemployment rate. We see the U-3 flat on the month at 4.1% and the U-6 stayed flat sequentially as well at 7.7%. The U-6 is above the 7.2% of Oct 2023, so that is still an unfavorable trend.
As a reminder, the U-6 metric is defined with the numerator as “total unemployed + persons marginally attached to the labor force + total employed part time for economic reasons.” The denominator is “civilian labor force + workers marginally attached to the labor force.” The U-6 went sideways at 7.7%, but that is above the 6% handles seen in spring of 2023.
The Household Data tables are always jammed full of color underscoring that this record job market is anything but nirvana. For those of us who grew up in fading industrial towns, we remember the brutal realities of 1974-1975 when being fortunate enough to have a job (or two) and a paycheck beat the alternative. Sadly, in today’s world, having multiple jobs at a national minimum wage only gets you just over $15K pre-tax for 40 hours a week and 52 weeks of work. That is not livable.
For some of the lines in the Household data, we see “Part time for economic reasons” at 4.55 million and down by -67K sequentially. “Part time for noneconomic reasons” at 22.35 million was down -214K sequentially. Those “marginally attached” to the labor force was down by -66K and to 379K.

The above chart plots the differential of the U-6 vs. U-3 and we see a 3.6% differential, which is below the median from 1994. The peak 8.2% during COVID comes with an asterisk, but the 7.4% in the sovereign and systemic mini-panic in the fall of 2011 and the 7.2% around the recession trough in 2009 show what constitutes a very ugly number.
The more logical outcome is that both the U-3 and U-6 go wider from here in the same macro context, but the mass deportation factor says all bets are off. The closest thing to the numbers that Trump and his crew (Stephen Miller as head of body counting) toss around is on the scale of the WWII mobilization, and that is using the midrange of the estimated deportation numbers they cite. The logistics of moving people from home to “camp” to “out of the country” is not set yet. The preparation here is about as well managed as the COVID response. Things will go wrong.

The above chart updates the total payroll of 159 million (SAAR, 160 million Non-SAAR) from the Establishment Survey and plots that against the unemployment rate. The current 4.1% is well below the median of 5.8% since 1972 and below the 5.2% median since Jan 2009.
We have plotted some state-by-state data in recent commentaries that challenge the bearish, politically driven economic themes when so many red states are doing so well in employment, income, and GDP (see State Unemployment Rates: Reality Update 10-22-24, State Level Economic Reality Check: Employment, GDP, Personal Income 9-28-24, Employment: Real Numbers vs. Fictitious Dystopian Hellscapes 3-9-24). The economy has been doing quite well, but the gloom-and-doom talking points (like election fraud) are “required by the tribe.” Political futures (power and money) depend on it.
The states are doing well, and it also shows up in their hiring practices as well as their employment and income numbers. They just plead poverty for the national audience while bragging locally about their strong local economies. So much for sum-of-the-parts theory. Such dishonesty in the interest of power accumulation is standard behavior these days and especially with the pseudo pious, self-righteous “end justifies the means” crowd.

The above chart updates payroll vs. job openings as more people are paying attention to JOLTS again (see JOLTS Sept 2024: Solid but Lower, Signals for Payroll Day? 10-29-24, JOLTS Aug 2024: Openings Up, Hires Down, Layoffs Down, Quits Rate Down 10-1-24). The recent JOLTS numbers saw job openings finally drop below the Trump peak number of 7.5 million during Nov 2018.
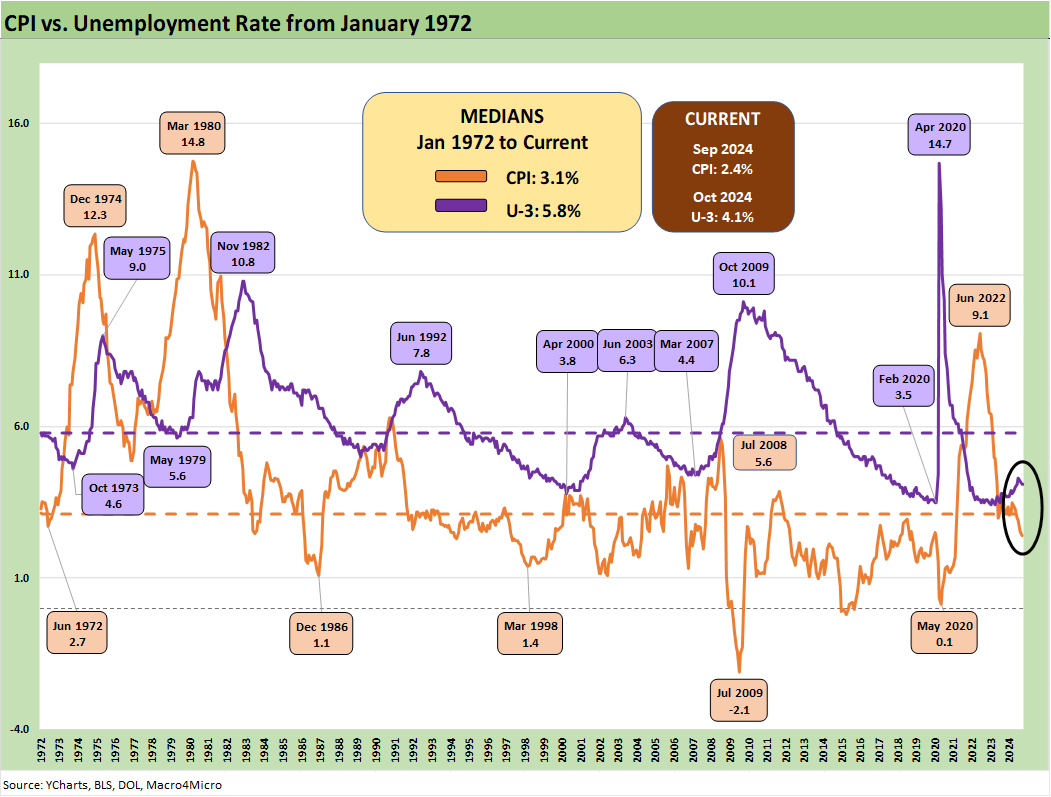
The above chart updates the U-3 Unemployment Rate vs. the CPI. CPI is well below median and so is U-3. In the “old days,” the total of CPI + Unemployment rate was called the Misery Index. I got off the train in NYC for my job in June 1980 with a 22.0% Misery Index which was an all-time high (see Misery Index: The Tracks of My Fears 10-6-22). The current Misery Index is 6.5%. The CPI and U-3 medians add to 8.9%. The current 6.5% is thus very solid across the cycles.
Into the occupation payroll weeds…
In the next round of charts, we look across the occupational payroll deltas and try to find major distortions. The main takeaway is that the occupational/industry line items are overwhelmingly positive. If the US starts deporting millions, it is not a challenge to think through the direction of the rolling multiplier effects on everything from PCE to labor costs. Quantifying it is another story.
The cable talking heads were kicking around storm employment disruption estimates plus strike numbers in the area of 100K. Adjusted for the guesswork of estimating the distortion, it is easy enough to get north of 100K adds. The rolling prior 3 months (July to Sept) was 148K adds and the rolling 6 months was also 148K.

The above chart illustrates the month-to-month, industry-level changes in October. We easily see the impact of the Boeing strikes in durables. The weather connection is more guesswork than not, but the myriad collection of occupations in Administrative and Waste makes sense with Temp Services at -48K.
The right side of the chart highlights continued healthcare growth driven by demographic demand. We continue to see growth in Construction payrolls, which is a positive sign underlying the strong but moderate growth for the overall economy. A side effect of the storms is construction would be more likely to increase looking ahead. As financing conditions ease, construction is a key industry to watch for future payroll increases. Construction has multiplier effects across equipment, materials and related services (Waste Management) which could also see more hiring even if temporary.
Despite this month’s disruptions, those less impacted industries saw comparable results to previous months and help to diminish some of the shock factor of the 12K headline in the BLS report. For such a bad headline number, the market has seemed to give it a pass but needs fresh data before more cyclical anxiety takes hold.

The chart above shows the changes by industry since Jan 2020, or right before the COVID crisis and the shifts in industry trends. The momentum within the healthcare industry is not likely to slow down and offers a haven to counter more cyclical industries that see slowing or lagging demand.
We see Transportation and Warehousing in a secular expansion mode for a range of reasons including the notable shortfalls in freight and logistics capabilities exposed during COVID and the recovery period. Amazon as the latest transport king is part of that trend.
With the most recent print, we see the continued decline within temporary help to the tune of -48.5K this month and -577K since peaking in March 2022. That in turn drives the larger Administrative and Waste Services numbers into negative territory.
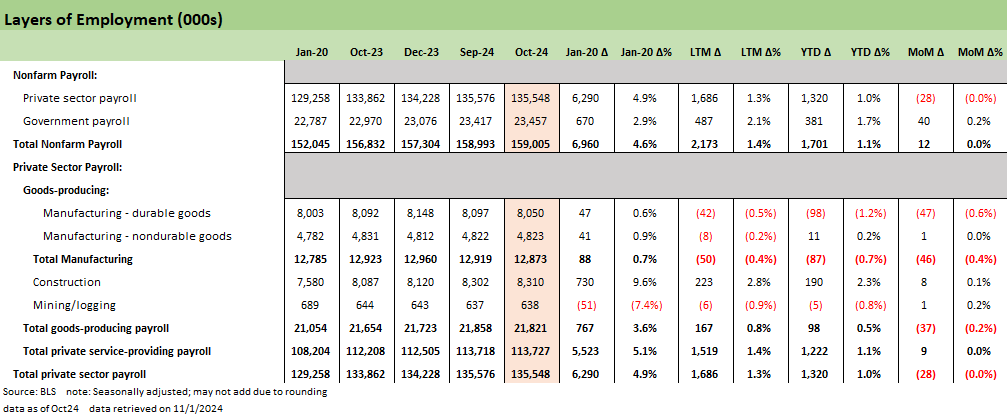
This chart gets into the deltas across some of the key headline numbers and gives a bird’s eye view of the private sector payroll. We see -28K MoM for the private sector with -37K of that in the total Goods line with the Services total in positive range. We delineate the Goods total and Services totals before we drill into the subsectors in slides that follow.
We break out the Goods-producing lines that include Manufacturing, Construction, and Mining/Logging (where the E&P sector and related jobs are housed). The -46K in Manufacturing was the main event. We look at Manufacturing lines in the next chart. The expectation is most of the manufacturing losses will add back over time as the economy keeps growing and the strikes end with maybe a detour to some other strikes such as Stellantis or others.
In looking back across time to other periods marked by severe weather and hurricanes (Katrina, Sandy, Harvey, Irma, etc.), we see a similar pattern with payroll adds declining below trend temporarily before recovering in the subsequent months.
This is one of those times to take a step back and remind ourselves of the larger trend on the year which has been positive. YTD payroll adds of 1.32 million is quite strong with another +381K of Government jobs leading to a 1.7 million total. The sustained job growth that we have seen this year despite contending with the rate environment was why the FOMC had to move slowly but also helps explain the sustained and healthy PCE numbers we saw again this past week in 3Q24 and in the Personal Income & Outlays release.
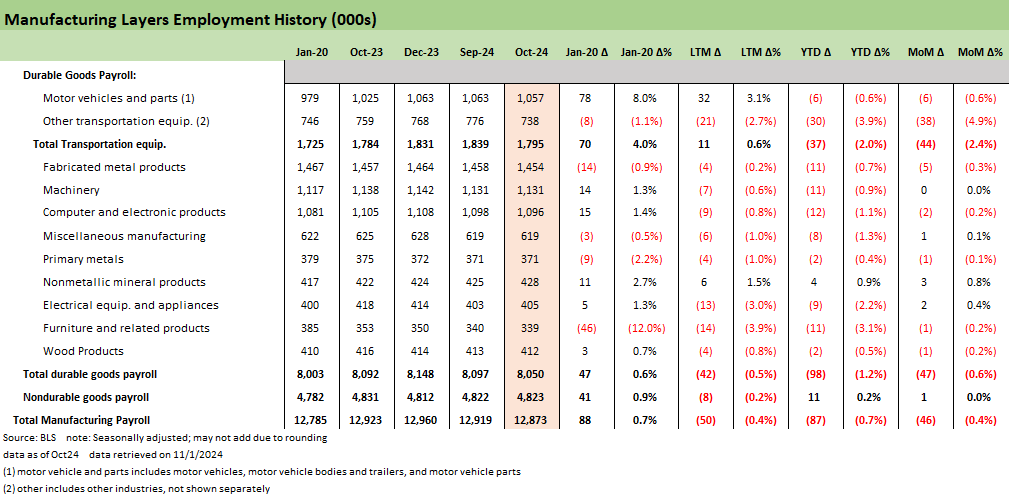
The above chart lays out the manufacturing data with the Durable Goods line broken out (Nondurables in the next chart). We see the major movement due to the Boeing strike since mid-September. As we have covered in past publications, the manufacturing sector was already underwater this year amid myriad struggles to reignite a manufacturing comeback.
It does not take the BLS to point out that the bulk of the strike effect can be seen in the -44K under Total Transportation Equipment. The Boeing strike itself is around -33K but the ripple effects across supply chains add to the total.
Going down the list of non-Transport related lines, we see 3 positive, 5 negative, and one flat on the month. That trend is slightly worse in the longer comparison periods as both the YTD and LTM periods show only Nonmetallic mineral products with minor growth and the rest in various states of decline.

We update the details of the nondurable manufacturing industries above. The lines include industries swept up in secular decline stories and outsourcing themes such as textiles and apparel. The only bright spots here are Food Manufacturing and Chemicals which have driven the minimal positive growth since Jan 2020.

The above chart updates the Services lines that are typically the bulk of the monthly payroll adds and reflect the US as a growing services-driven economy. The standout negative on the month is the Temporary Help Services line under Administrative and Waste Services that drove almost the entirety of the decline.
October’s employment report reflects a brief pause in Services sector growth, which has otherwise shown strong momentum, particularly in healthcare. When two hurricanes and a massive strike at Boeing is only enough to bring Services growth to flat, it is a testament to the demand for Services workers and how it has added 1.2 million jobs YTD. Services will be the most effected by the mass deportation game plan given the nature of the activities and relative pay scales for some of the larger industry groups.

The chart above covers the Construction side of the picture where the degree of impact that the hurricane has on the numbers above is up for debate across given disruptions and delays. However, the industry has already experienced another good growth year with two months to go as it added 190K YTD, 223K LTM, and 730K since Jan 2020. The need to rebuild and restart projects will be part of the rebound in coming months.

The last chart in the group covers the Government lines that show another month of strong employment gains. The +40K number this month is consistent with the past LTM period that shows +487K total Government adds across Federal, State, and Local levels. These are many of the same state and local “pols” who have been pleading poverty as they add to payrolls and see their states doing quite well across a range of objective economic metrics.
Summary…
The election will be over this week and then the litigation and protests can start (I mean continue). At some point soon there will be some job losses in the “Misinformation Specialist and Lowlife” payroll count. The BLS has fallen down on the job by not assigning a job count to that group making money in the new age of “no facts, no reality.” That might move the jobs needle.
Contributors:
Glenn Reynolds, CFA glenn@macro4micro.com
Kevin Chun, CFA kevin@macro4micro.com
See also:
PCE Inflation Sept 2024: Personal Income and Outlays 10-31-24
Employment Cost Index Sept 2024: Positive Trend 10-31-24
3Q24 GDP Update: Bell Lap Is Here 10-30-24
The Politics of Objective GDP Numbers: “Flex Facts” on Growth 10-30-24
Tariffs: The EU Meets the New World…Again…Maybe 10-29-24
JOLTS Sept 2024: Solid but Lower, Signals for Payroll Day? 10-29-24
Footnotes & Flashbacks: Credit Markets 10-28-24
Footnotes & Flashbacks: State of Yields 10-27-24
Footnotes & Flashbacks: Asset Returns 10-27-24
Mini Market Lookback: Burners on Full 10-27-24
Trump, Trade, and Tariffs: Northern Exposure, Canada Risk 10-25-24
Durable Goods Sept 2024: Taking a Breather 10-25-24
New Home Sales: All About the Rates 10-25-24
PulteGroup 3Q24: Pushing through Rate Challenges 10-23-24
Existing Home Sales Sept 2024: Weakening Volumes, Rate Trends Worse 10-23-24
State Unemployment Rates: Reality Update 10-22-24
Housing Starts Sept 2024: Long Game Meets Long Rates 10-18-24
Trump at Economic Club of Chicago: Thoughts on Autos 10-17-24
Retail Sales Sep 2024: Taking the Helm on PCE? 10-17-24
Industrial Production: Capacity Utilization Soft, Comparability Impaired 10-17-24
CPI Sept 2024: Warm Blooded, Not Hot 10-10-24
HY OAS Lows Memory Lane: 2024, 2007, and 1997 10-8-24
Payroll Sept 2024: Rushing the Gate 10-4-24