
Footnotes & Flashbacks: State of Yields 11-11-24
The UST curve steepened on election night but quickly retreated on the long end as the market readies for CPI/PPI this week.


Put it on 20% tariffs for the EU, 25% on Mexico, 60% on China. Let it ride.
The yield curve debates will loom large into 2025 with record deficits and UST supply and Trump ambitions to keep taxes low (and lower) while enacting unprecedented levels of tariffs and potentially throwing the labor markets into disarray on mass deportation.
There are some voting gamesmanship tactics to play out that may include using tariffs as offsets under “reconciliation rules” in Congress to allow for budget numbers that clear the way for “majority votes” and “filibuster avoidance” in the Senate on various tax legislation ambitions. In other words, the budget and tariff dramas are only just beginning in the snake pit known as Washington.
The FOMC’s first -25 bps was easily absorbed given the fed funds vs. PCE differential, and the same will be the case for the next -25 bps expected in Dec 2024.
The stakes go up on tariffs one way or the other after inauguration as D-Day approaches on policy decisions that do not explicitly require Congressional approval. Trump can use existing legislation on the books as he did in “Trump 1.0” (see PCE Inflation Sept 2024: Personal Income and Outlays 10-31-24), but the next leg of the journey and legislative ambitions get more complicated. That is a topic for another day.
E&P presents some wildcards in the inflation picture beyond tariffs and wage distortions from deportation since the “drill, drill, drill” game plan could have major effects on headline CPI and PCE as upstream oil price pain could once again become consumer and corporate cost gain.
How bond investors will stir all these ingredients into a projected UST level and slope will keep the market occupied for a while on speculation as to how soon tariffs and the Stephen Miller Express will escalate.
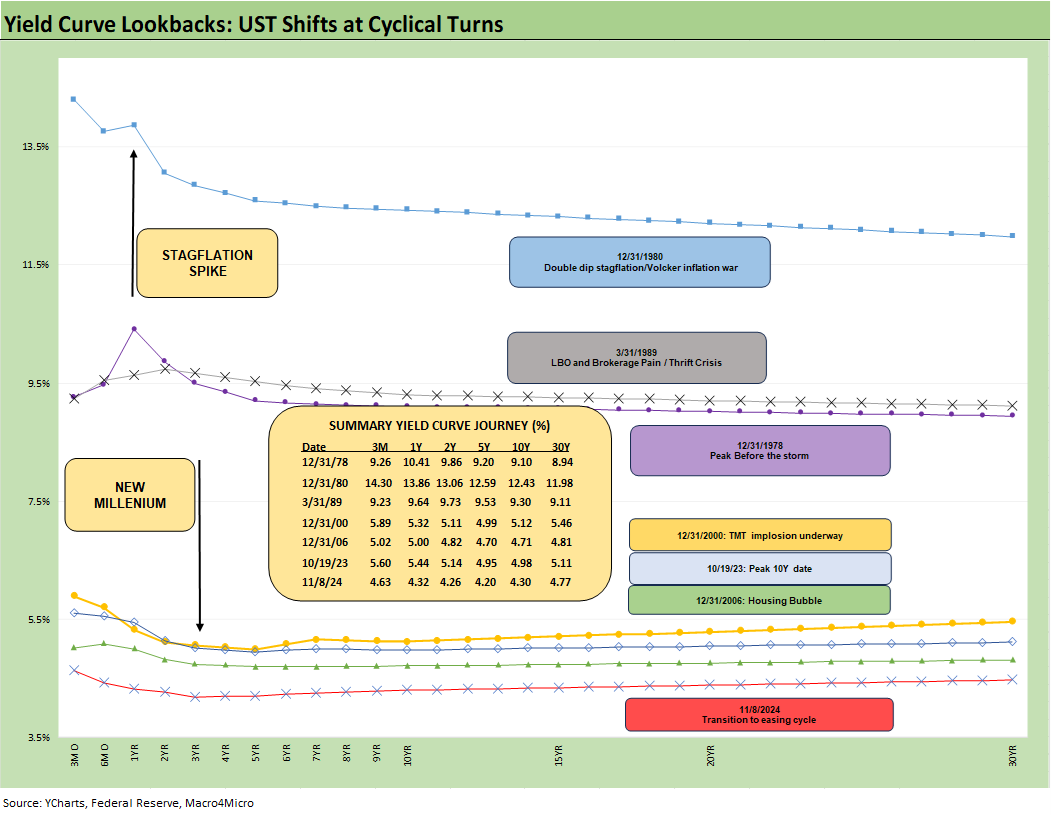
In a replay chart we use each week, the above chart updates the UST curves across the pre-crisis cycles. In the post-ZIRP age, we plot the 10-19-23 UST curve as the peak date for the 10Y UST. Last, we plot the Friday UST curve for the current state of yields. We leave out the post-crisis-to-COVID period as relevant frames of reference given the artificial distortion of Fed policy including ZIRP, QE and brief normalization periods.
With an inflation and tightening cycle essentially behind us, and the FOMC now in easing mode, the pre-crisis UST curves are more relevant as comparisons. The conclusion is easy enough to reach that the current UST curve is extraordinarily low across the decades. The idea that growth in the face of sharply rising deficits and record US supply and record UST interest rate expenses will allow for meaningfully lower rates without a recession is highly optimistic to the point of unprecedented.
Lowering the front end and reducing the inversion is one goal but pushing the 10Y UST closer to 3.0% while driving a growth economy and reducing taxes and the deficits (i.e. the campaign pitch) requires the revenue and expense line and global UST demand to cooperate. The promises are out of alignment with the “cash in, cash out” realities.
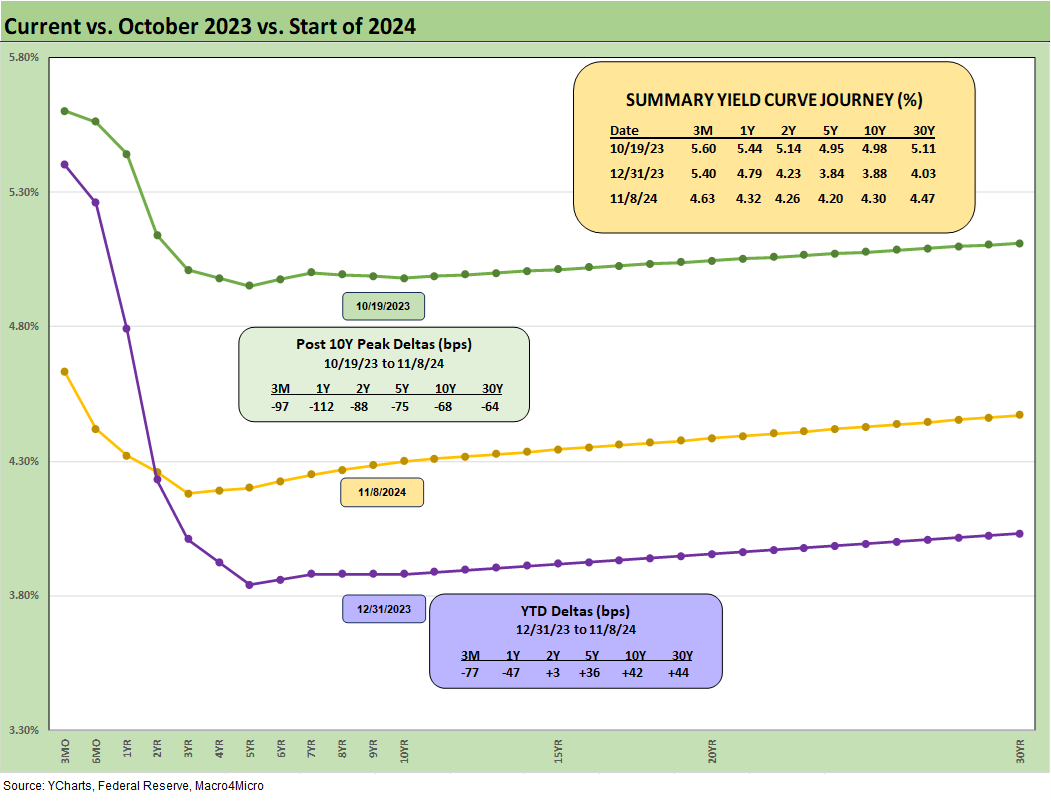
The above chart updates the running YTD deltas along the UST curve and the deltas from the peak 10Y date of 10-19-23. We include the yield details in the box. The sharply lower UST yields from 10-19-23 are broken out in the UST delta boxes. The YTD delta shows the upward move and steepening pattern from the 2Y to 30Y since 12-31-23.
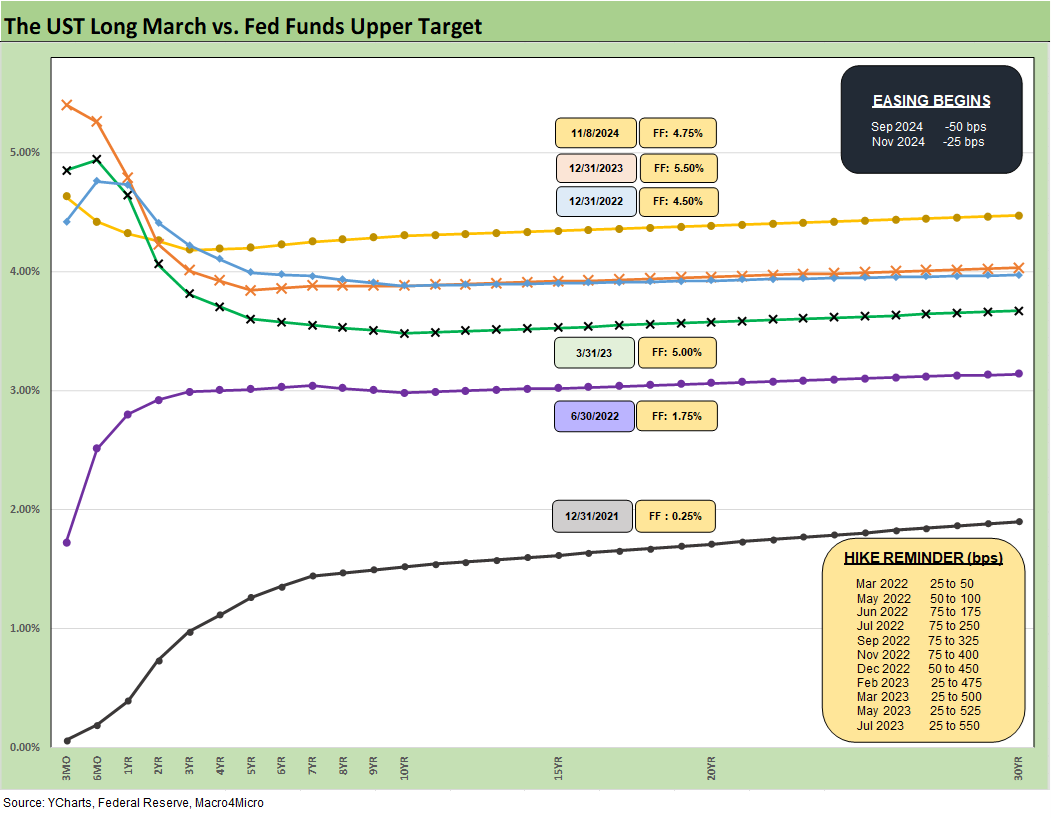
The above chart updates some useful frames of reference in the tightening cycle and now in the early stages of easing. We see the 11-8-24 curve on top slowly moving towards flatter on the FOMC cuts and upward shift on the longer end YTD 2024. More inversion correction is set to be worked out with the next cut as the Fed potentially eases again in December.
Even with the cut, the inversion on the front end is still nothing short of extraordinary in a market with 2% handle headline inflation levels, steady growth, and low absolute rates across the history of monetary cycles before the crisis years of ZIRP. The question will remain how that type of economic backdrop can push the long end lower. It is like an economic logic clash with a collage of political promises that are hard to reconcile.
The differential of 100 bps in fed funds between the 12-31-22 and 12-31-23 UST curves still saw the 10Y UST area of those two yield curves converge. That offers an empirical data point that the 10Y does not have to move in lockstep (or at all) with lower fed fund rates over the near term. The CPI news this week could be a key sentiment shaper as the market braces for inflation impacts flowing from tariffs and deportation. Every month brings new data points on CPI and PCE and payrolls. The JOLTS and Payroll releases are set for some volatility once the deportation process kicks into high gear.
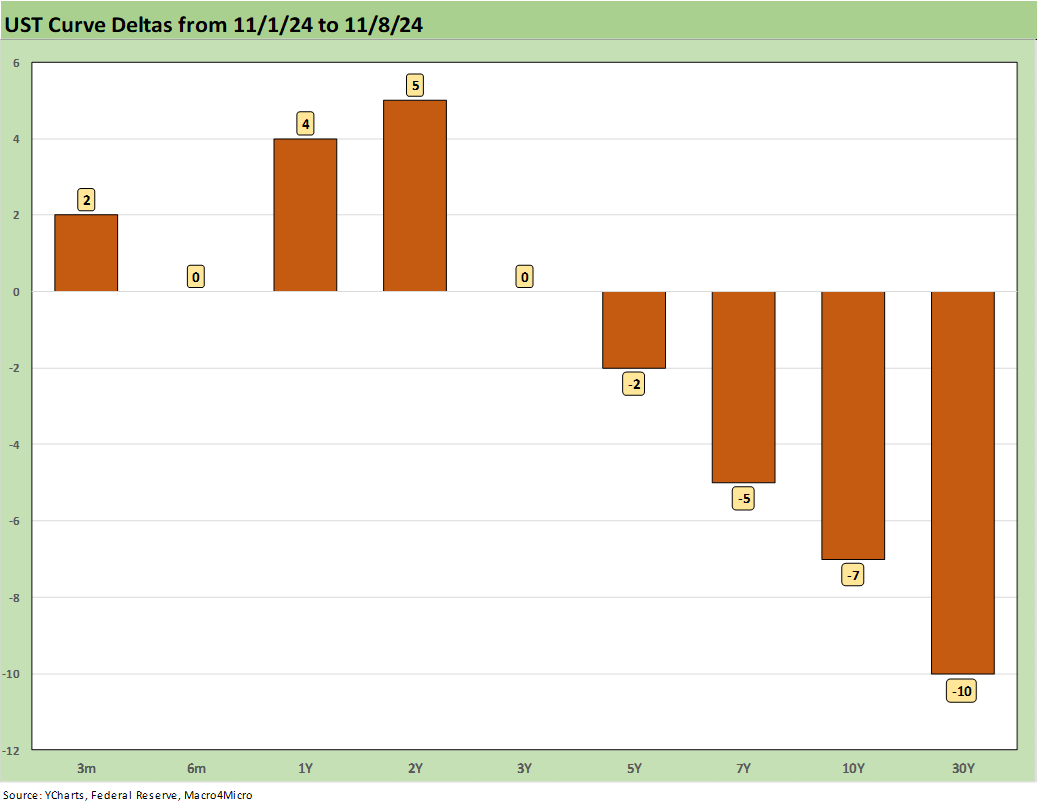
The above chart updates the 1-week UST deltas. The lower rates on the long end offered some support to long duration bond ETFs this week (see Footnotes & Flashbacks: Asset Returns 11-10-24), but overall the UST curve was not the main discussion point in recent days with the election lighting up the headlines and equities soaring.
There is an element of “calm before the storm” that more partisan spectators will see as the “eye of the political hurricane” once we get past Inauguration Day.
With the current popular vote tally holding a 50% handle (50.4% as of this morning), the words “sweeping mandate” will of course challenge the definition as tectonic policy changes roll out. For a check on what huge mandates really look like, see Mini Market Lookback: Extrapolation Time? 11-9-24. A 3 million handle plurality is more like Bush in 2004 and less like the 9 million handle victory of Obama in 2008. Presidents get two years to deliver typically with control of the House and Senate. For those keeping score at home, 2006 did not go well for Bush and 2010 was a midterm disaster for Obama. The bigger the promises, the greater the expectations.
The real tests for the UST curves await the usual inflation gut checks along the way from real data and to what extent the market starts discounting where those numbers will head in pro-growth markets with very low UST rates. That will especially be the case when Trump loads up on tariffs and turns Stephen Miller loose. Right now, the stock market (which was already running to routine records) likes the certainty of tax cuts and less regulation. The uncharted waters come later with tariffs and ICE crackdowns and potential deployment of the military.
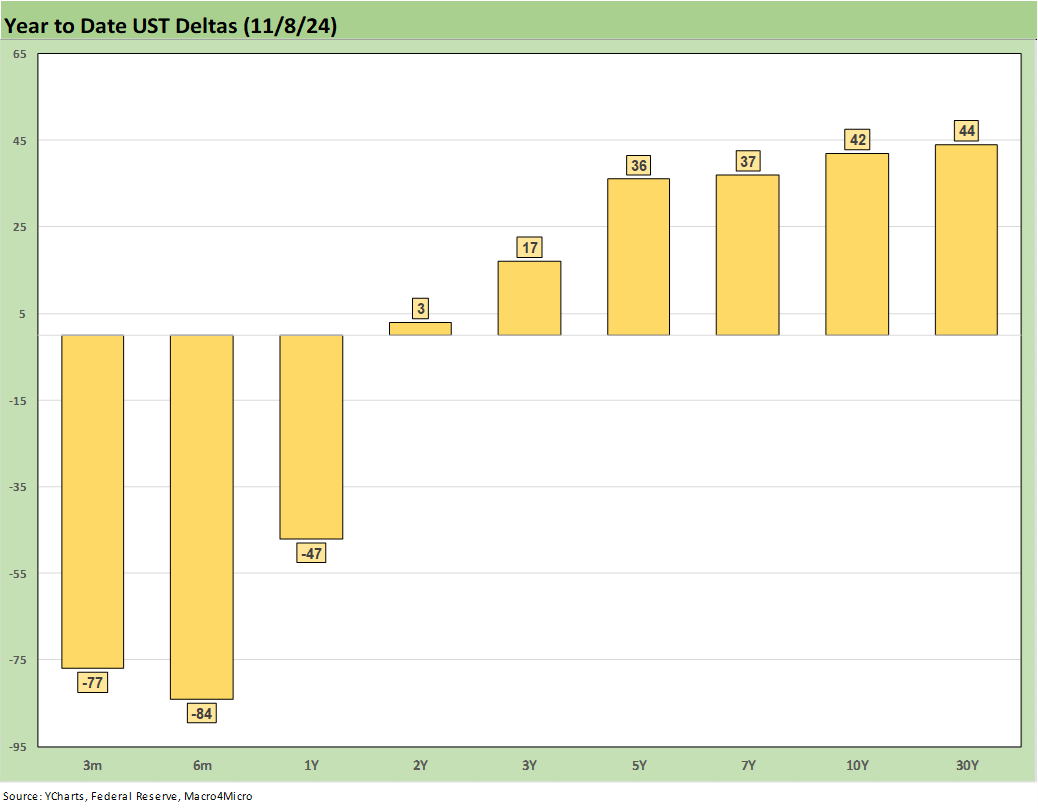
The above chart offers another visual angle on the YTD UST deltas with the lower rates on the short end and higher long rates. The bear steepening out past 2 years to 10Y and 30Y was not the original expectation to kick off the year for many duration bulls.
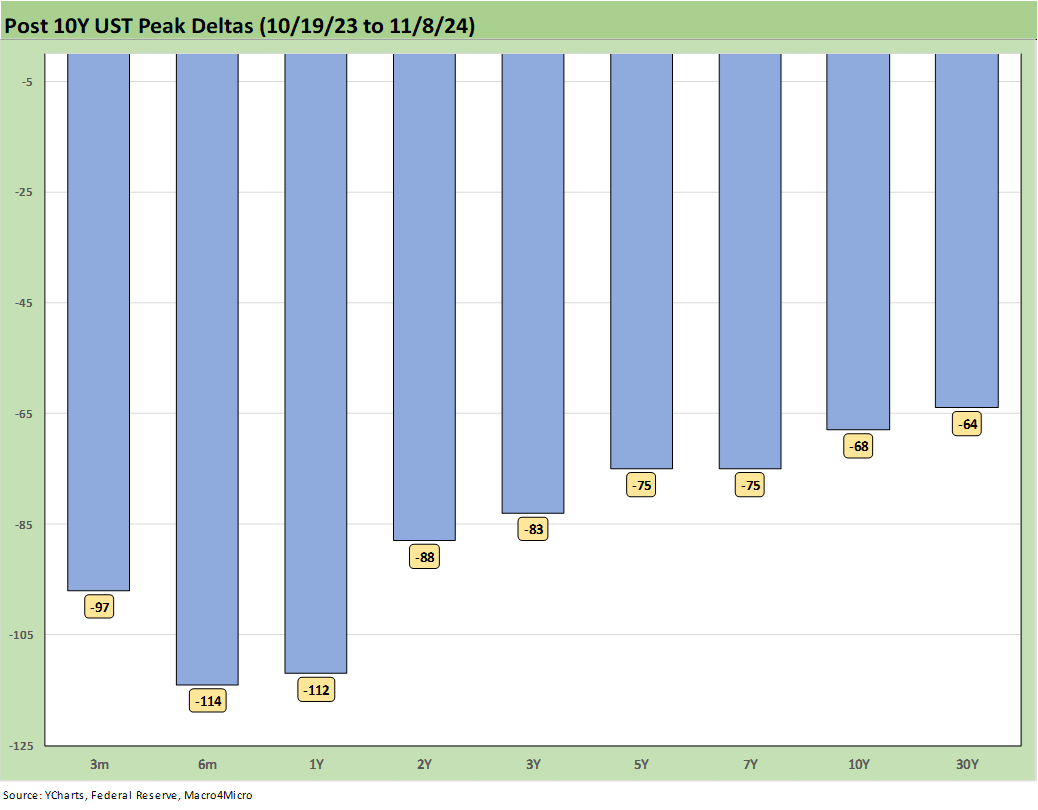
The above chart updates the bull UST move since the Oct 2023 peak in rates. That has been an especially good run for duration since fall 2023. The biggest slice of the rally was in the Nov-Dec 2023 UST move, and 2024 left bond bulls waiting for the next round that did not come until later in the year before then backtracking.
As we cover in our separate Footnotes publication on asset returns, the only line item in the red zone YTD in our list of 32 benchmarks and ETFs was long duration UST ETF (TLT) at -3.3%. TLT was +16.6% in total return from 10-19-23. That risk and duration rally to wind down 2023 was a banner stretch before life got bumpy in bonds during 2024.
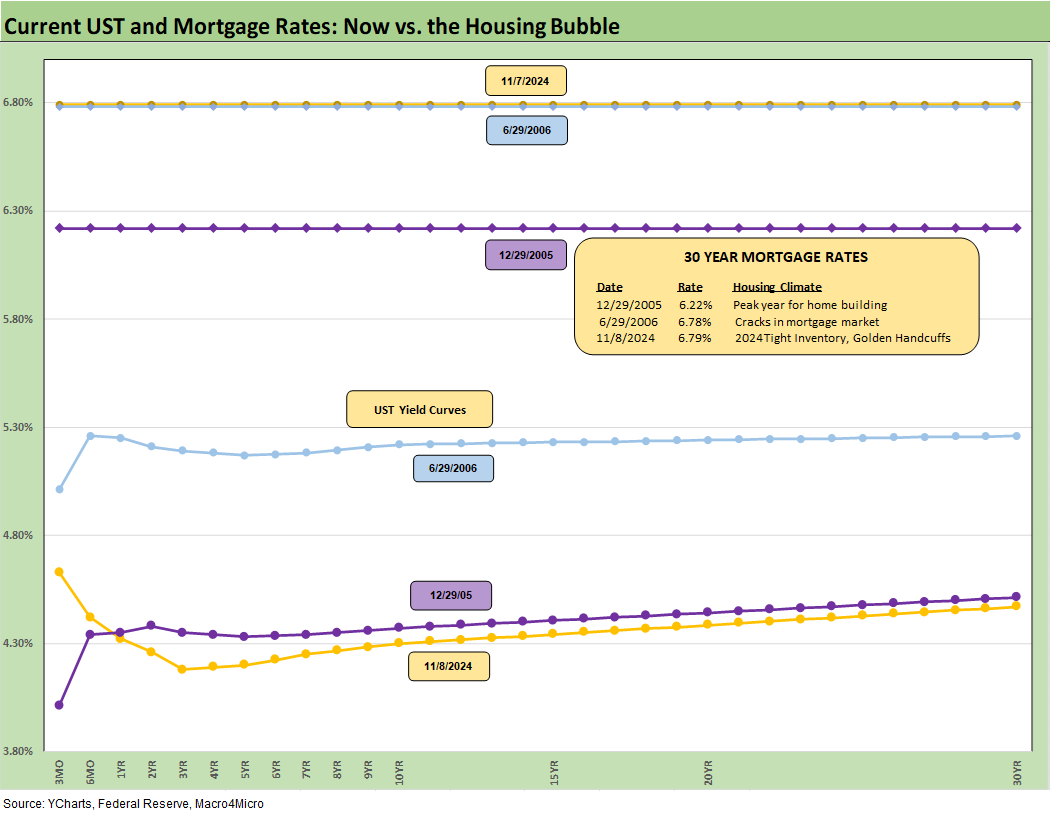
The above chart updates the Freddie Mac 30Y mortgages on the horizontal lines. We frame the weekly Freddie 30Y benchmark for this past week and two others during two key periods back during the housing bubble of 2005-2006. The year 2005 was the peak homebuilding year and mid-2006 was when the RMBS market was starting to show anxiety over RMBS quality. We also include UST curves for each date.
The level of the UST as of Friday close was still below the end of 2005 and well inside the mid-2006 levels. That translated into Freddie 30Y of 6.79% or almost on top of the 6.78% of mid-2006 and a bit more above 2005. The 2005 level as plotted showed 6.22% for the 30Y Freddie Mac level. If we look past the Freddie benchmarks, there are plenty of 30Y mortgage rates in the current market closer to 7% to end the week.
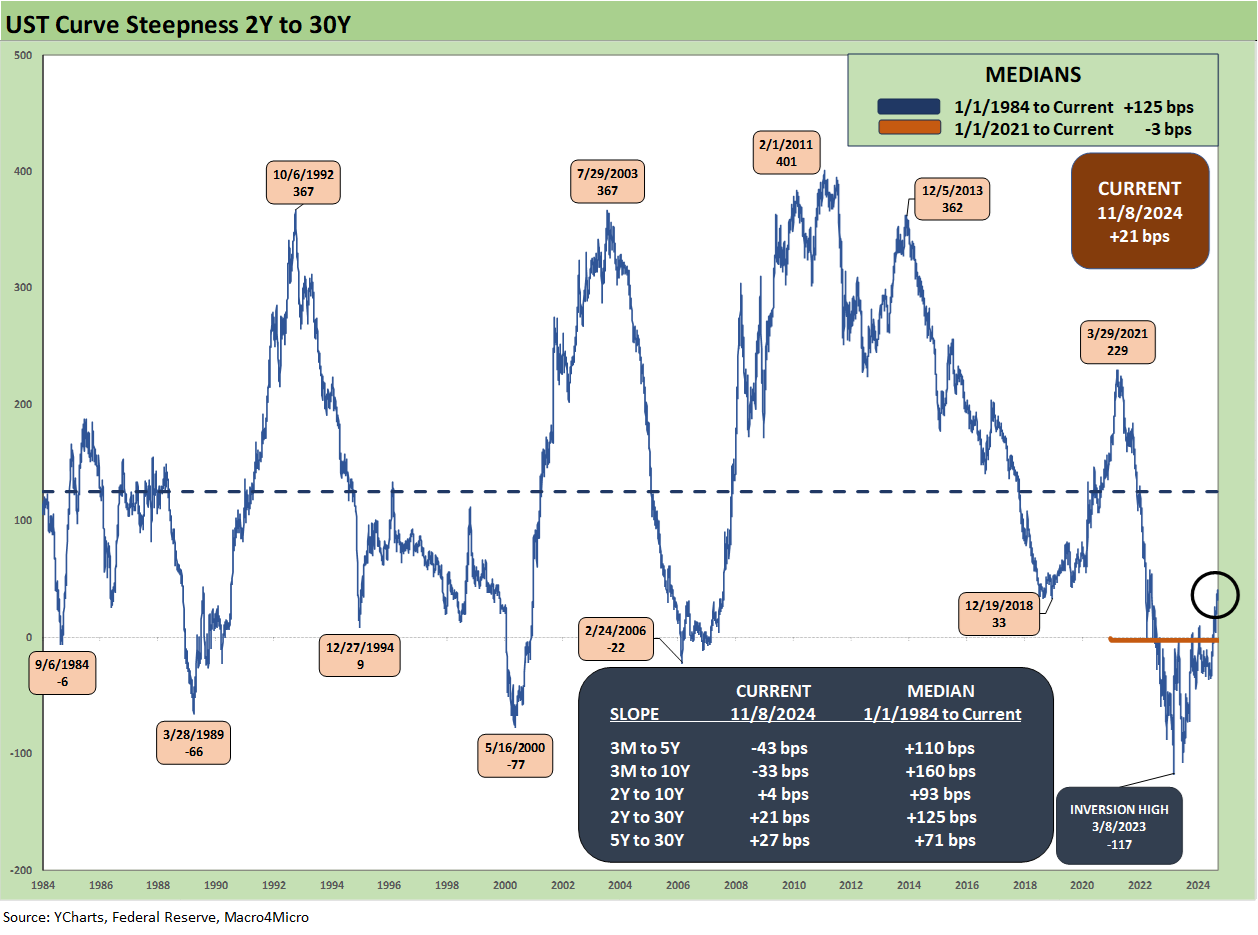
The above chart updates the 2Y to 30Y slope since 1984, and the current +21 bps is well inside the +125 bps long term median. The box in the chart updates the other UST slopes we like to monitor and the current slopes vs. long term medians.
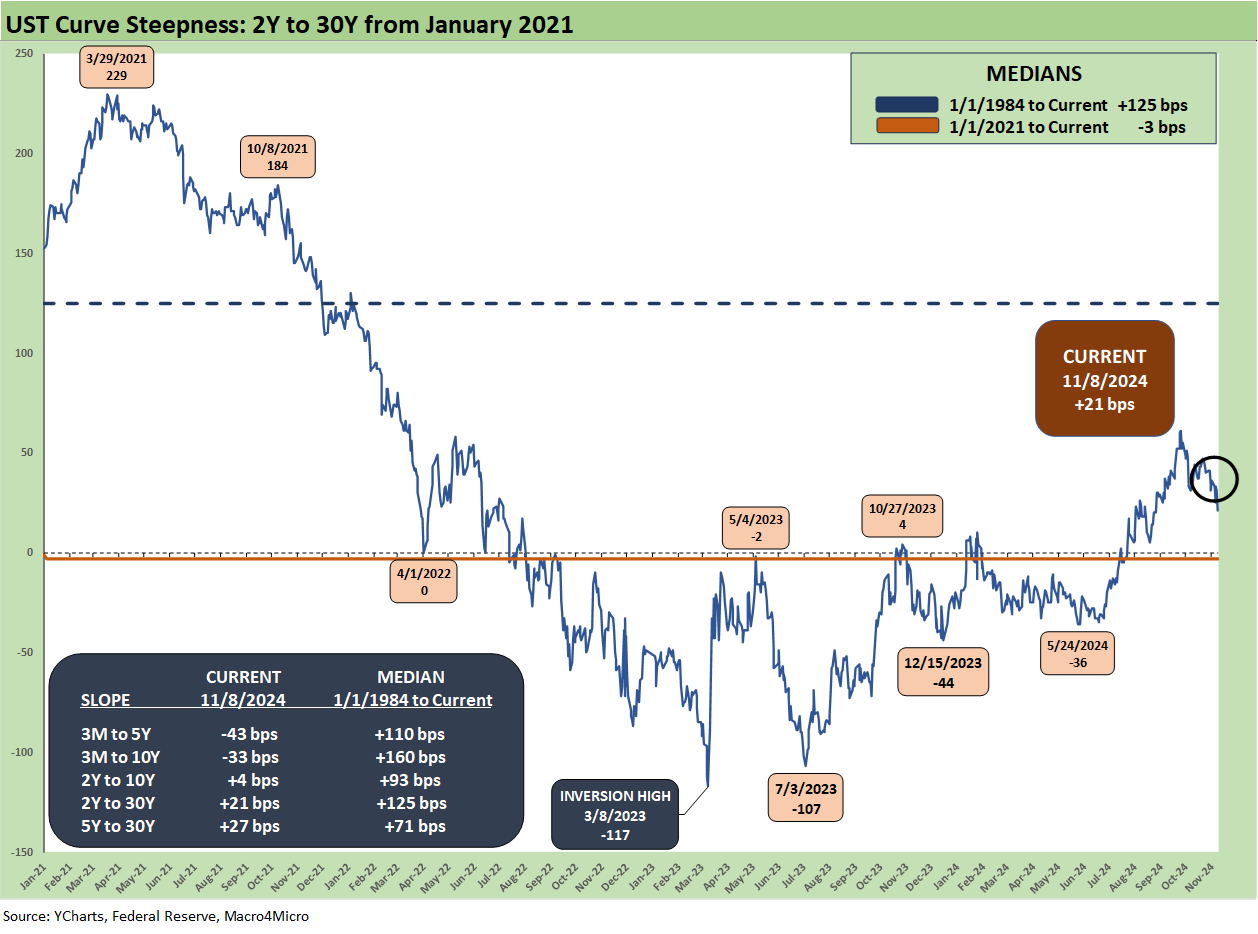
The above chart does the same 2Y to 30Y exercise but shortens up the timeline to a start date of Jan 2021 when ZIRP was still in place and the COVID vaccine was slowly rolling into the markets. The chart shows a peak 2Y to 30Y slope of +229 bps in March 2021 take a dive to the peak inversion of -117 bps in March 2023 before it whipsawed with the FOMC and then dipped back down to -107 bps in July 2023.
As we see in 2024, the 2Y UST is one of those market benchmarks and trading vehicles that can whip around during periods of monetary transition. The higher rates in the 10Y and 30Y during 2024 YTD have been part of the slow “steepening towards flat” pattern earlier in the year and now the FOMC is playing catchup on the front end pulling rates lower.
The big decline in 3M to 1 Y captured in the earlier charts and minimal net move in 2Y dovetailed with the higher 30Y YTD to get the market back to upward sloping. Whatever noise is made by whoever is in the White House before or later, the market decides on the long end and the FOMC sets the short end. Anyone promising lower long rates needs permission from the market.
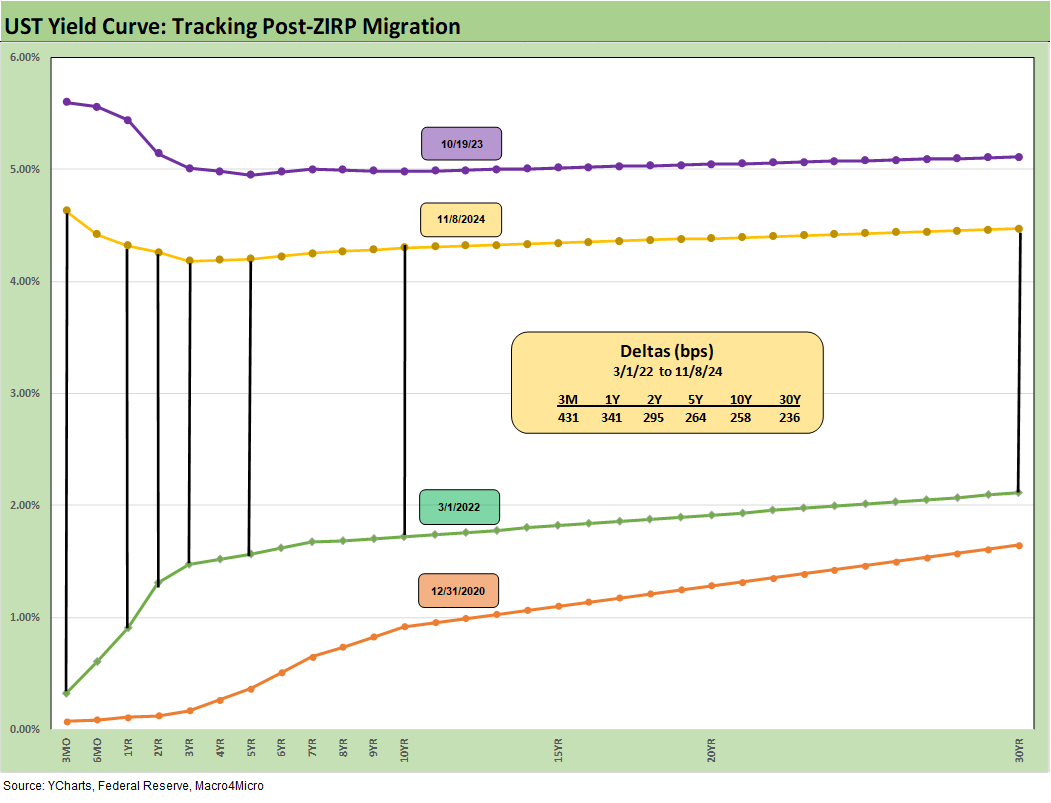
We wrap with the usual chart showing the running UST deltas from the start of March 2022 as that month saw the end of ZIRP and the start of the tightening cycle (effective March 17, 2022). We also include the 12-31-20 UST curve and the 10-19-23 curve (the peak 10Y UST date) as frames of reference.
The box breaks out the yield deltas with +431 bps for 3M, +341 bps for 1Y, +295 bps for 2Y, +264 bps for 5Y, +258 bps for 10Y and +236 bps for 30Y. The 2Y to 10Y is the “meat of the lineup” for the corporate bond market and the slow and steady move higher over time for coupons and return to normalcy (sort of). That includes the migration back towards par in the benchmark indexes (currently 94+ on IG and 96+ for HY). Refinancing and extension in HY will see coupons move higher more quickly than in make-whole heavy IG.
See also:
Footnotes & Flashbacks: Asset Returns 11-10-24
Mini Market Lookback: Extrapolation Time? 11-9-24
The Inflation Explanation: The Easiest Answer 11-8-24
Fixed Investment in 3Q24: Into the Weeds 11-7-24
Morning After Lightning Round 11-6-24
Footnotes & Flashbacks: Credit Markets 11-4-24
Payroll Oct 2024: Noise vs. Notes 11-2-24
All the Presidents’ Stocks: Beware Jedi Mind Tricks 11-1-24
PCE Inflation Sept 2024: Personal Income and Outlays 10-31-24
Employment Cost Index Sept 2024: Positive Trend 10-31-24
3Q24 GDP Update: Bell Lap Is Here 10-30-24
The Politics of Objective GDP Numbers: “Flex Facts” on Growth 10-30-24
Tariffs: The EU Meets the New World…Again…Maybe 10-29-24
JOLTS Sept 2024: Solid but Lower, Signals for Payroll Day? 10-29-24
Trump, Trade, and Tariffs: Northern Exposure, Canada Risk 10-25-24
Durable Goods Sept 2024: Taking a Breather 10-25-24
New Home Sales: All About the Rates 10-25-24
PulteGroup 3Q24: Pushing through Rate Challenges 10-23-24
Existing Home Sales Sept 2024: Weakening Volumes, Rate Trends Worse 10-23-24
State Unemployment Rates: Reality Update 10-22-24
Housing Starts Sept 2024: Long Game Meets Long Rates 10-18-24
Trump at Economic Club of Chicago: Thoughts on Autos 10-17-24
CPI Sept 2024: Warm Blooded, Not Hot 10-10-24
HY OAS Lows Memory Lane: 2024, 2007, and 1997 10-8-24
For any1 interested, here are my Oct CPI estimates:
https://open.substack.com/pub/arkominaresearch/p/oct-2024-cpi-estimate?r=1r1n6n&utm_campaign=post&utm_medium=web