
Housing Starts Sept 2024: Long Game Meets Long Rates
Single Family starts stay firm sequentially with Multifamily declining with the market now sorting out mortgages rates.


Housing starts rose sequentially on single family by +2.7% from Aug 2024 and +5.5% YoY while Multifamily dropped by -4.5% sequentially and -15.7% YoY. That rolled into a total for all starts being down by -0.5% from Aug 2024 and -0.7% YoY.
Permits for single family was flattish at +0.3% MoM and -1.2% YoY with Multifamily at -10.8% MoM and -17.4% YoY and rolling into Total Permits at -2.9% MoM and -5.7% YoY.
With mortgage rates ticking higher (Freddie Mac’s weekly Thursday post to 6.44% this week from 6.32% last week) and a healthier set of numbers on the consumer side, the question around builders is whether their planning might dial back expectations on demand and permits will remain soft. We see numerous 30Y mortgage rate quotes closer to 6.7% to end the week in a choppy market with weekly ranges wider.
Builders have demonstrated working capital management discipline given the inherent flexibility to match their rate of starts with the pace of sales. Builders show low financial risk profiles with prudent starts and inventory planning with a supportive supply-demand imbalance favoring demand.
For the builders, the mix of incentives (mortgage buydowns, fees, etc.) are a reassuring swing factor for builder risk management in a sustained healthy sales market even if mortgages stay stubbornly high above 6% (one year ago, the Freddie rate was 7.63%). The swing factor is mortgage rates and affordability of monthly payments.

The above chart breaks out the timeline from the Go-Go 60s across the stagflationary 1970s/early 1980s, the housing bubble of the early millennium years, and then the slow post-crisis ZIRP rebound to a cyclical peak during COVID in Dec 2020 on the “flight to the burbs” with record low mortgage rates down into the sub-3% area.
The current single family rate of 1027 is only modestly above the long-term median but below the bull market 1980s/1990s. The Housing Bubble median from 2000 to 2008 leads the median ranks at 1312, The post-crisis-to-current median at 777 shows the economic fallout of high unemployment after the credit crisis and a housing sector deflation period with a mix of regional and metro market crashes in the critical South and West markets.

The above chart breaks out the trend line in total permits and starts and single family permits and starts across the period from ZIRP and record mortgage activity in the immediate COVID period on through the tightening cycle and material moves in mortgage rates. The peaks in March and April 2022 and the start of the tightening cycle are what keeps homebuilder equity bulls in the game given pent up demand.
Even a mild recession would help in the context of many potential homebuyers who would see the level of monthly payments decline and their down payment buying them “more house for the dollar.” In a simple world (and we know it is never simple) with 6% unemployment rates, that means 94% are employed. The ability to free up more existing home inventory in a lower mortgage rate market would also help supply and free up embedded home equity gains for price and product competition and more opportunities for move-up builder offerings to show sellers of existing homes.
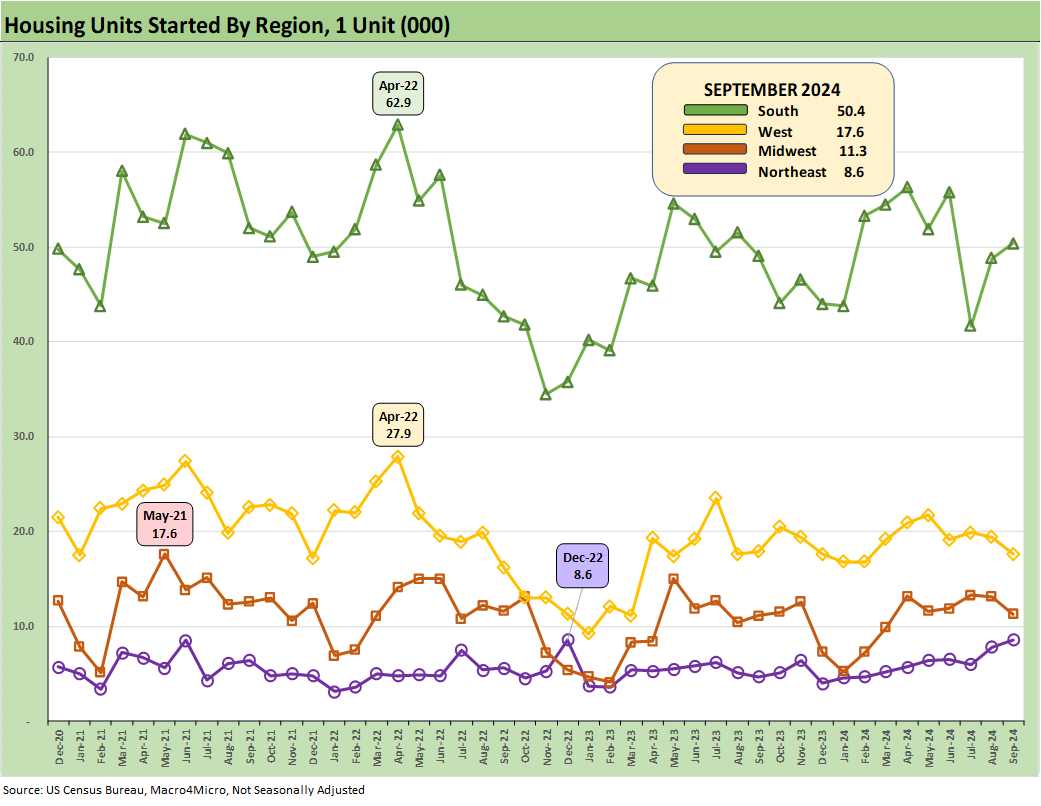
The above chart updates the starts by region using “not seasonally adjusted” (NSA) data points to get closer to the actual trench activity. As always, the South rules the roost with the massive Texas and Florida single family market among other regions showing housing sector growth on the single family side.
The critical South market comprises around 58% of Sept single family starts on a SAAR basis for the month. We also see a 58% share held by the South on YTD 2024 starts on a not seasonally adjusted (NSA) basis.
We see a +6.6% sequential move on South single family starts (SAAR) and +1.9% YoY. The West as the #2 region was off slightly on both MoM and YoY. The Midwest was off more materially (-10.4%) for single family in MoM but +3.4% YoY. The small Northeast market was +10.6% in single family and +77.4% YoY (94K vs. 53K).

The above chart updates the Multifamily starts numbers as detailed in the bullets above. The themes for Multifamily across recent months are intact as the peak building Multifamily cycle is over and supply is healthy. We see plenty still under construction at 825K but a new LTM low for the period in the “under construction” bucket. Completions of Multifamily were +41.9% YoY (down -8.7% MoM), so the supply side of the equation is still supposed to offer ample alternatives subject to metro areas.

The above chart shows Multifamily permits down -10.8% from Aug 2024 and -17.4% YoY, so that trend is in line with what we have been seeing relative to the pre-tightening timeline that saw a Multifamily boom with low rates and favorable demographics. The time series looks more like the 1980s but the early 1970s was in a different zone. Inflation disrupted the early 1970s boom and the same after early 2022.
See also:
Trump at Economic Club of Chicago: Thoughts on Autos 10-17-24
Retail Sales Sep 2024: Taking the Helm on PCE? 10-17-24
Industrial Production: Capacity Utilization Soft, Comparability Impaired 10-17-24
Footnotes & Flashback: Credit Markets 10-14-24
Footnotes & Flashbacks: State of Yields 10-13-24
Footnotes & Flashbacks: Asset Returns 10-12-24
CPI Sept 2024: Warm Blooded, Not Hot 10-10-24
HY OAS Lows Memory Lane: 2024, 2007, and 1997 10-8-24
Footnotes & Flashbacks: Credit Markets 10-7-24
Footnotes & Flashbacks: State of Yields 10-6-24
Footnotes & Flashbacks: Asset Returns 10-6-24
Mini Market Lookback: Cracking the 300 Line in HY 10-5-24
Payroll Sept 2024: Rushing the Gate 10-4-24
CarMax: Why Do We Watch KMX as a Bellwether? 10-3-24
Credit Returns: Sept YTD and Rolling Months 10-1-24
Housing and Homebuilders:
KB Home: Steady Growth, Slower Motion 9-26-24
New Home Sales Aug 2024: Waiting Game on Mortgages or Supply? 9-25-24
Lennar: Bulletproof Credit Despite Margin Squeeze 9-23-24
Existing Homes Sales Aug 2024: Mortgages Still Rule 9-19-24
Home Starts Aug 2024: Mortgage Rates to Kickstart Hopes Ahead? 9-18-24
Harris Housing Plan: The South’s Gonna Do It Again!? 8-28-24
New Home Sales July 2024: To Get by with a Little Help from My Feds? 8-24-24
Credit Crib Note: PulteGroup (PHM) 8-11-24
Credit Crib Note: D.R. Horton (DHI) 8-8-24
New Homes Sales June 2024: Half Time? Waiting for Mortgage Trends 7-24-24
Homebuilder Equities: “Morning After” on Rate Optimism 7-12-24
Homebuilders: Equity Performance and Size Rankings 7-11-24
Credit Crib Note: KB Home 7-9-24
Lennar: Key Metrics Still Tell a Positive Macro Story 6-20-24
Credit Crib Note: NVR, Inc. 5-28-24