
Footnotes & Flashbacks: Credit Markets 2-17-25
We saw another quiet week in spreads even in the face of major macro headlines that also posted a very mild UST rally.


Reciprocal? As in “Pay whatever I say?!”
We run through another mild week for spreads in a remarkable stretch where credit risk pricing is not blinking about tariffs. Such threats are discounted (for now) as “not happening.” Let it ride. HY spreads remain in the middle of the June 2007 credit peak range.
The good news is that the financial system, US industry broadly, and the credit markets are in much better shape today than in 2H07. There is thus a reasonable debate to have on its sustainability - unless Trump tariffs, trade wars and geopolitics go too far over the top and change the equation. Right now, the policies are heading in that direction. Optimists call the tariff rhetoric “negotiation tactics.”
The week brought news on steel and aluminum tariffs that many see as a clear attack on Canada. The private sector is best positioned to “know what they need” for their business lines and certainty know more than the White House (see Aluminum and Steel Tariffs: The Target is Canada 2-10-25).
The launch of a “reciprocal tariff” program was a new low for misleading policy descriptions but hardly out of the ordinary for political macro spin (see Reciprocal Tariffs: Weird Science 2-14-25). The potential threats to the EU are obvious but Japan and South Korea could be next as the review proceeds and their major trade deficits get attention from Trump. Within the EU, Germany narrowly is also under siege from the White House on the political front – including by Musk.

The above chart updates the YTD run rates on total returns and excess returns for IG and HY and the credit tiers. So far, the IG market is dictated by duration, but the HY market has been riding some decent spread compression as well in excess returns. HY OAS is -30 bps tighter YTD with IG only -2 bps.

The above chart updates the IG spread time series, and the +80 bps is -4 bps tighter and thus little changed from last week. IG OAS is right around the multicycle lows of the new millennium and just above the +77 bps post-crisis lows of Nov-Dec 2024.

HY OAS is still mired in the June 2007 range when the tights of that cycle were reached. Current HY OAS is above the +241 bps to start June 2007 but still well below the +298 bps HY OAS seen when June 2007 ended.
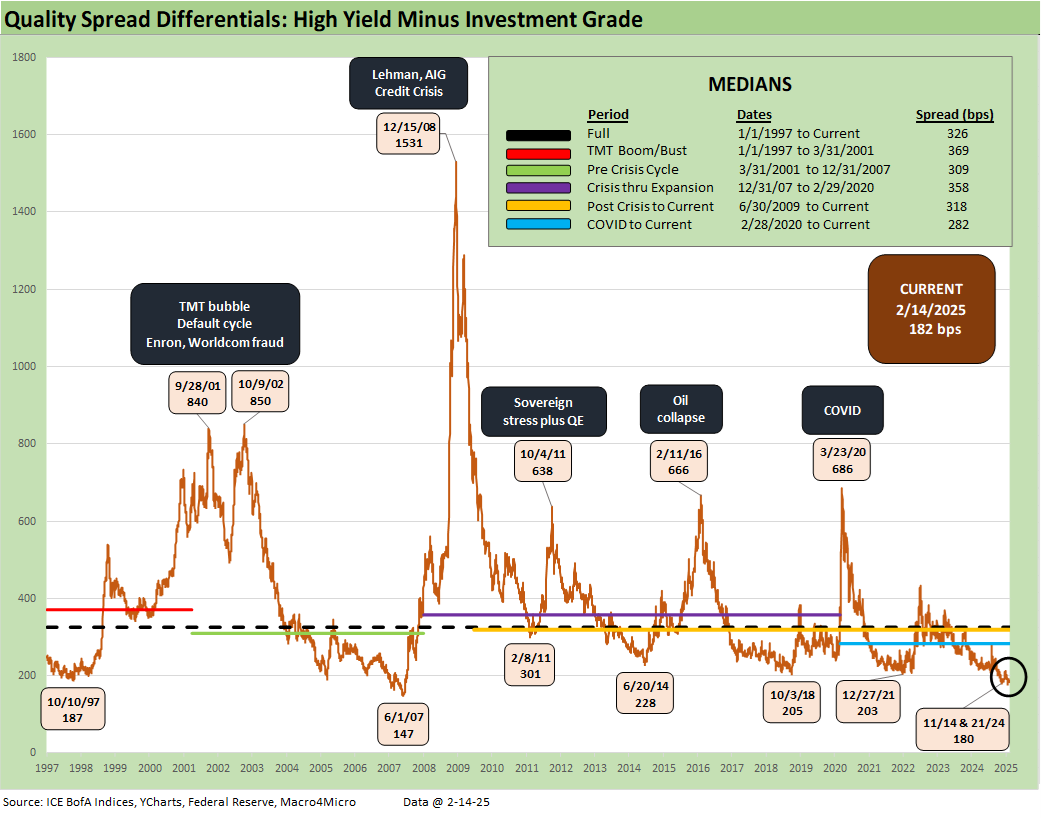
Quality spread differentials for “HY minus IG” remain below the rarely crossed +200 bps line at +182 bps. June 2007 was materially tighter even as the HY quality mix in June 2007 was decidedly worse than today. The June 2007 period saw issuer credit quality get worse quickly in the summer of 2007 as LBO deals started getting pulled. When we look at June 2005 vs. today, there is more to the story line than the aggregate HY index OAS (see history links at the bottom of this commentary).

The relative quality spread compression seen in HY vs. IG is also evident along the BBB vs. BB differentials as well. The +59 bps for “BB OAS minus BBB OAS” is near credit cycle lows across the decades and into the rarely crossed sub-60 range.

The sub-200 bps BB tier OAS line is also not a typical spread zone across the cycles. The sub-160 bps line is very rare – even in mid-2007. The 2014 and 2018 lows did not crack +200 bps.

The B tier has been the main event kicking off the big HY rally in late 2023. The current +264 bps level for the B tier is only 10 bps above the fall 2024 low of +254 bps. June 2014 and Oct 2018 did not get very close to the +300 bps line.
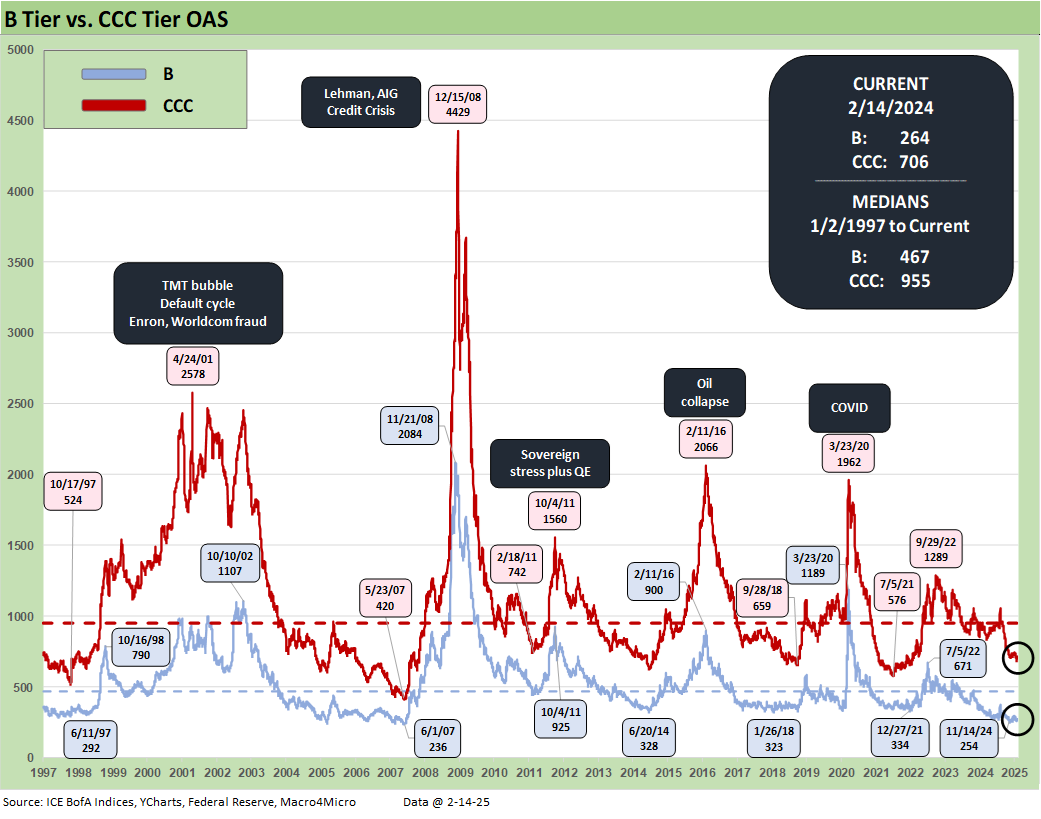
We update the B vs. CCC history above, and we see the periodic (and rare) periods of extreme divergence between the two tiers seen in the past (see The B vs. CCC Battle: Tough Neighborhood, Rough Players 7-7-24). We note the highs and lows across the periods from the TMT credit cycle peak and spread lows of 1997 and then into the TMT meltdown, the crisis years, sovereign stress, oil crash, the COVID spike, and inflation-fighting tightening cycle.
The credit crisis of 2008 radiated out from the mortgage markets, derivatives and counterparty excess, and a dangerously interconnected bank system that in turn drove credit contraction and took a toll on the corporate sector. That spread quickly into impaired secondary liquidity in an illiquid OTC credit market (see Wild Transition Year: The Chaos of 2007 11-1-22, Greenspan’s Last Hurrah: His Wild Finish Before the Crisis 10-30-22).
The chart also reminds us that very dramatic spread gaps on the low end can occur outside economic contraction periods during bouts of asset risk volatility such as fall 2011 (sovereigns and related renewed bank anxiety) and late 2015/early 2016 (energy crash).
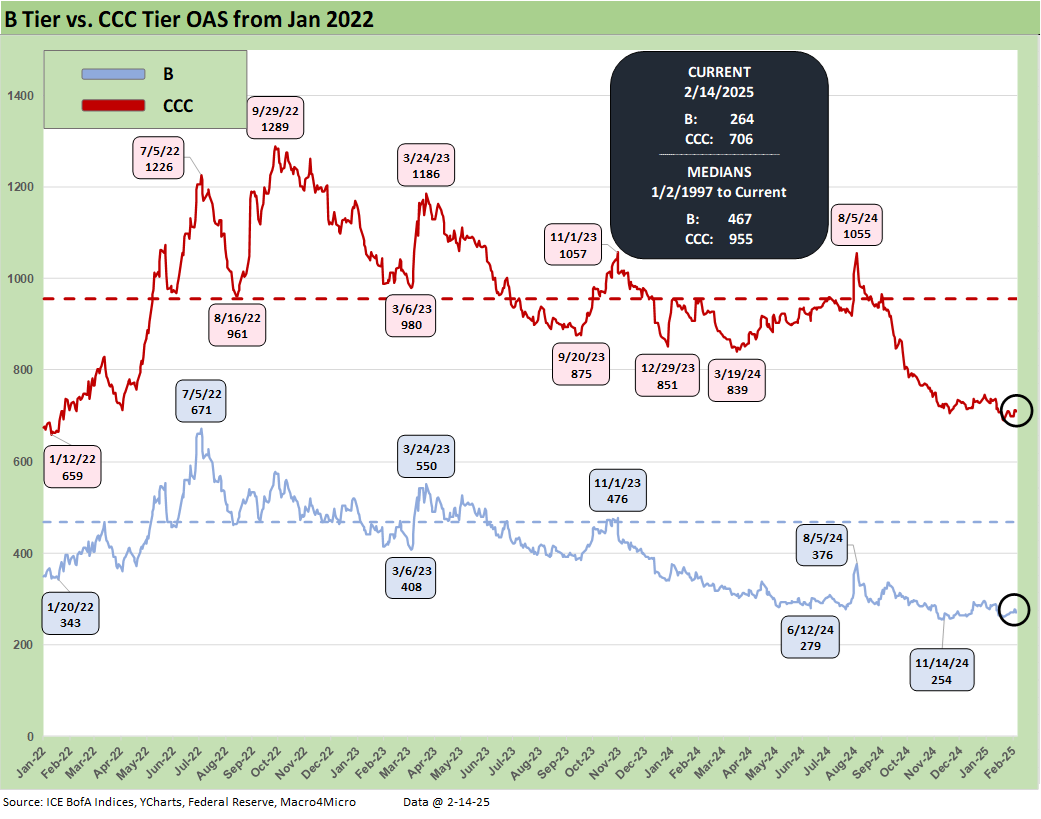
The above chart shortens up the timeline from early 2022 for the B tier and CCC tier and frames the spread reactions across the tightening cycle.

The history of the “CCC OAS minus B tier OAS” quality spread differential can be especially volatile to the point of being better measured in dollar price points than basis points (see The B vs. CCC Battle: Tough Neighborhood, Rough Players 7-7-24). In most markets, however, basis points still work. The above history shows a median of +482 bps vs. the current +442 bps.
A look at yields….
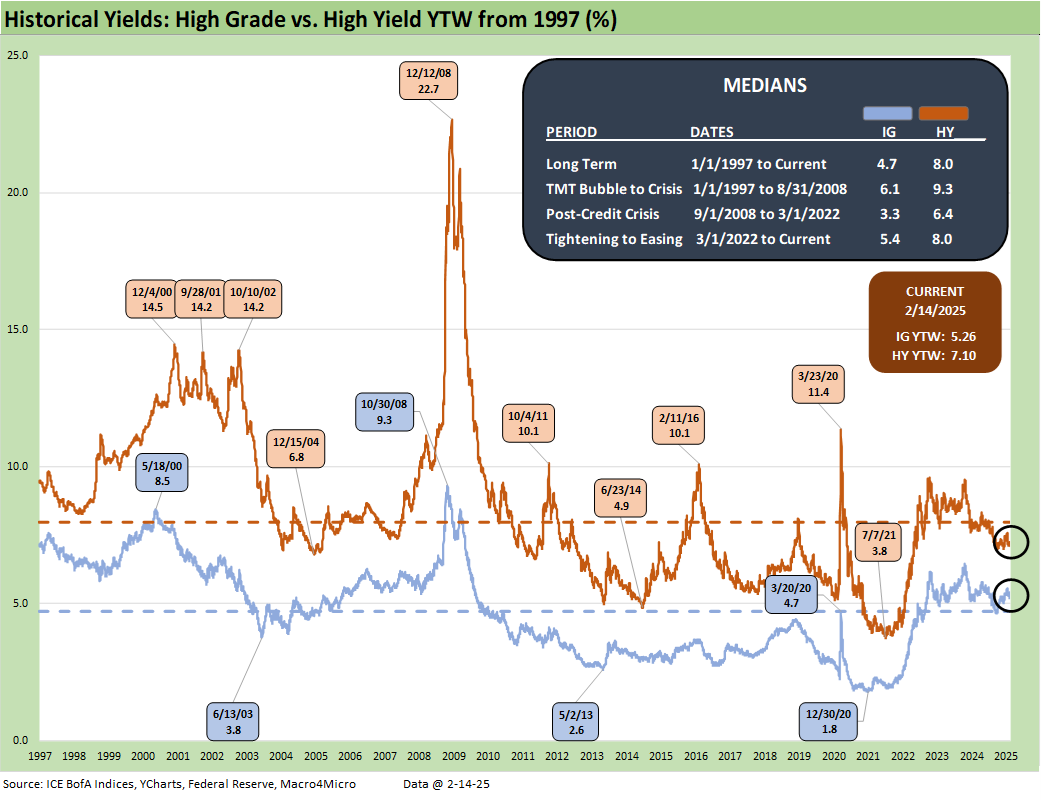
The above chart updates the yields for the HY vs. IG index with some short credit cycle timeline medians broken out. As we point out each week, the pre-ZIRP, pre-crisis median of +6.1% for IG and +9.3% for HY are the most relevant now that the ZIRP years of Dec 2008 to Dec 2015 and March 2020 to March 2022 are now behind the market with the Fed in a post-inflation/post-tightening period and into an easing cycle.

The above chart frames IG index yields and the related UST curve for the Friday close and for two useful comps from prior credit cycle peaks in June 2007 and Dec 1997 when credit markets were hot and spreads down near multiyear lows. For IG yields, the story is all about the UST curve differentials with spreads tight in all three markets.
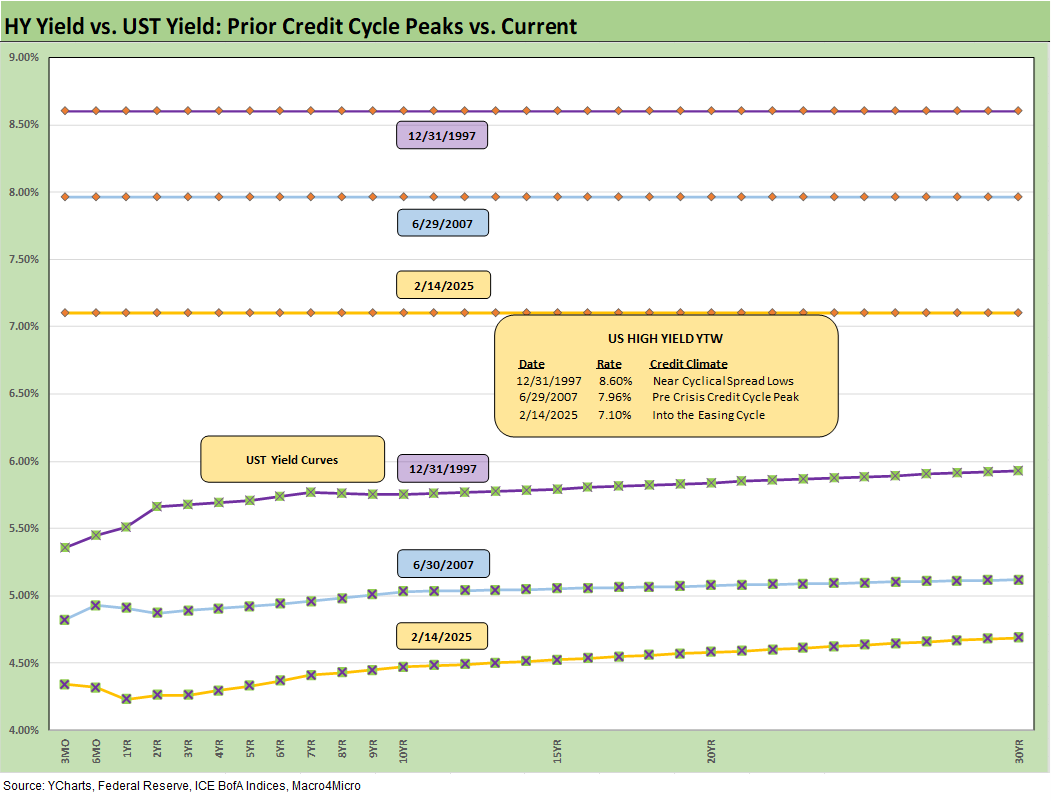
The above chart does the same drill as the prior chart but for HY index yields. The low UST curve relative to history and extremely tight spreads put the current HY index yield below the earlier peak credit cycles.
See also:
UST Yields: Sept 2024 UST in Historical Context 2-17-25
Footnotes & Flashbacks: State of Yields 2-16-25
Footnotes & Flashbacks: Asset Returns 2-16-25
Mini Market Lookback: Headline Frenzy, Sloppy Details 2-15-25
Iron Mountain 4Q24: Performance Bar Gets Raised 2-15-25
Retail Sales Jan 2025: Warning Sign or Holiday Hangover? 2-14-25
Industrial Production Jan 2025: Capacity Utilization 2-14-25
CPI Jan 2025: Getting Frothy Out There 2-12-25
Footnotes & Flashbacks: Credit Markets 2-10-25
Footnotes & Flashbacks: State of Yields 2-9-25
Footnotes & Flashbacks: Asset Returns 2-9-25
Mini Market Lookback: Simply Resistible! 2-8-25
Mini Market Lookback: Surreal Week, AI Worries about “A” 2-1-25
4Q24 GDP: Into the Investment Weeds 1-30-25
4Q24 GDP: Inventory Liquidation Rules 1-30-25
Credit Crib Note: Lennar Corp 1-30-25
D.R. Horton: #1 Homebuilder as a Sector Proxy 1-28-25
Durable Goods Dec 2024: Respectable ex-Transport Numbers 1-28-25
New Home Sales Dec 2024: Decent Finish, Strange Year 1-28-25
Tariff links:
Reciprocal Tariffs: Weird Science 2-14-25
US-EU Trade: The Final Import/Export Mix 2024 2-11-25
Aluminum and Steel Tariffs: The Target is Canada 2-10-25
US-Mexico Trade: Import/Export Mix for 2024 2-10-25
Trade Exposure: US-Canada Import/Export Mix 2024 2-7-25
US Trade with the World: Import and Export Mix 2-6-25
The Trade Picture: Facts to Respect, Topics to Ponder 2-6-25
Tariffs: Questions to Ponder, Part 1 2-2-25
US-Canada: Tariffs Now More than a Negotiating Tactic 1-9-25
Trade: Oct 2024 Flows, Tariff Countdown 12-5-24
Mexico: Tariffs as the Economic Alamo 11-26-24
Tariff: Target Updates – Canada 11-26-24
Tariffs: The EU Meets the New World…Again…Maybe 10-29-24
Trump, Trade, and Tariffs: Northern Exposure, Canada Risk 10-25-24
Trump at Economic Club of Chicago: Thoughts on Autos 10-17-24
Facts Matter: China Syndrome on Trade 9-10-24
Select Histories:
Annual and Monthly Asset Return Quilt 2024 Final Score 1-02-25
Spread Walk 2024 Final Score 1-2-25
HY and IG Returns since 1997: Four Bubbles and Too Many Funerals 12-31-24
HY OAS Lows Memory Lane: 2024, 2007, and 1997 10-8-24
The B vs. CCC Battle: Tough Neighborhood, Rough Players 7-7-24
HY Spreads: Celebrating Tumultuous Times at a Credit Peak 6-13-24
Credit Markets Across the Decades 4-8-24
Credit Cycles: Historical Lightning Round 4-8-24
Histories: Asset Return Journey from 2016 to 2023 1-21-24
HY Multicycle Spreads, Excess Returns, Total Returns 12-15-23
HY Credit Spreads: Migration, Medians, and Misdirection 11-6-23
Credit Spreads: Proportions Matter in Risk Compensation 8-14-23
Fed Funds vs. Credit Spreads and Yields Across the Cycles 6-19-23
Wild Transition Year: The Chaos of 2007 11-1-22
Greenspan’s Last Hurrah: His Wild Finish Before the Crisis 10-30-22