
Retail Sales Jan 2025: Warning Sign or Holiday Hangover?
We look at the moving parts of a steep decline in Retail Sales that could signal a building case of consumer fatigue.


Retail Sales fell -0.9% MoM in January, marking the worst headline reading in a year. Core retail goods saw a similar decline at -0.8% and points to some weakening consumer demand as reliance on credit cards continues rising.
The one-month decline carries warning signs but is not an immediate red flag as it follows a strong 2H24 and coincides with extreme weather and wildfires in January that likely saw retail activity disrupted.
With this week’s inflation print moving the needle back towards “higher for longer” before even seeing tariff policy play out, a weak retail sales report complicate the Fed’s decision-making process with the 10Y down today by -5 bps and the 2Y down -6bps as we to print. The curve moves since the 10Y lows of 3.6% in Sept offer a reminder that the curve can move quickly.
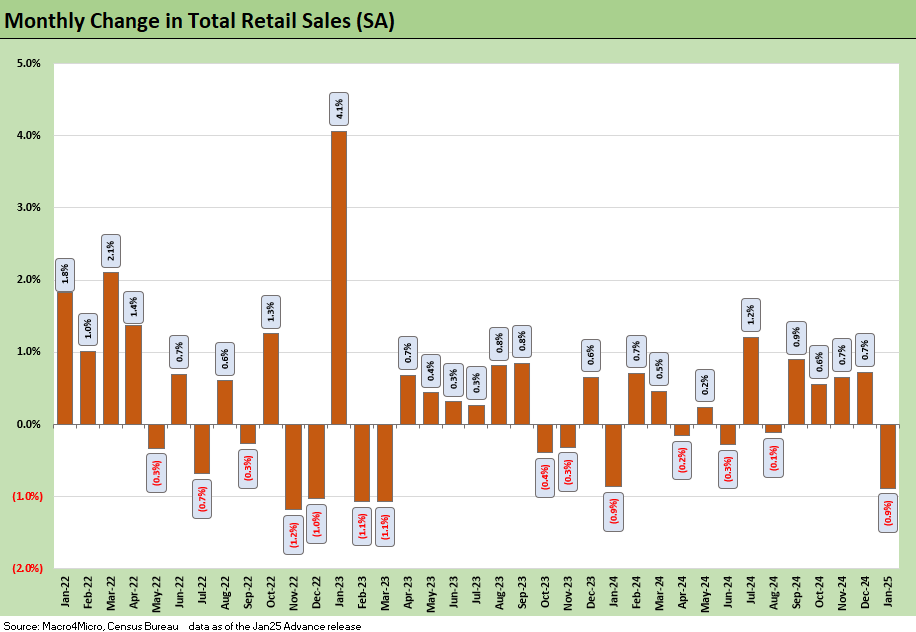
The above chart provides the recent history of monthly moves for the headline Retail Sales as we see a -0.9% decline to start 2025. Today’s worse-than-expected retail sales report comes after both a frothy CPI print back to 3% and the NY Fed Household Consumer Credit release that points to a continued rise in credit card use and delinquency rates.
There is an unavoidable connection between tariff policies and increasing supply costs that means some inflationary pressures in the foreseeable future. Combining those data points into a ‘too early’ jump to a conclusion of rising inflation and weakening consumer demand complicates the forward outlook for monetary policy. We recently saw inflation expectations spike, but payrolls and wages are still the main event for households with stretched household balance sheets a trade-off.
We do not yet see the outlook for consumer demand to be so sanguine solely based on the recent data though and rather are seeing more warning signs to track. As seen above, 2H24 was a strong period of retail sales growth and, for the optimist, a pull-forward of demand that sees the past few months contributing to weakness today. This January print also is set against severe cold weather across the country in addition to California wildfires, both of which led to altered consumer patterns and disrupted demand, potentially amplifying a demand pullback underway.
Though the weakness in consumer demand trends today can be written off to an extent for those who see demographics and payroll as tailwinds, the readthrough to consumer credit health is eroding and arguably less defensible. Bank earnings this season pointed towards continued increases to credit charge-offs with stress in lower income brackets. That is consistent with the largest contributor to increasing household debt in 4Q24 as credit card loans of $45bn more outstanding (as per NY Fed). Delinquency rates continue to rise and remain a key metric as they trend higher quarter after quarter. Household balance sheets are in worse shape today than the last inflation bout in 2022, setting up another test for consumer resilience if inflation does in fact keep rising.

The above table covers the underlying line items and other slices of the retail sales number such as ‘ex-Autos’ and Core Retail. There is no single explanation that fits all for the declines this month as cold weather events would typically encourage less spending on services and more online shopping (Nonstore retailers). The wildfires on the other hand may have had the opposite effect on some lines leading to more eating out and gas needs as displacements led to temporarily nomadic lifestyles.
Of the various declines above, Autos is a particular area of focus given the various tariff policies that are slated to ripple across the autos industry. As we cover separately, autos saw some weakness in Industrial Production (see Industrial Production Jan 2025: Capacity Utilization 2-14-25). Interest rates and consumer confidence could conspire to partly undermine the peak spring selling season.
See also:
Industrial Production Jan 2025: Capacity Utilization 2-14-25
CPI Jan 2025: Getting Frothy Out There 2-12-25
Footnotes & Flashbacks: Credit Markets 2-10-25
Footnotes & Flashbacks: State of Yields 2-9-25
Footnotes & Flashbacks: Asset Returns 2-9-25
Mini Market Lookback: Simply Resistible! 2-8-25
Mini Market Lookback: Surreal Week, AI Worries about “A” 2-1-25
4Q24 GDP: Into the Investment Weeds 1-30-25
4Q24 GDP: Inventory Liquidation Rules 1-30-25
Credit Crib Note: Lennar Corp 1-30-25
D.R. Horton: #1 Homebuilder as a Sector Proxy 1-28-25
Durable Goods Dec 2024: Respectable ex-Transport Numbers 1-28-25
New Home Sales Dec 2024: Decent Finish, Strange Year 1-28-25
Tariff links:
Reciprocal Tariffs: Weird Science 2-14-25
US-EU Trade: The Final Import/Export Mix 2024 2-11-25
Aluminum and Steel Tariffs: The Target is Canada 2-10-25
US-Mexico Trade: Import/Export Mix for 2024 2-10-25
Trade Exposure: US-Canada Import/Export Mix 2024 2-7-25
US Trade with the World: Import and Export Mix 2-6-25
The Trade Picture: Facts to Respect, Topics to Ponder 2-6-25
Tariffs: Questions to Ponder, Part 1 2-2-25
US-Canada: Tariffs Now More than a Negotiating Tactic 1-9-25
Trade: Oct 2024 Flows, Tariff Countdown 12-5-24
Mexico: Tariffs as the Economic Alamo 11-26-24
Tariff: Target Updates – Canada 11-26-24
Tariffs: The EU Meets the New World…Again…Maybe 10-29-24
Trump, Trade, and Tariffs: Northern Exposure, Canada Risk 10-25-24
Trump at Economic Club of Chicago: Thoughts on Autos 10-17-24
Facts Matter: China Syndrome on Trade 9-10-24
Trade Flows: More Clarity Needed to Handicap Major Trade Risks 6-12-24
Trade Flows 2023: Trade Partners, Imports/Exports, and Deficits in a Troubled World 2-10-24
Trade Flows: Deficits, Tariffs, and China Risk 10-11-23
Midyear Trade Flows: That Other Deficit 8-10-23
State of Trade: The Big Picture Flows 12-18-22