
Footnotes & Flashbacks: Asset Returns 2-16-25
We look at returns for the headline-filled week that stayed remarkably calm and net positive for asset returns.


The frictionless wheel sales pitch continues for tariffs.
A positive week for equities (9 of 11 S&P 500 sectors positive, 26-6 score on our 32 benchmarks and ETFs) and very slight rally in the UST despite the CPI numbers made for interestingly muted results set against a week of tariff uncertainty and some geopolitical shockers for allies (former or otherwise).
The idea that high tariffs are risk free and have no supplier chain or goods price impact is now blurring with the idea that geopolitics will bring no fallout. The rising tension we see in the headlines will shape domestic political interests for the nations impacted by some extreme policy schemes that just will not die.
In no special order, the hottest topics include Canada as the 51st state, Gaza as the newly cleansed (ethnically) version of Orlando, and Ukraine giving up half its resources to the US in exchange for support (maybe). Life is getting stranger quickly.
The murky reciprocal tariff topic is a sales pitch with two sets of books, one that says, “they pay what we pay” but then the real set of books that says, “we can make up whatever number we want based on a wide range of criteria.” The market yawned but the reality game clock is ticking down.
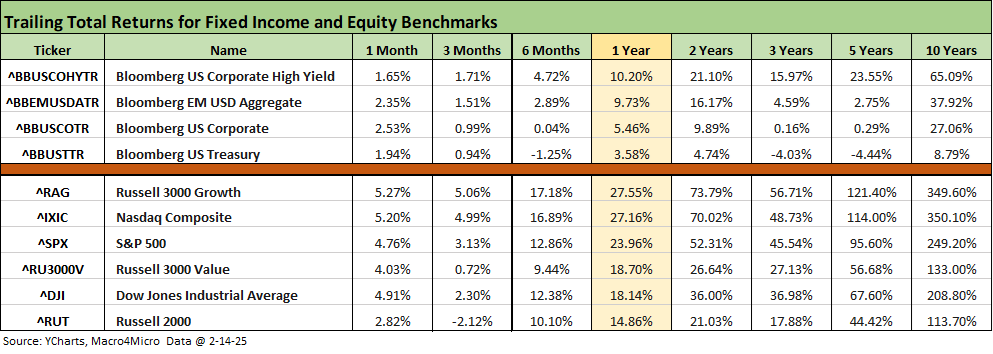
The high-level benchmarks for debt and equity we track each week show favorable overall results. That is impressive considering all the policy turmoil and confusion over what the tariffs will be in the end and how trade partners will react. The trailing 1-month results in debt and equity are now all positive for 1-month. For the 3-month period, debt is all positive. The equity benchmarks are all positive for 1-month and 6-months, but the Russell 2000 is negative for the 3-month horizon while Russell 3000 Growth trumps Russell 3000 Value.
Strained relations generate domestic political pressure for trade partners…
When we hear boos at hockey tournaments in Canada and see 3 fights breaking out when the first puck gets dropped in Canada vs. the US in the 4 Nations Face-Off, there is a problem. It was like a scene from Slapshot but real this time. The clash reflects the tone of the Canadian print and online media that sees little visibility day-to-day on this side of the border. The Canada-US clash was instigated by Trump, but the cost to both sides could be high. Trump cannot rely on Canadian leadership being as gutless as the average US Senator.
As an example of the misinformation loose on tariff and the effects, Trump was on social media saying the US needs nothing from Canada and that the US has “all the trees it needs.” The pressure on housing costs that will come with already high tariffs on Canadian lumber (rose from 8% handles to 14% handles in 2024 as detailed by the NAHB). The tariffs on Canadian lumber could soon approach 40% with the latest tariff threats. Counting trees is a nice pastime, but there might be an opportunity to also count the sawmills and evaluate the logistical limitations on getting the lumber from point A to point B at a time of very strained affordability in housing. Housing demand has demographics on its side but now also adds the effects of so many homes destroyed by weather and fire.
To quote the National Association of Homebuilders on the broader Canada and Mexico tariff issues:
“More than 70% of the imports of two essential materials that home builders rely on — softwood lumber and gypsum (used for drywall) — come from Canada and Mexico, respectively.” Source: NAHB
“Tariffs on lumber and other building materials increase the cost of construction and discourage new development, and consumers end up paying for the tariffs in the form of higher home prices. NAHB urges the administration to reconsider this action on tariffs and we will continue to work with policymakers to eliminate barriers that make housing more costly and prevent builders from boosting housing production.” Source: NAHB.
Labor deportation and tariffs on supplier chains are not going to fit into a framework of visceral whiteboard planning detached from sea-level economic reality. The transactions in the real world are not occurring on a large scale yet with the full tariffs in effect. The clock is ticking. Trump might change his mind or deflect to another crisis. When the pain comes, there will likely be a lot more distractions and headlines planned in the queue.
The reality will remain the same:
Buyer pays the tariffs. Not the seller (Trump’s view).
The buyer needs to pass on the tariff or eat the cost.
There is much that we need from Canada. That is why the private sector buys it.
At some point, negotiations and tactics give way to economic events and actual recorded transactions. Then the effects cannot be rationalized away. There is a shorter game clock on many of these tariffs (e.g. steel, aluminum, blanket Canada and Mexico tariffs, etc.), and some with longer lag times in the realm of “Reciprocal Tariffs.” Framing the reciprocal risks will have a reality check before they are in place from the other tariffs.
The rolling return visual
In the next section, we get into the details of the 32 ETFs and benchmarks for a mix of the trailing periods. Below we offer a condensed 4-chart view for an easy visual on how the mix of positive vs. negative returns shape up. This is a useful exercise we do each week looking for signals across industry groups and asset classes.
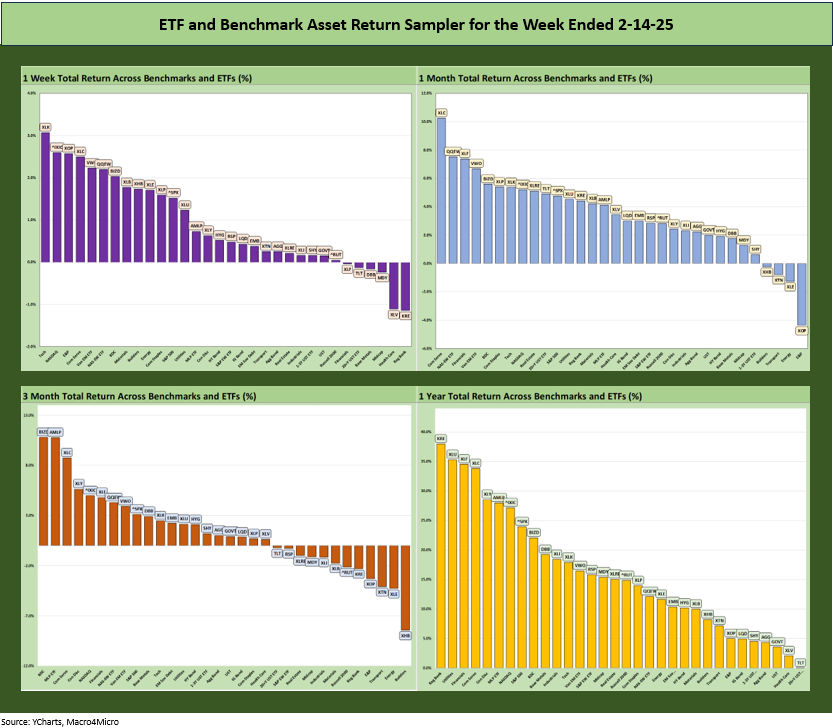
The above balance of positive and negative across the various time horizons we present tells a favorable story consistent with the strong economy of the trailing year and during the transition into 2025. The worst balance in the 4 time periods is the 20-12 for trailing 3-months.
A good earnings season should keep optimism in place, but instead we are debating tariffs (and even how they work), trade war risk, Canada as a 51st state, the right to whimsically violate sovereignty (Greenland), Gaza as a real estate development project for the US to own, and what it will all mean with a wave of purges in the government, law enforcement, and the military ongoing. At some point, the market will react when the effects become more evident.
The Magnificent 7 heavy ETFs…
Some of the benchmarks and industry ETFs we include have issuer concentration elements that leave them wagged by a few names. When looking across some of the bellwether industry and subsector ETFs in the rankings, it is good to keep in mind which narrow ETFs (vs. broad market benchmarks) get wagged more by the “Magnificent 7” including Consumer Discretionary (XLY) with Amazon and Tesla, Tech (XLK) with Microsoft, Apple, and NVIDIA, and Communications Services (XLC) with Alphabet and Meta.
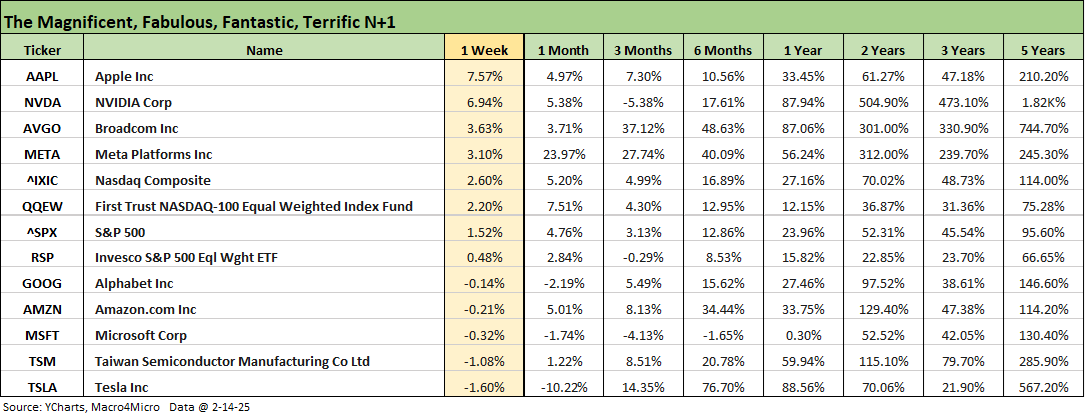
The tech bellwether performance had fewer anomalies and less divergence this past week with Apple and NVIDIA leading the pack after some of the recent weakness in tech. The table lines up the line items in descending order of total returns for the week. We see 4 of the Mag 7 in the red and the other 3 of the Mag 7 ahead of the NASDAQ joined by Broadcom.
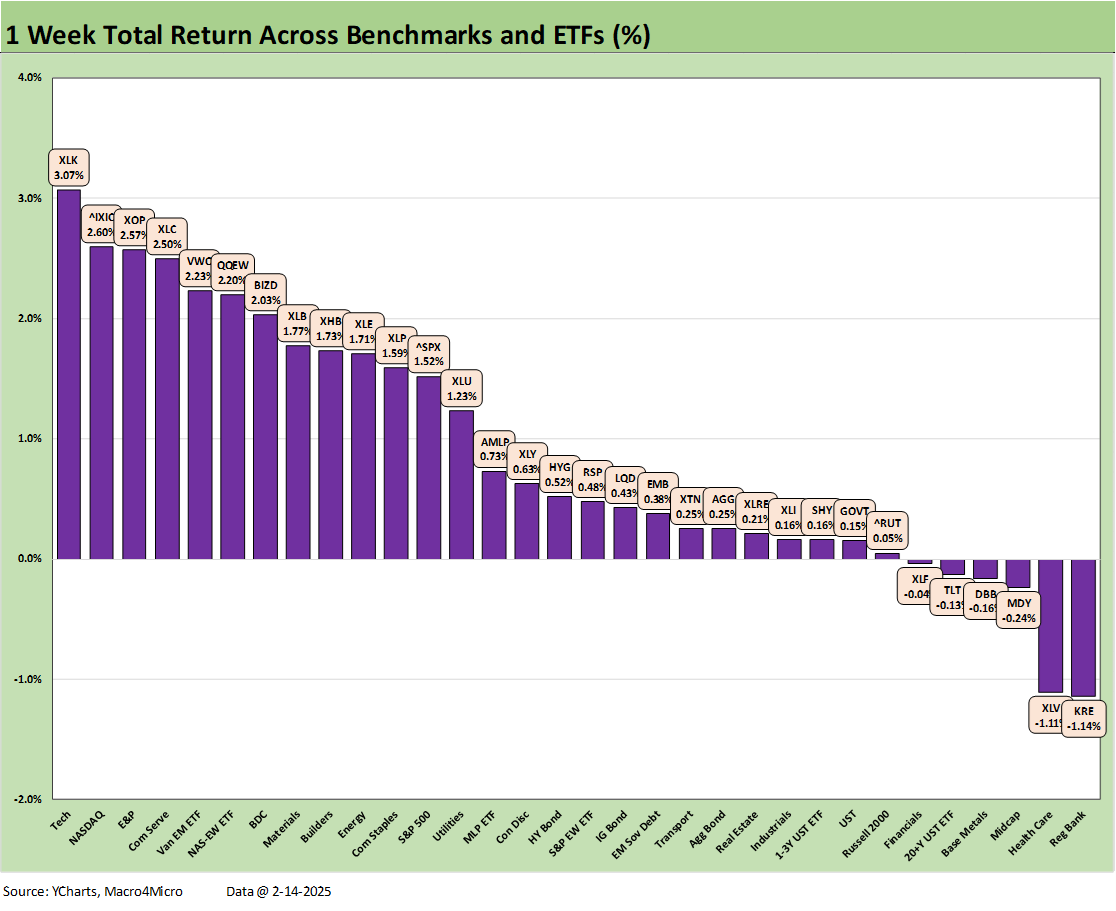
The 1-week returns weighed in at 26-6 with half the top quartile from tech or Mag 7 heavy ETFs. We see the Tech ETF (XLK) at #1 followed by NASDAQ. XLK does not make the top quartile for the rolling 3 months, so the chip players are in catch-up mode with NVIDIA just under +7% for the week. The Communications Services ETF (XLC) and Equal Weight NASDAQ 100 ETF (QQEW) also cracked the top tier. E&P had a good week despite mediocre oil price action.
A notable pocket of weakness was Regional Banks (KRE) on the bottom with the broader Financials ETF (XLF) also in the bottom tier with Midcaps (MDY) and Small Caps (RUT). We see 6 of 7 bond ETFs in positive range.
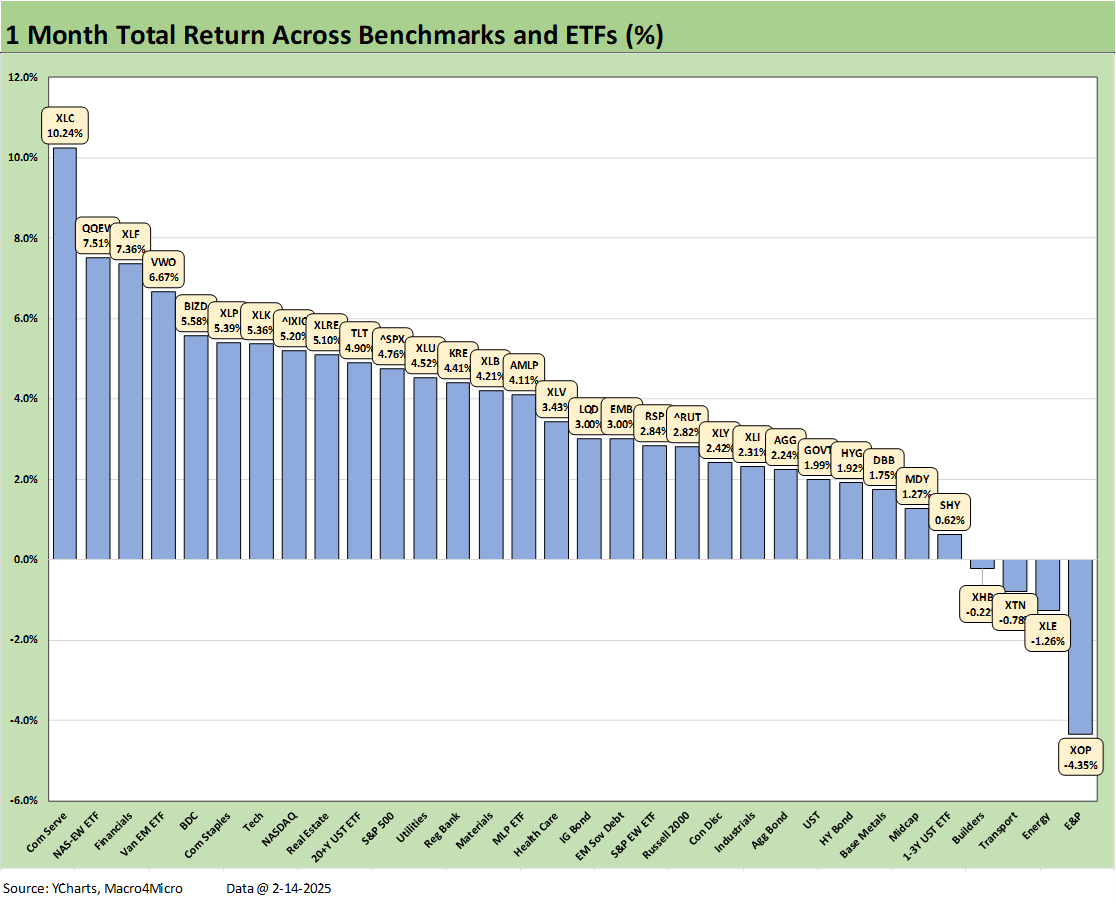
The 1-month scoresheet of 28-4 tells a favorable story with the negatives comprised of E&P (XOP), Energy (XLE), Transports (XTN) and Homebuilders (XHB). Duration has been a solid performer for the past month after a rough start to the year and choppy performance since the Sept lows. The long duration UST 20+ Year ETF (TLT) leads the bond ETFs near the top of the second quartile with IG Corporate a more distant #2 for the bond group at the top of the third quartile.
The winners were tech heavy at 4 of the 8 with Communications Services (XLC) at #1 and the Equal Weight NASDAQ 100 (QQEW) at #2, Tech (XLK) at #7 and NASDAQ at #8. Also cracking the top tier were Financials (XLF) and the high-income BDC ETF (BIZD). The recent UST rally and cyclical confusion with tariffs likely to have lifted the defensive Consumer Staples ETF (XLP) into the top quartile along with EM Equities (VWO), which is often wagged by the UST curve.
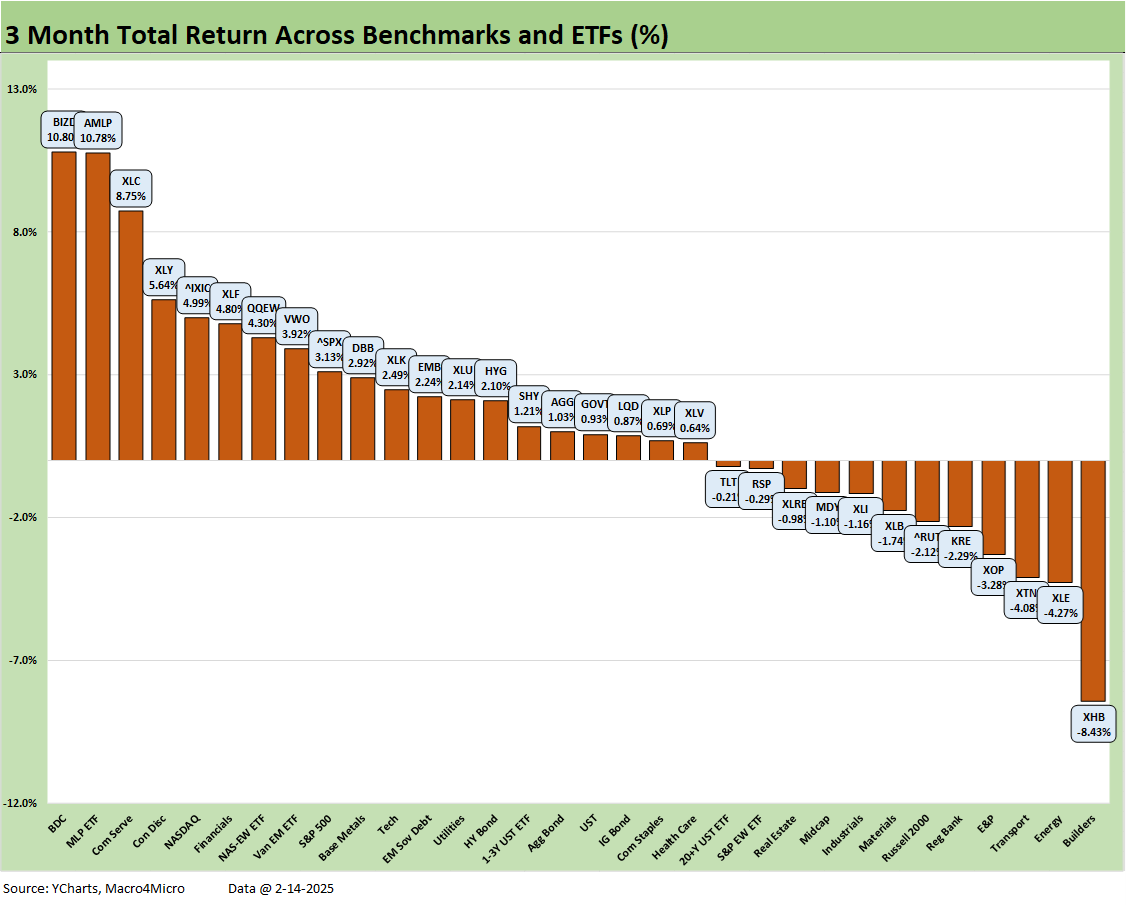
The 3-monh scoresheet is the most balanced but still heavily positive at 20-12. The Homebuilder ETF (XHB) sits on the bottom on higher mortgage rates that came after the amazing run to high homebuilder equity valuations through 3Q24. The high-water mark for builders came shortly after the 3.6% lows on the 10Y UST in Sept and the near 6% 30Y Freddie Mac benchmark. Energy (XLE) and E&P (XOP) also continue to lag along with Transports (XTN).
We see notable #1 and #2 in the high-income ETFs of BDCs (BIZD) at #1 and Midstream Energy (AMLP) at #2. We then see 4 of the next 5 as more Mag 7 and tech influenced with Communications Services (XLC), Consumer Discretionary (XLY), NASDAQ, and Equal Weight NASDAQ 100 (QQEW) in the mix with Financials (XLF) breaking up that tech group.
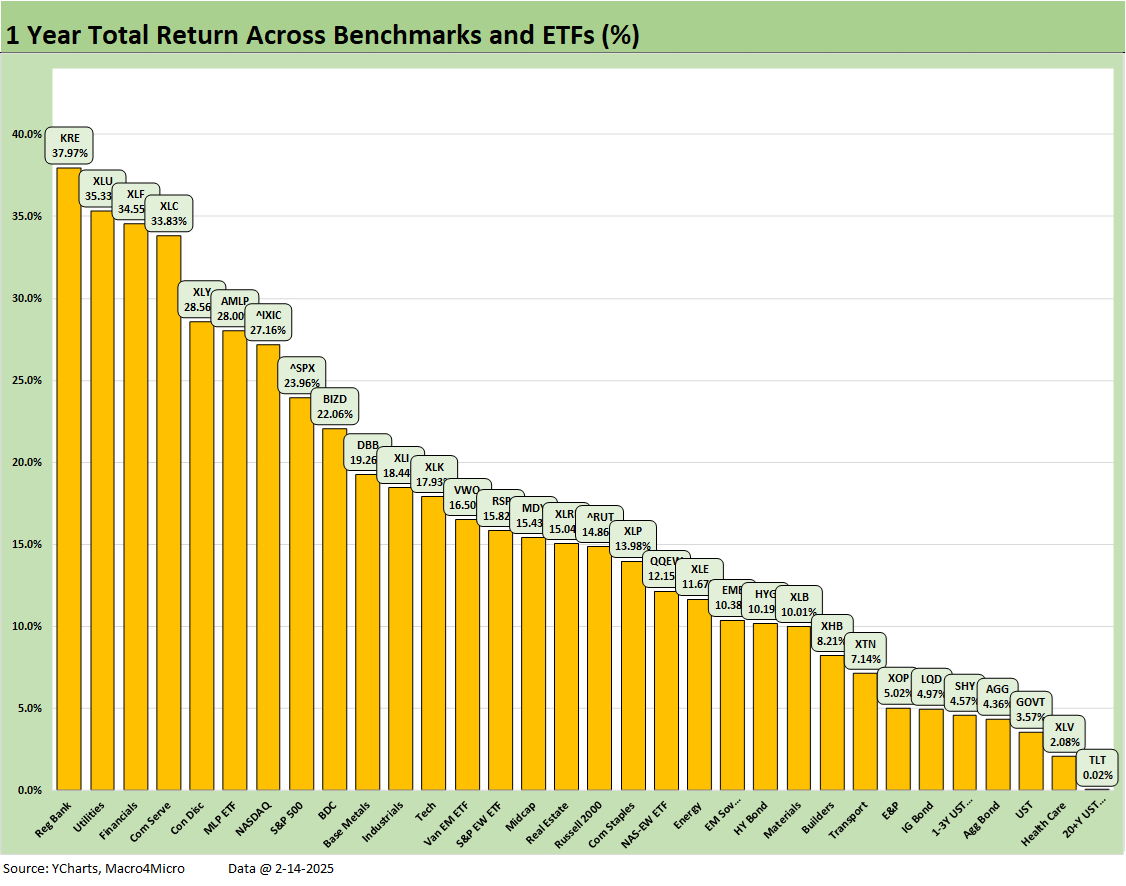
The trailing 1-year mix is now at 32-0 as the long-duration UST 20+Y ETF (TLT) breaks into the lineup at very slightly positive. We see 5 of 8 in the bottom quartile are bond ETFs joined by Health Care (XLV), E&P (XOP), and Transports (XTN).
Given the dominance of tech stories the past year, it is notable that the top 3 performers are outside tech with Regional Banks (KRE) at #1, Utilities (XLU) at #2, and Financials (XLF) at #3 before the tech and Mag 7 heavy lineup with Communications Services (XLC), Consumer Discretionary (XLY), NASDAQ, and the S&P 500.
The high-income Midstream Energy (AMLP) in the top tier offers a reminder of the value of high dividend rates and also a sector with favorable fundamentals and lower volatility than other major energy ETFs. On that high dividend note, BIZD was at the top of the second quartile.
See also:
Mini Market Lookback: Headline Frenzy, Sloppy Details 2-15-25
Iron Mountain 4Q24: Performance Bar Gets Raised 2-15-25
Retail Sales Jan 2025: Warning Sign or Holiday Hangover? 2-14-25
Industrial Production Jan 2025: Capacity Utilization 2-14-25
CPI Jan 2025: Getting Frothy Out There 2-12-25
Footnotes & Flashbacks: Credit Markets 2-10-25
Footnotes & Flashbacks: State of Yields 2-9-25
Footnotes & Flashbacks: Asset Returns 2-9-25
Mini Market Lookback: Simply Resistible! 2-8-25
Mini Market Lookback: Surreal Week, AI Worries about “A” 2-1-25
4Q24 GDP: Into the Investment Weeds 1-30-25
4Q24 GDP: Inventory Liquidation Rules 1-30-25
Credit Crib Note: Lennar Corp 1-30-25
D.R. Horton: #1 Homebuilder as a Sector Proxy 1-28-25
Durable Goods Dec 2024: Respectable ex-Transport Numbers 1-28-25
New Home Sales Dec 2024: Decent Finish, Strange Year 1-28-25
Tariff links:
Reciprocal Tariffs: Weird Science 2-14-25
US-EU Trade: The Final Import/Export Mix 2024 2-11-25
Aluminum and Steel Tariffs: The Target is Canada 2-10-25
US-Mexico Trade: Import/Export Mix for 2024 2-10-25
Trade Exposure: US-Canada Import/Export Mix 2024 2-7-25
US Trade with the World: Import and Export Mix 2-6-25
The Trade Picture: Facts to Respect, Topics to Ponder 2-6-25
Tariffs: Questions to Ponder, Part 1 2-2-25
US-Canada: Tariffs Now More than a Negotiating Tactic 1-9-25
Trade: Oct 2024 Flows, Tariff Countdown 12-5-24
Mexico: Tariffs as the Economic Alamo 11-26-24
Tariff: Target Updates – Canada 11-26-24
Tariffs: The EU Meets the New World…Again…Maybe 10-29-24
Trump, Trade, and Tariffs: Northern Exposure, Canada Risk 10-25-24
Trump at Economic Club of Chicago: Thoughts on Autos 10-17-24
Facts Matter: China Syndrome on Trade 9-10-24