
Footnotes & Flashbacks: Asset Returns 2-9-25
We look at a balanced week for asset returns despite the “flood the zone” policy pyrotechnics in the headlines.


And now…for today’s White House policy plan…Gaza will merge with Greenland!
The week saw a duration rally, Mag 7 weighted toward negative returns, the 32 benchmarks/ETFs we track weighing in at 17-15, and a 6-5 positive to negative score on the S&P 500 sectors. The S&P 500, NASDAQ, Russell 2000 and Dow were all negative. HY and IG spreads barely moved with the long duration UST ETF (TLT) a big winner (see Mini Market Lookback: Simply Resistible! 2-8-25).
The 25% USMCA gambit was put on the 30-day front burner (heat on high), China tariffs are underway, and a flashback to the reciprocal tariff plan of 2019 is on the agenda next with EU in the crosshairs.
Consumer inflation expectations soared in the latest UMichigan consumer sentiment survey, but any outcomes in the market (vs. subjective consumer expectations) await some clarity on tectonic policy decisions in trade, more visibility in deportation, and some critical legislation such as the debt ceiling, tax bill, budget deficits, and which campaign promises will be left on the cutting room floor (it will be a big recycle pile).
Meanwhile, Trump stuck with his forced relocation idea for Gaza and his Master Planned Community and resort vision. That gambit is in line with his frictionless wheel approach to tariffs (no economic costs to the US and risk free).

The debt and equity benchmarks we update each week came up all positive again for the 1-month time horizon. Duration was the clear winner on the week as we detail further below in the recap of the 32 benchmarks and ETFs.
The 3-month returns saw one less negative in the debt asset classes as UST flipped to positive. In equities, which were all positive for the 3-month time horizon last week, we saw two lines fall into negative range with the Russell 2000 dropping into the red along with the Russell 3000 Value index.
The rolling return visual
In the next section, we get into the details of the 32 ETFs and benchmarks for a mix of the trailing periods. Below we offer a condensed 4-chart view for an easy visual on how the mix of positive vs. negative returns shape up. This is a useful exercise we do each week looking for signals across industry groups and asset classes.

The symmetry of returns above for 1-week and 3-months have some similarities but the 1-month pattern seems to ebb and flow around UST sentiment and policy uncertainties and the deadlines wrapped around the not-so-Day-1 timing. Credit fundamentals are healthy, the earnings season and related guidance is solid on average even if guidance has a tendency to come with asterisks that are big enough to show up on satellites (tariffs, the curve/mortgage rates, legislative risk, geopolitics, oil prices, etc.)
A bullish January after a weak December now sends us further into a month of February with a very divided Washington and the tendency to see headline domination/fixation/trepidation for reasons that are easy to explain if you have a dark view of the world. Rationalizing such erratic policy headlines (and behavior) gets laid off under the heading of “tactics” and “negotiations.” The theme of “it is just negotiation tactics” to explain the inconsistent and conflicting policies (e.g., punitive vs. reciprocal tariffs) hearken back to the Big Chill and the question of whether anyone has gone a day without a rationalization.
I like to read the foreign press for flavor (especially Canada) and the flavor is not one of optimism around trade relations and for obvious reasons. Domestic political environments are worsening and the pressure to fight back runs high. That will be mirrored in the EU.
The Magnificent 7 heavy ETFs…
Some of the benchmarks and industry ETFs we include have issuer concentration elements that leave them wagged by a few names. When looking across some of the bellwether industry and subsector ETFs in the rankings, it is good to keep in mind which narrow ETFs (vs. broad market benchmarks) get wagged more by the “Magnificent 7” including Consumer Discretionary (XLY) with Amazon and Tesla, Tech (XLK) with Microsoft, Apple, and NVIDIA, and Communications Services (XLC) with Alphabet and Meta.

We looked at this tech bellwether mix already in the Mini Market Lookback: Simply Resistible! (2-8-25). With 6 of the Mag 7 having reported earnings, we have been seeing material dispersion of performance across the past week and month. We see 5 of the Mag 7 posting negative returns for the 1-month period.
For 3 months we see 4 of 7 with negative or low single digit returns. For the 3-month period, the S&P 500 is slightly positive at +1.2% with the Equal Weight S&P 500 ETF (RSP) slightly negative at -1.2% with the NASDAQ also showing a +1% handle return. We look at more time horizon comps further below.
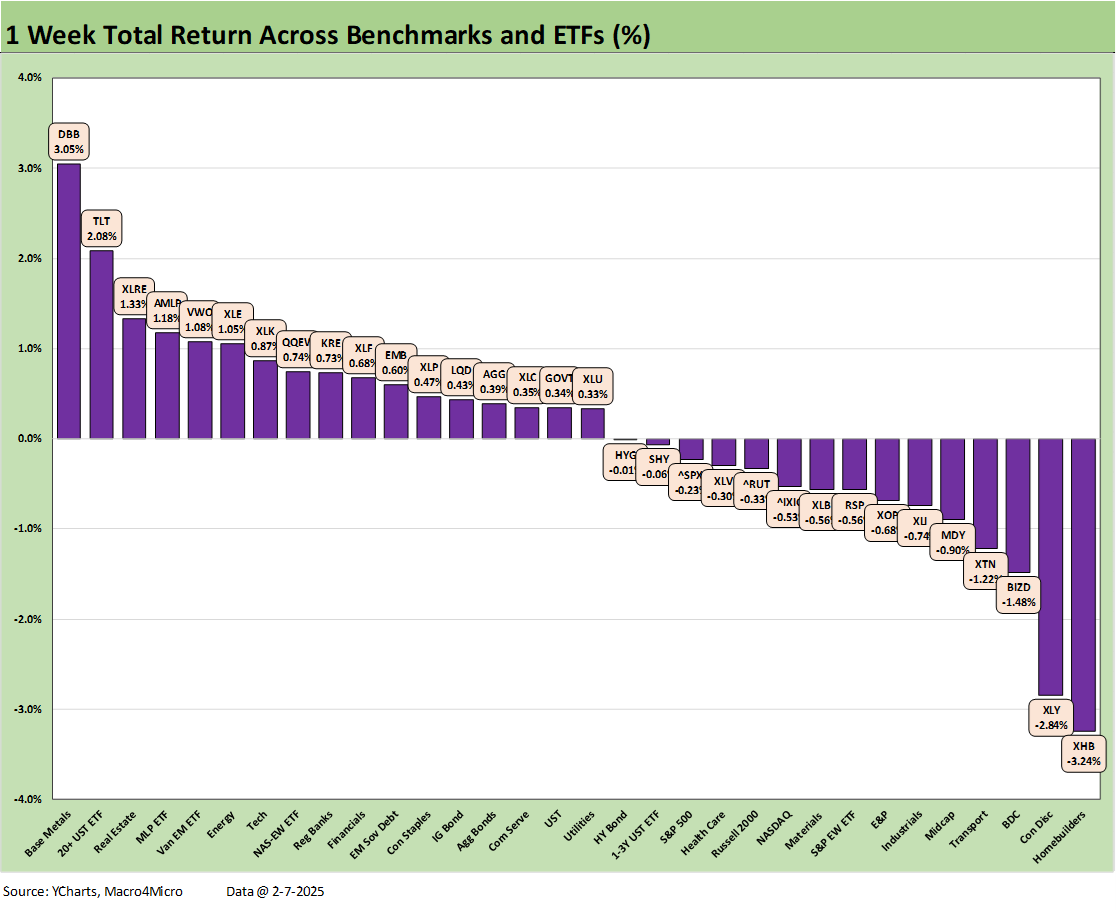
As noted earlier and in the Mini Market Lookback: Simply Resistible! (2-8-25), the 17-15 score for the week was decidedly mixed with the bond ETFs posting positive returns in 5 of 7 with HY ETF (HYG) and Short Duration UST 1Y-3Y (SHY) very slightly in the red.

The solid 1-month time horizon from a good January rang up a 29-3 score with an interesting mix in the red zone across E&P (XOP) on the bottom. We see Transports (XTN) and Tech ETF (XLK) slightly in the red zone. Financials are rolling along with Regional Banks (KRE) at #1 and the broader Financials ETF (XLF) at #3 with the income-heavy Midstream Energy (AMLP) at #2.
The 1-month period has the long duration UST ETF (TLT) in the top quartile. The income-heavy BDC ETF (BIZD) is across the line at the top of the second quartile. BDCs will be a group to watch this year with mixed reviews of private credit asset risk but also given the ability for retail investors to seek out 10% area dividend rates. We are a fan of the asset class and the BDC names with the caveat that there has been and is likely to continue to be material divergence in performance across managers. The income portion of total return in this asset line leaves room for mistakes.
The bottom quartile includes small caps (Russell 2000) and large cap benchmarks such as NASDAQ. The S&P 500 placed in the third quartile while the Equal Weight S&P 500 (RSP) ranked in the second quartile.

As noted earlier, the 3-month time horizon was mixed on erratic UST curve action since the Sept lows. We will look at the State of Yields in our separate Footnotes publication, but the UST has rallied from the recent sell-off with 5 of 7 bond ETFs in the second quartile and only duration-heavy IG Corporate (LQD) and the long-duration UST ETF (TLT) just across the line in the third quartile.
The two biggest losers over 3 months and since the 3.6% lows on the 10Y UST and 6.0% area in 30Y mortgages in late Sept have been the Homebuilder ETF (XHB) and Materials ETF (XLB). XHB is easier to explain based on mortgage fatigue and the amazing run of homebuilder-related equities through the end of Sept. The concerns around valuation and mortgage payment affordability have been a headwind, but new homes have trumped existing home sales for many reasons covered in our housing sector and single name work.
The Materials ETF (XLB) is heavy on chemicals, aggregates, and some metal players in the top holdings, so the connection to the construction markets is strong. There are more global commodities and cross-border trade elements in XLB than in XHB, so materials will be one to watch as the tariff drama and potential currency whipsaws unfold on Trump’s eventual decisions.
It is our hope someday to hear the words “buyer pays the tariff” come out of Trump’s mouth. Growing up as a Red Sox fan, one can get used to long waits. (In 1967, I was in the right field bleachers in Game 2 of the World Series with Roger Maris in right field for the Cardinals.)
The last 3 months voted “thumbs down” on XLB. The potential policy impact on such cyclically sensitive markets could be severe in a global trade war. If we look back a year (see next chart), the Materials ETF (XLB) is at the upper end of the bottom quartile.

The trailing 1-year is still holding in at 31-1 on a very strong second year for the equity markets and the UST curve moving in the right direction since the Oct 2023 peak (and monster rally in Nov-Dec 2023). The long duration UST 20+Y ETF (TLT) is alone in the red over the past year at -1.7%. TLT is at a +13.8% total return since the 10-19-23 UST 10Y peak.
The trailing 1-year winner is the Regional Bank ETF (KRE) at #1 followed by Financials (XLF) at #2 and then an orderly series of steps with Utilities (XLU) at #3, Communications Services (XLC) at #4, and the income heavy Midstream Energy ETF (AMLP) at #5. That is a supportive mix of industry groups. The mix gets a little more Mag 7 heavy in influence in the next tier as we see Consumer Discretionary (XLY), NASDAQ, and the S&P 500 rounding out the top quartile.
The bottom quartile includes 5 bond ETFs joined by the pharma heavy Health Care ETF (XLV), E&P (XOP), and Materials (XLB).
See also:
Mini Market Lookback: Simply Resistible! 2-8-25
Payroll Jan 2025: Into the Occupational Weeds 2-7-25
Payroll Jan 2025: Staying the Course, Supports FOMC Hold 2-7-25
Trade Exposure: US-Canada Import/Export Mix 2024 2-7-25
US Trade with the World: Import and Export Mix 2-6-25
The Trade Picture: Facts to Respect, Topics to Ponder 2-5-25
JOLTS Dec 2024: Before the Tariff JOLT Strikes 2-4-25
Footnotes & Flashbacks: Credit Markets 2-3-25
Footnotes & Flashbacks: State of Yields 2-2-25
Footnotes & Flashbacks: Asset Returns 2-2-25
Tariffs: Questions to Ponder, Part 1 2-2-25
Mini Market Lookback: Surreal Week, AI Worries about “A” 2-1-25
PCE: Inflation, Personal Income & Outlays 1-31-25
Employment Cost Index 4Q24: Labor Crossroad Dead Ahead 1-31-25
4Q24 GDP: Into the Investment Weeds 1-30-25
4Q24 GDP: Inventory Liquidation Rules 1-30-25
Credit Crib Note: Lennar Corp 1-30-25
D.R. Horton: #1 Homebuilder as a Sector Proxy 1-28-25
Durable Goods Dec 2024: Respectable ex-Transport Numbers 1-28-25
New Home Sales Dec 2024: Decent Finish, Strange Year 1-28-25