
Mini Market Lookback: Headline Frenzy, Sloppy Details
The market faced macro variable overload with unfavorable actions on steel and aluminum and mystery on “reciprocal” tariff execution.


Too much time at the tariff and geopolitical trough.
The list of what headline risks to handicap just keeps on growing, but the infill and details are drifting as blurry visibility still just points at a wide range of potential outcomes. The credit markets are in waiting mode at tight spread levels that are still in the compressed zones of past bubble periods.
The market had a favorable equity return week with minimal but slightly favorable moves along the the UST curve despite the frothy CPI numbers (see CPI Jan 2025: Getting Frothy Out There 2-12-25).
The S&P 500 saw 9 of 11 sectors post positive returns for the week while the 32 benchmarks we track weighed in at 26-6 positive.
The reciprocal tariff delay was read as favorable (even if just based on the delay), but there is a lot of risk under the hood in that concept the way it was presented by Trump (see Reciprocal Tariffs: Weird Science 2-14-25).

The above chart shows a solid 26-6 week for the various benchmarks, asset classes, and industry ETFs. The bond ETFs do not match perfectly with a theoretical bond, so we have 6 positive bond ETFs and one slightly negative (TLT). The financial sector took a week off from winning with Regional Banks (KRE) on the bottom and Financials (XLF) also in the bottom tier. Small Caps and Midcaps are on the lower end, so that is unfavorable with earnings season still rolling out. A substantial majority of large companies (around ¾ of S&P 500) have reported.
The winners on the week in the top tier saw a tech-heavy mix at half of the top quartile, but E&P (XOP) cracked into the lineup with BDCs (BIZD) and Materials (XLB) just ahead of Homebuilding ETF (XHB) as rates eased slightly.

The above chart updates the tech bellwether performances with the companies and benchmarks lined up in descending order of returns for the week. We see 3 of the Mag 7 names beating the NASDAQ, but the divergence across the names was less volatile than recent weeks. The other 4 of the Mag 7 were slightly negative and Tesla on the bottom for the week with a -10% 1-month return still not derailing a double-digit 3 months and +77% 6 months.

The above chart details a slightly favorable week for the yield curve with low single-digit moves lower out the UST curve at 5Y UST and beyond. The 30Y was essentially flat.
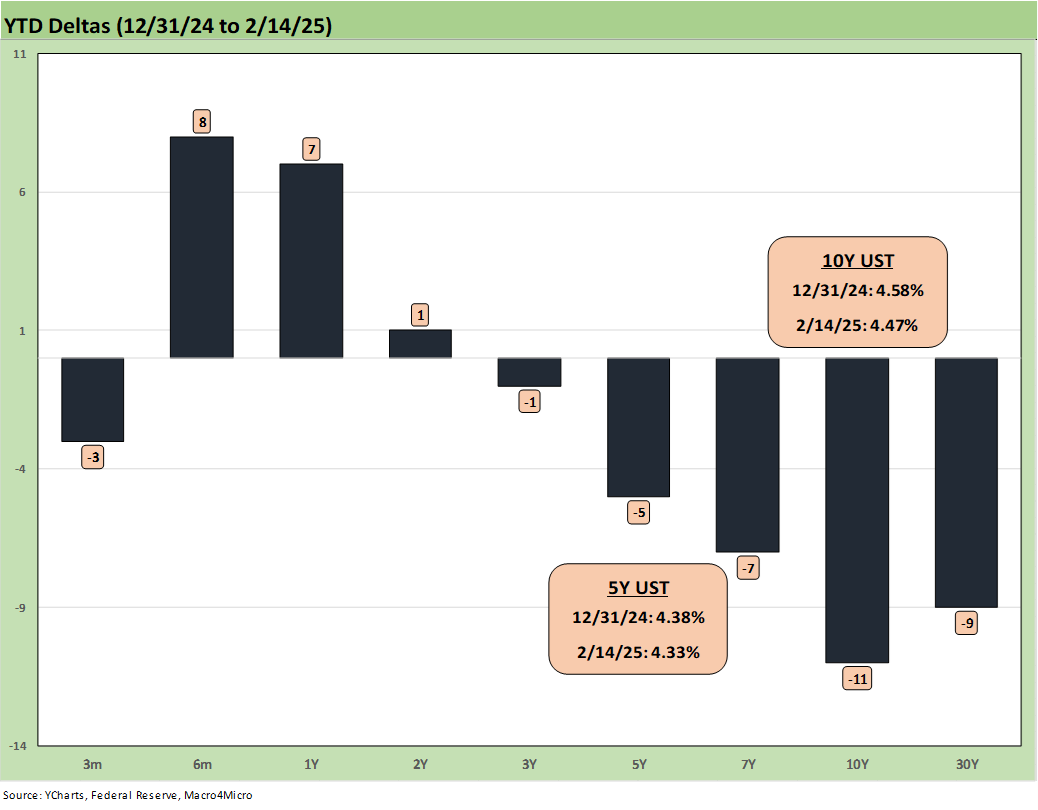
The YTD UST deltas show declines at 5Y and beyond while the front end shows the expectation of the Fed in no rush to ease. We get FOMC minutes this coming week.

The above chart updates the time series for the Freddie Mac 30Y mortgage vs. the10Y UST. There was only minor relief this past week on the 30Y vs. last week’s 6.89%. The 10Y UST bucked the unfriendly inflation metrics and notably the CPI setback (see CPI Jan 2025: Getting Frothy Out There 2-12-25). Retail sales (see Retail Sales Jan 2025: Warning Sign or Holiday Hangover? 2-14-25) and Industrial Production (see Industrial Production Jan 2025: Capacity Utilization 2-14-25) did not move the needle much either as evident in the UST deltas.

HY OAS was quiet relative to the high stakes around tariffs and the clock ticking on geopolitics. The -5 bps tightening keeps the June 2007 level spreads intact with the HY OAS of +262 bps closer to the June 2007 lows early in that month than those posted at the end of June 2007. As a reminder, HY OAS saw early June 2007 lows at +241 bps, but the moving parts saw June 2007 ending at +298 bps.

The HY OAS minus IG OAS differential ticked -1 bps tighter on the week in a minimal reaction to the headline swarm.

The “BB minus BBB” quality spread differential moved +1 bps wider in another low impact reaction.
See also:
Iron Mountain 4Q24: Performance Bar Gets Raised 2-15-25
Retail Sales Jan 2025: Warning Sign or Holiday Hangover? 2-14-25
Industrial Production Jan 2025: Capacity Utilization 2-14-25
CPI Jan 2025: Getting Frothy Out There 2-12-25
Footnotes & Flashbacks: Credit Markets 2-10-25
Footnotes & Flashbacks: State of Yields 2-9-25
Footnotes & Flashbacks: Asset Returns 2-9-25
Mini Market Lookback: Simply Resistible! 2-8-25
Mini Market Lookback: Surreal Week, AI Worries about “A” 2-1-25
4Q24 GDP: Into the Investment Weeds 1-30-25
4Q24 GDP: Inventory Liquidation Rules 1-30-25
Credit Crib Note: Lennar Corp 1-30-25
D.R. Horton: #1 Homebuilder as a Sector Proxy 1-28-25
Durable Goods Dec 2024: Respectable ex-Transport Numbers 1-28-25
New Home Sales Dec 2024: Decent Finish, Strange Year 1-28-25
Tariff links:
Reciprocal Tariffs: Weird Science 2-14-25
US-EU Trade: The Final Import/Export Mix 2024 2-11-25
Aluminum and Steel Tariffs: The Target is Canada 2-10-25
US-Mexico Trade: Import/Export Mix for 2024 2-10-25
Trade Exposure: US-Canada Import/Export Mix 2024 2-7-25
US Trade with the World: Import and Export Mix 2-6-25
The Trade Picture: Facts to Respect, Topics to Ponder 2-6-25
Tariffs: Questions to Ponder, Part 1 2-2-25
US-Canada: Tariffs Now More than a Negotiating Tactic 1-9-25
Trade: Oct 2024 Flows, Tariff Countdown 12-5-24
Mexico: Tariffs as the Economic Alamo 11-26-24
Tariff: Target Updates – Canada 11-26-24
Tariffs: The EU Meets the New World…Again…Maybe 10-29-24
Trump, Trade, and Tariffs: Northern Exposure, Canada Risk 10-25-24
Trump at Economic Club of Chicago: Thoughts on Autos 10-17-24
Facts Matter: China Syndrome on Trade 9-10-24