
Footnotes & Flashbacks: State of Yields 2-16-25
We look back at a quiet but slightly positive week for yields as the CPI number did not dominate the mix of noisy headlines.


You keep thinking Elon. That’s what you’re good at…
The purging policy and ad hoc tariff planning and lack of transparent analysis (or even a semblance of due diligence) on the potential effects of the tariff binge across different product lines and critical supplier chains could come back to haunt inflation and the UST curve.
The UST action has been relatively quiet to this point in 2025 after a rough finish to 2024 when the UST call from Dec 2023 did not work out the way the consensus started the year.
We revisit this past week’s running UST delta trends below as the UST has rallied on the long end YTD while still showing a bear steepener since the mid-Sept FOMC easing.
Sometimes when someone is juggling a bundle of major risks that they think they have all figured out, I think back to the final scene in Butch Cassidy and the Sundance Kid (pictured above). This seems to be one of those times. The market is juggling so many major macro risk factors (inflation risk tied to tariffs and deportation, potential flight-to-quality tied to cycles and geopolitics) and micro issues (tariff impacts by industry with aluminum and steel, lumber, and perhaps the whole Mexico and Canada supplier chain to start). China is a systemic supplier risk while EU is the #1 trade partner as a bloc.
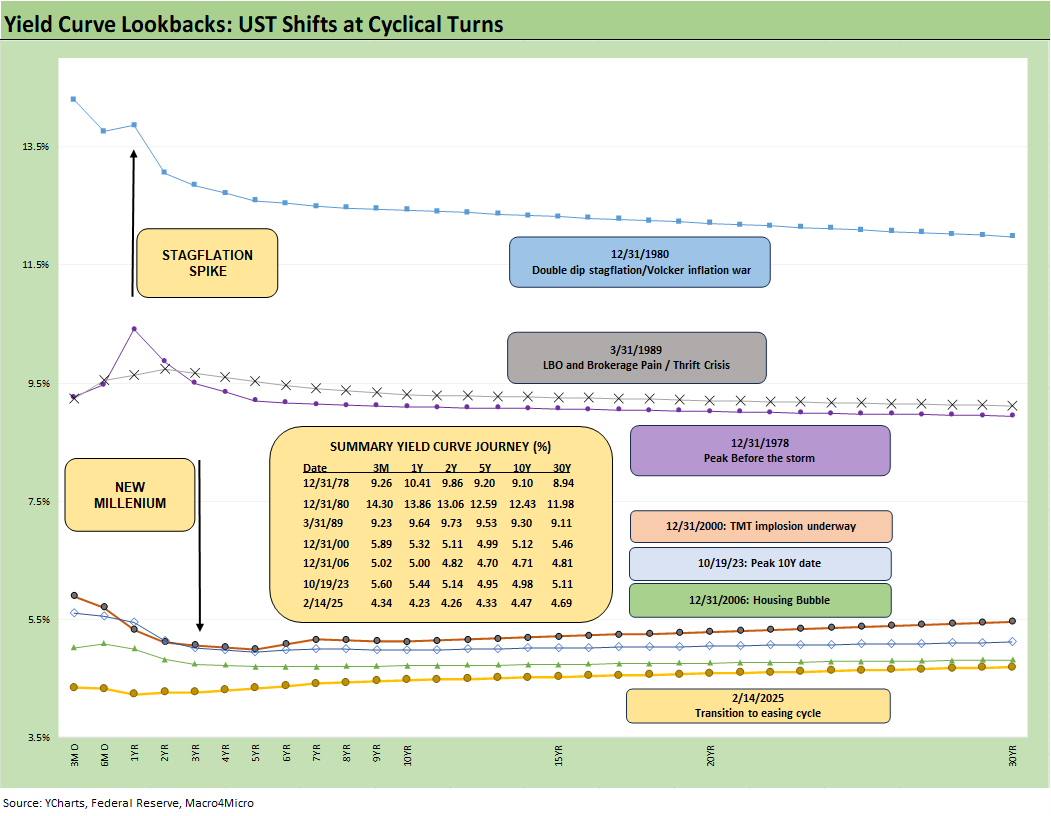
The above chart updates the UST curve migration across some notable economic and credit market cyclical turning points since the late 1970s. There were some very eventful periods in that mix of timelines we have discussed in other commentaries. None of them rival the moving parts we see today on a global scale and in domestic policy turmoil. Trump’s historical challenges have more in common with FDR, Truman, Johnson, and Nixon. Most anyone would see that group as fighting above Trump’s weight class unless you wear a funny red hat and only watch one channel (i.e. don’t read).
The US does have a full dance card right now. Rising trade war risk on multiple fronts (with the 4 largest trade partners) comes on top of a geopolitical backdrop that spans the Middle East (ethnic cleansing and Gaza seizure by the US where Trump simply says “we have it”). That is a throwback to seizing Texas from Mexico. Texas was worth the effort and risk. Then we have Russia-Ukraine (cut out NATO and get in bed with Putin on Ukraine?), seizing the Panama Canal to control freight traffic, and then annexing Greenland from a NATO ally who is part of a potential EU trade war. We will skip Canada as the 51st state since the odds of that happening round up to zero (see US-Canada: Tariffs Now More than a Negotiating Tactic 1-9-25).
We keep adding to the list. We are now going retro 1940 America First on Germany as JD Vance is putting his thumb on the scale in his European speeches this past week for the right wing German party Alternative for Germany (AfD). When political opponents in the US toss around the term “Nazi” and “Fascist,” Plan A should not be to give those labels a strong tailwind with a few extra sails – with a German right wing extremist party no less! At least stick with Hungary and Orban. Most people here don’t give a “hoot” (substitute other words at will) about Hungary. After all, many of us grew up with Hogan’s Heroes and had the honor to interact with the Greatest Generation members who fought fascists in Europe and Asia. They were a special breed. Some of us also got to know those who went to Vietnam (Trump dodged it … of course).
The headlines are so busy there has not been much discussion of Taiwan-China issues that have been lurking since my father enlisted in the Marines to fight in Korea. Busy times. That is a linchpin for the technology supplier chain of many industries and more narrowly is the aorta of semiconductors. Hopefully the policy roulette is not saving “the worst for last.”
Raw materials start the process… goods and supplier chain breakdown next?
There are major risks along the raw materials chain with the current plans on steel and aluminum. We also see the potential for an additional spike in lumber cost during an affordable housing crisis with lumber tariffs potentially in the 40% range (see Aluminum and Steel Tariffs: The Target is Canada 2-10-25 and tariff links at the bottom). There is much to sort out once the decisions on Mexico and Canada unfold, the trade skirmishes with China potentially escalate, and the EU bureaucracy weighs in. Then bring on the rest of the reciprocal tariff game plan.
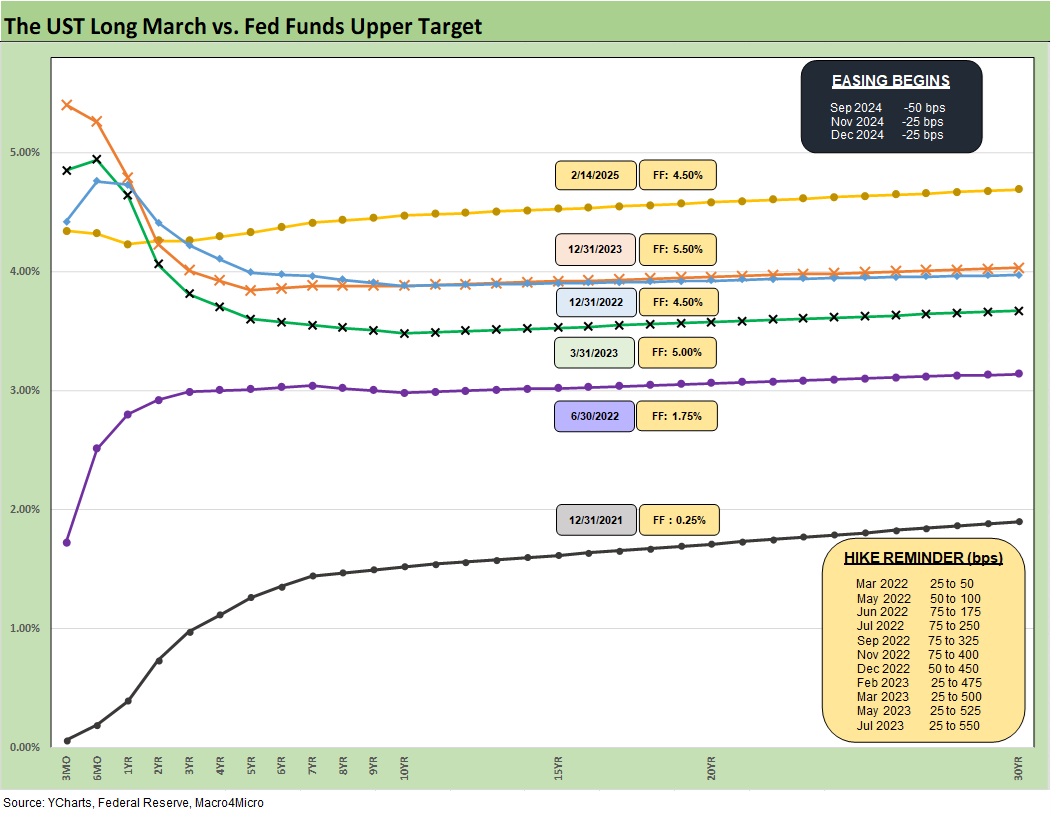
The above chart updates the UST migration across the tightening cycle. The UST curve is higher and steeper now, and the recurring challenge the market faces is gauging whether we move into a bull steepener on FOMC easing or a downward shift with the FOMC easing and the longer end of the UST curve moving lower on the better inflation numbers Trump has promised everyone.
Another scenario is whether we will see a fresh round of bear steepening as we did in 2024 with a more normalized slope on the UST curve. Further below, we update the UST slopes and medians with a focus on 3M to 10Y. The slopes are all well below medians and the UST curve is very low in multicycle context.
Trump and his GOP leaders in the House and Senate are trying to work through their magic acts in accounting to make 1 or 2 bills work with reconciliation. First, they need a debt ceiling or need to legislate it out of existence. That is the bridge to the topic of UST supply and what that will mean.
The great DOGE massacre of 2025 will not generate enough savings even if they have tumbleweeds rolling around the streets of DC. You can look at the non-defense Federal spending and it does not add up even if Musk opts for a Randian motive power meltdown in Federal functioning.
Meanwhile, anyone who reads aerospace or defense trade rags can get overwhelmed by the scale of weapons systems on the menu and the growing demands for space applications. Coming up with a lower defense budget as promised this past week by Trump seems not only impossible, but a material increase would appear to be in order when the Pentagon factors in the array of challenges in geopolitics these days. The fact that Defense is run by a totally inexperienced Fox morning show host adds to the challenge of getting sound advice to Trump.
New tax cuts are also on the table along with the extension of the old tax cuts. Those are topics for another day. A budget and debt ceiling will liven up this debate.
Our bottom line is we still put our chips down on a UST steepening. That is the same view we had last year. We had personally avoided duration like the plague. We would rather take credit risk and focus on higher coupons floating or fixed. As we cover in our separate Footnotes publication on asset returns, two ETFs with high yields, the BDC ETF (BIZD) and Midstream ETF (AMLP) performed well in the mix of 32 asset lines we track (see Footnotes & Flashbacks: Asset Returns 2-16-25). Regional Banks (KRE) and broad Financials (XLF) performed well also. Credit risk and floating rates were a common theme in some of those.
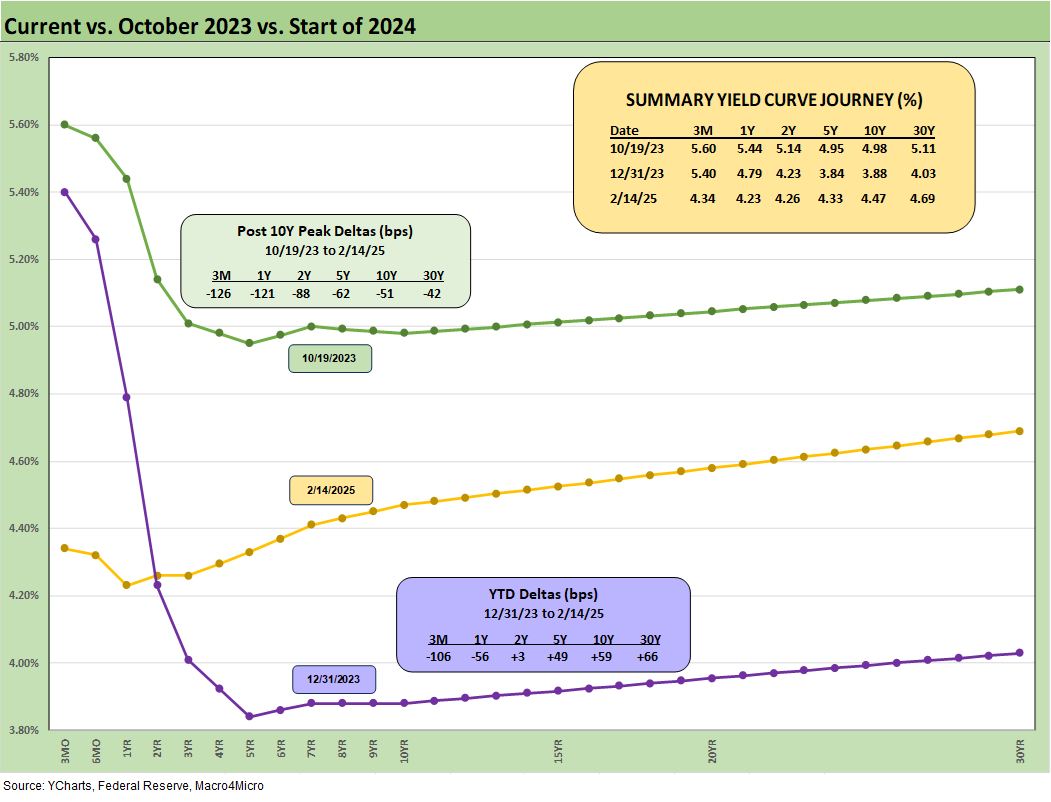
The above chart revisits the running deltas and UST shifts from the 10-19-23 peak and from the 12-31-23 data point ahead of what ended up as a year of bear steepening out the curve.
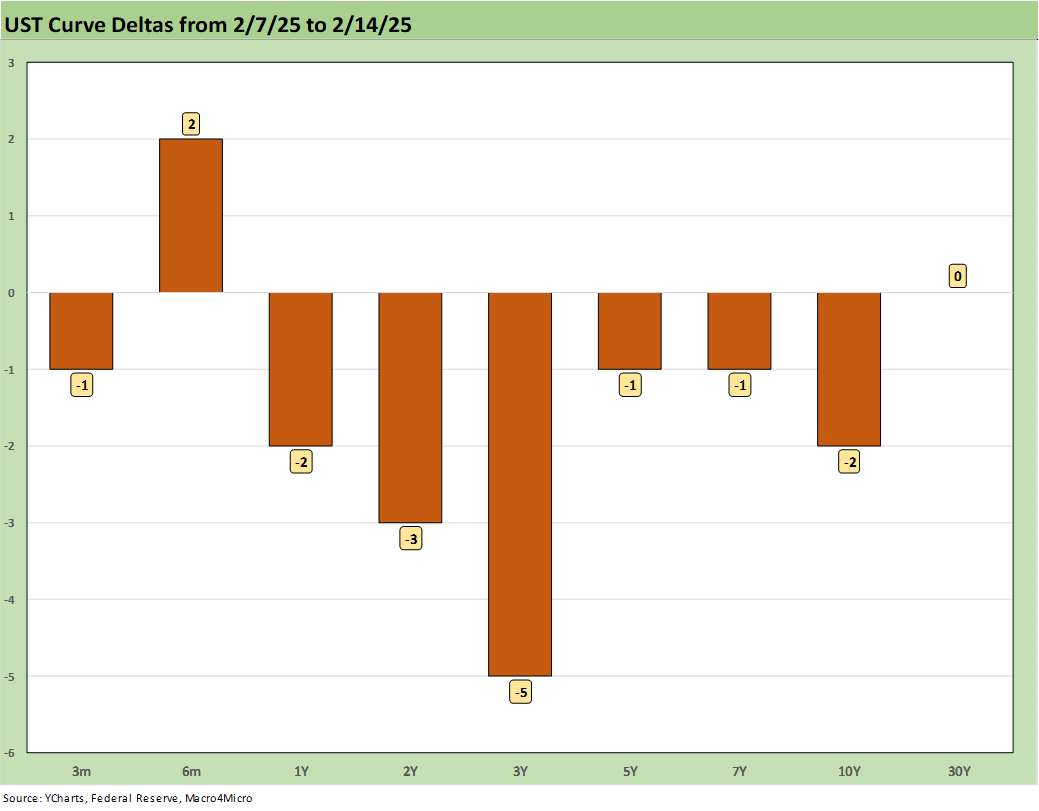
The 1-week moves in UST did not amount to much but was a relief for UST bulls after a challenging CPI number that ran on the hotter side of expectations (see CPI Jan 2025: Getting Frothy Out There 2-12-25).
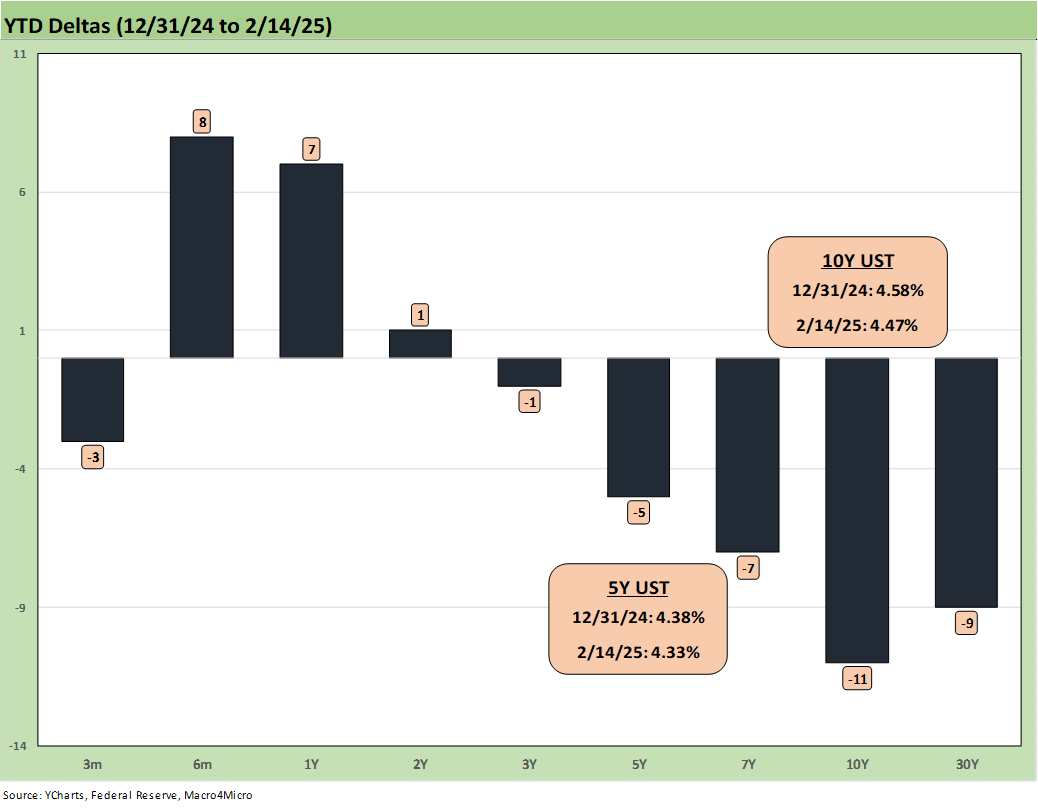
The YTD UST deltas have left the UST curve flatter than early January looking out toward the long end, but there are a lot of questions that still have to be answered around what the energy markets and tariff structures will look like.
The Russia-Ukraine terms hold great significance for oil prices that flow through into inflation. Russian oil back on the markets in scale would take energy related inflation lower. On the other hand, more problems in Ukraine could have the opposite effect. Oil is always a big swing factor in inflation both for the headline level and in core inflation metrics.
Meanwhile, tariffs of uncertain timing and magnitude have a lot to do with how much has to get recouped by services and goods providers that will see rising costs – by definition – in their businesses.
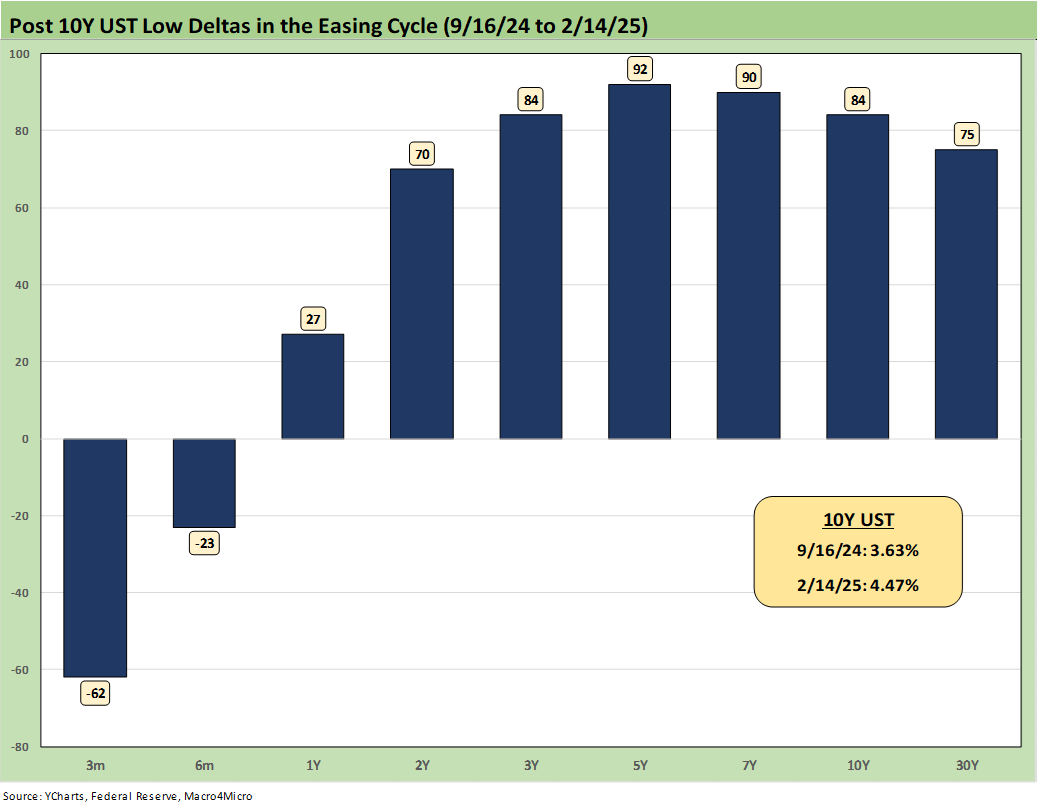
The above chart updates the running UST deltas from the Sept lows (9-16-24). We see the material bear steepener since that point. The bumpy ride for duration along the way has settled down in recent weeks.
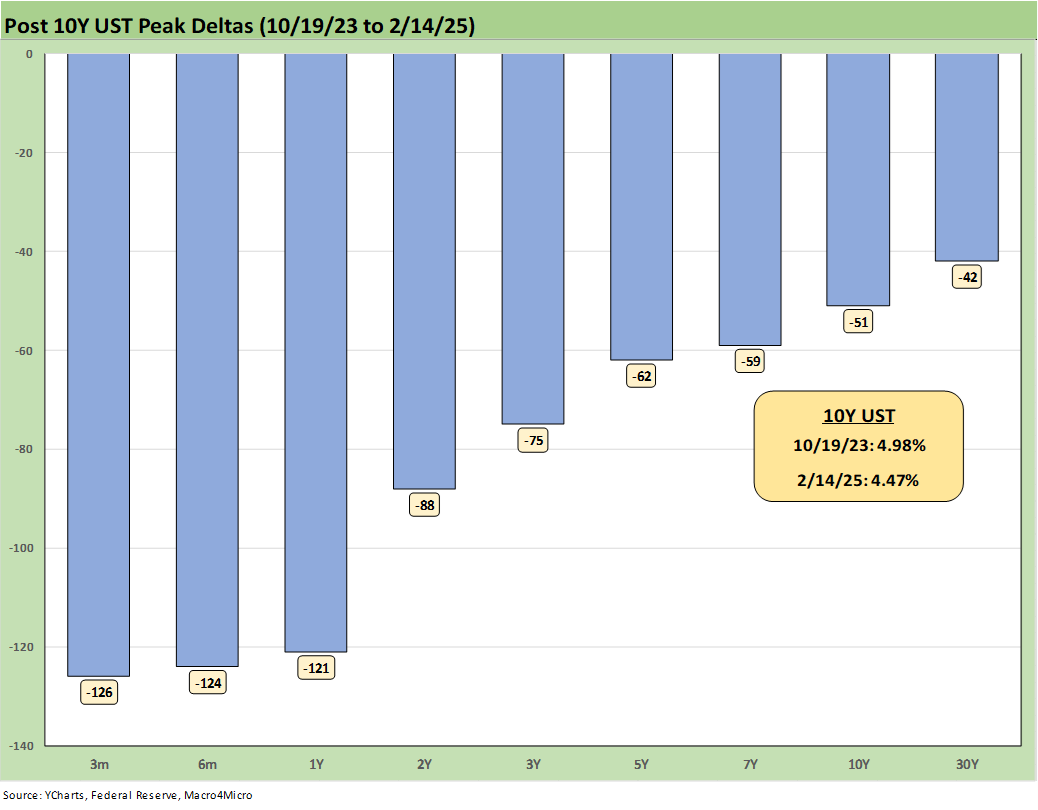
The above chart updates the bull steepener UST curve shift since the peak UST 10Y date of 10-19-23. The long end is still subject to a lot of new inputs around tariffs and potential labor dislocations as the FOMC has settled down into patient mode on further easing despite Trump’s demands for lower rates.
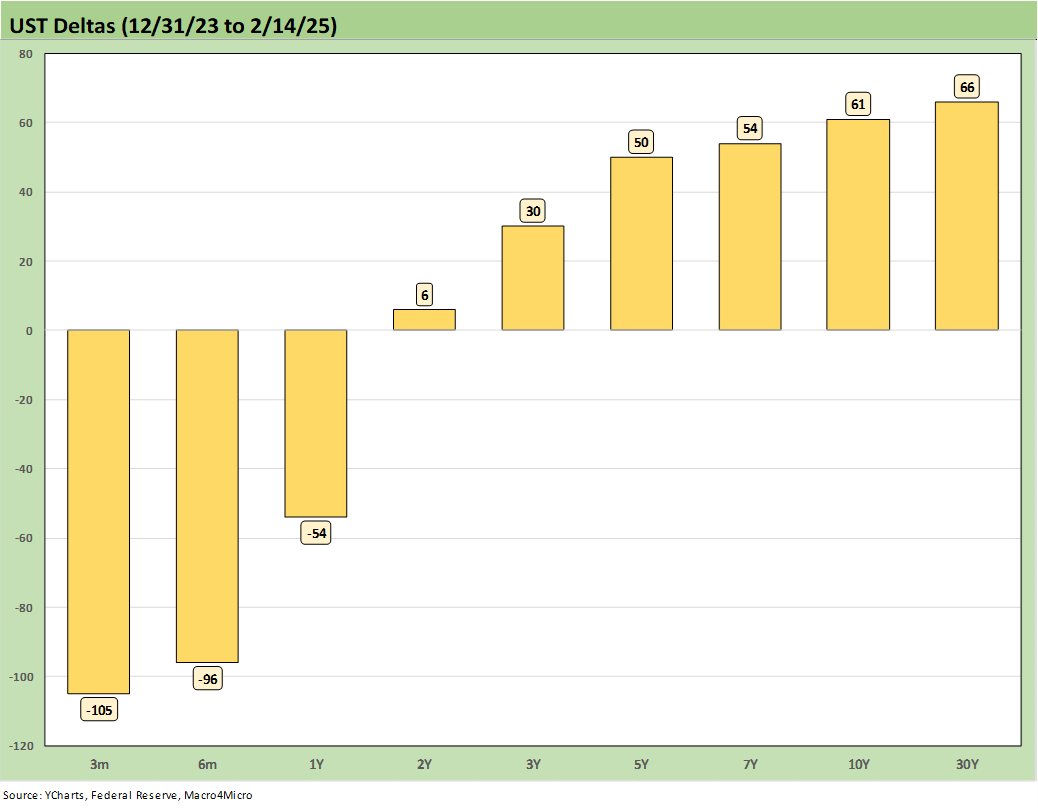
The above chart updates the US deltas from the start of 2024 after the massive rally for the curve and duration that unfolded in Nov-Dec 2023. The bear steepening out the curve has hurt duration since then despite a Sept 2024 rally as the FOMC kicked off the easing cycle into Dec 2024. The recent hold will restart the handicapping on the next ease.
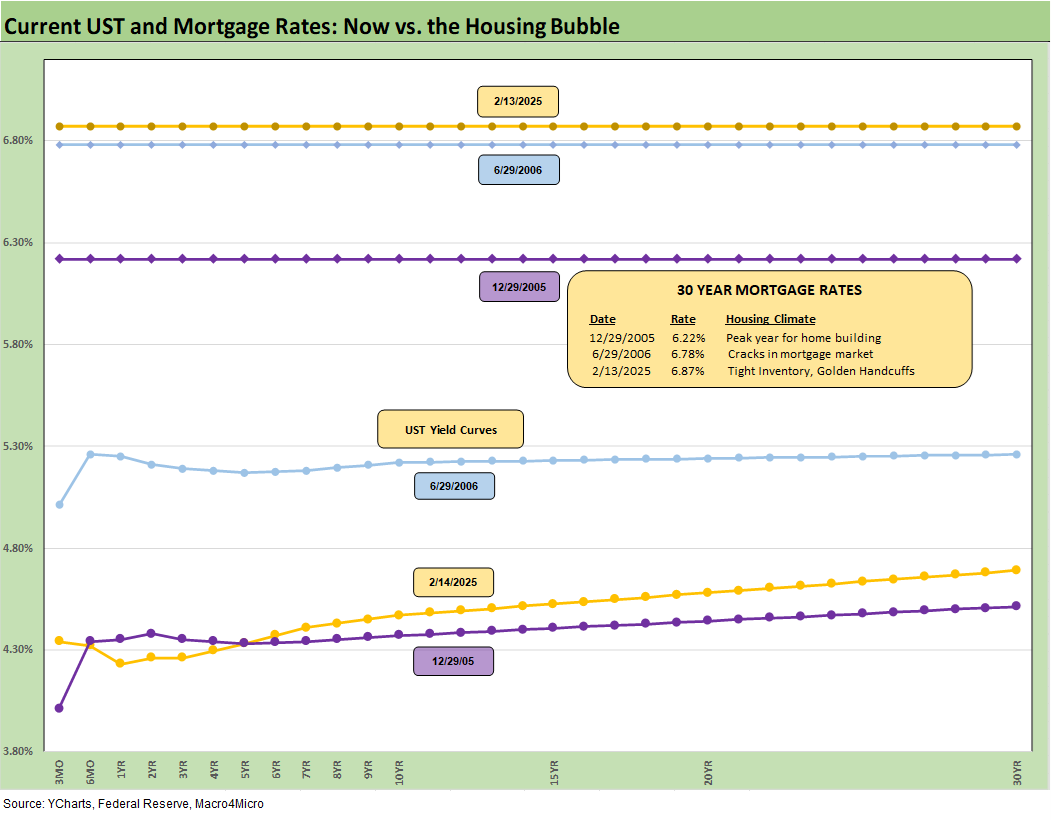
The above chart updates the recent yield curve and Freddie Mac 30Y benchmark (horizontal lines). We include two useful historical comps including the end of 2005 when homebuilding peaked and one for mid-2006 as excess RMBS origination was raising flags after record mortgage origination. We include the UST curves for each key date. Mortgage rates are higher now than 2006 despite the materially lower UST curve. The two dates are in a tight range of only 9 bps for 30Y mortgage rates.
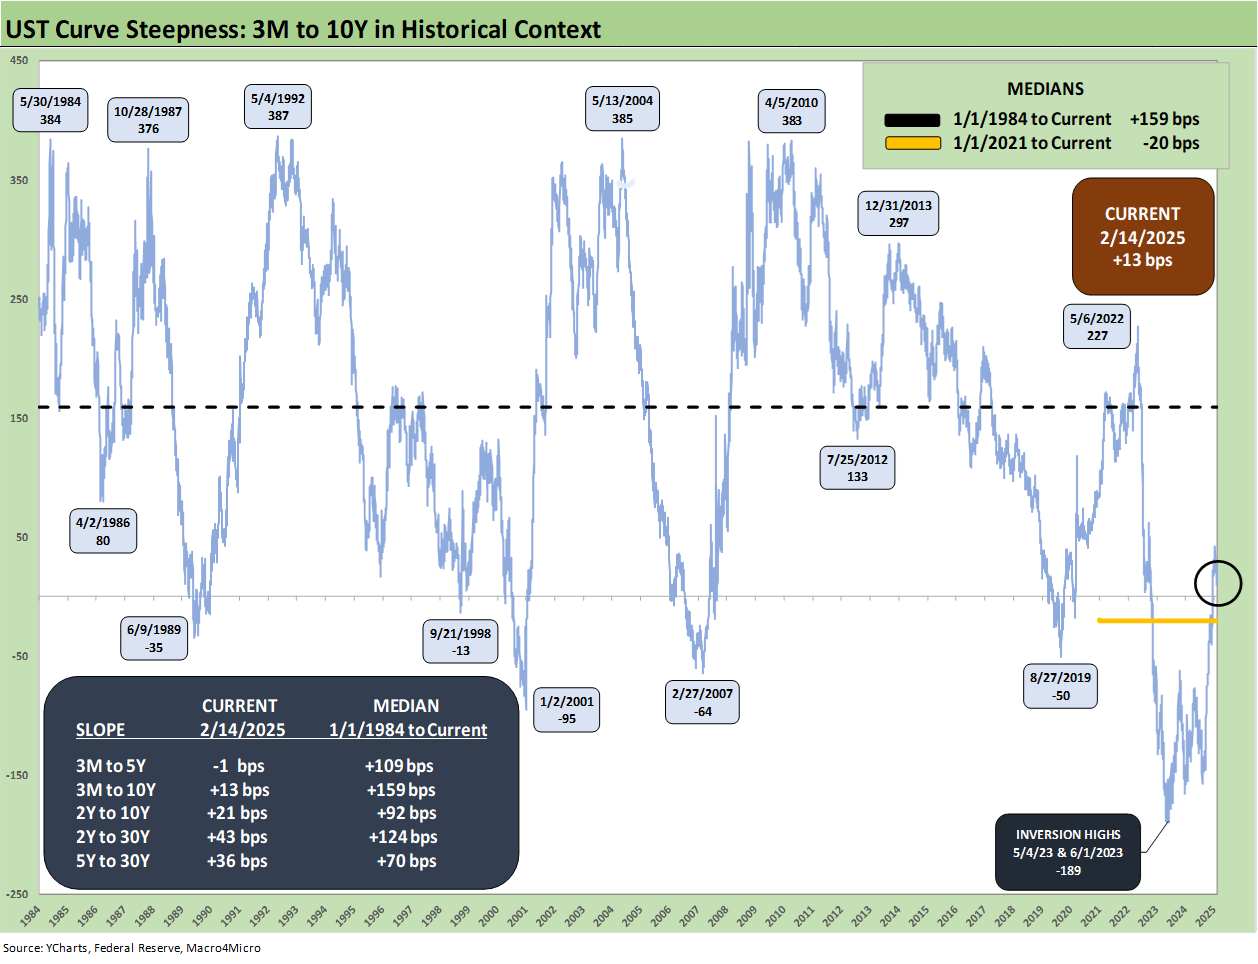
The 3M to 10Y UST slope history is updated above with only a slight upward slope of +13 bps vs. the long-term median of +159 bps. The likely slow, cautious hand of the FOMC from here can make a case for a return to a steeper UST curve from the short end and a stable or lower 10Y a hard one to bank on.
A UST bear would expect a return to more bear steepening from the long end as we saw in 2024. We could also see a minor ease on the front and a higher long end if you embrace the supply and inflation disappointment school from tariffs and labor. That is where we sit. If they blow up the cycle with their policies, then it is a matter of how they do it. Stagflation scenarios are easier to spin now.
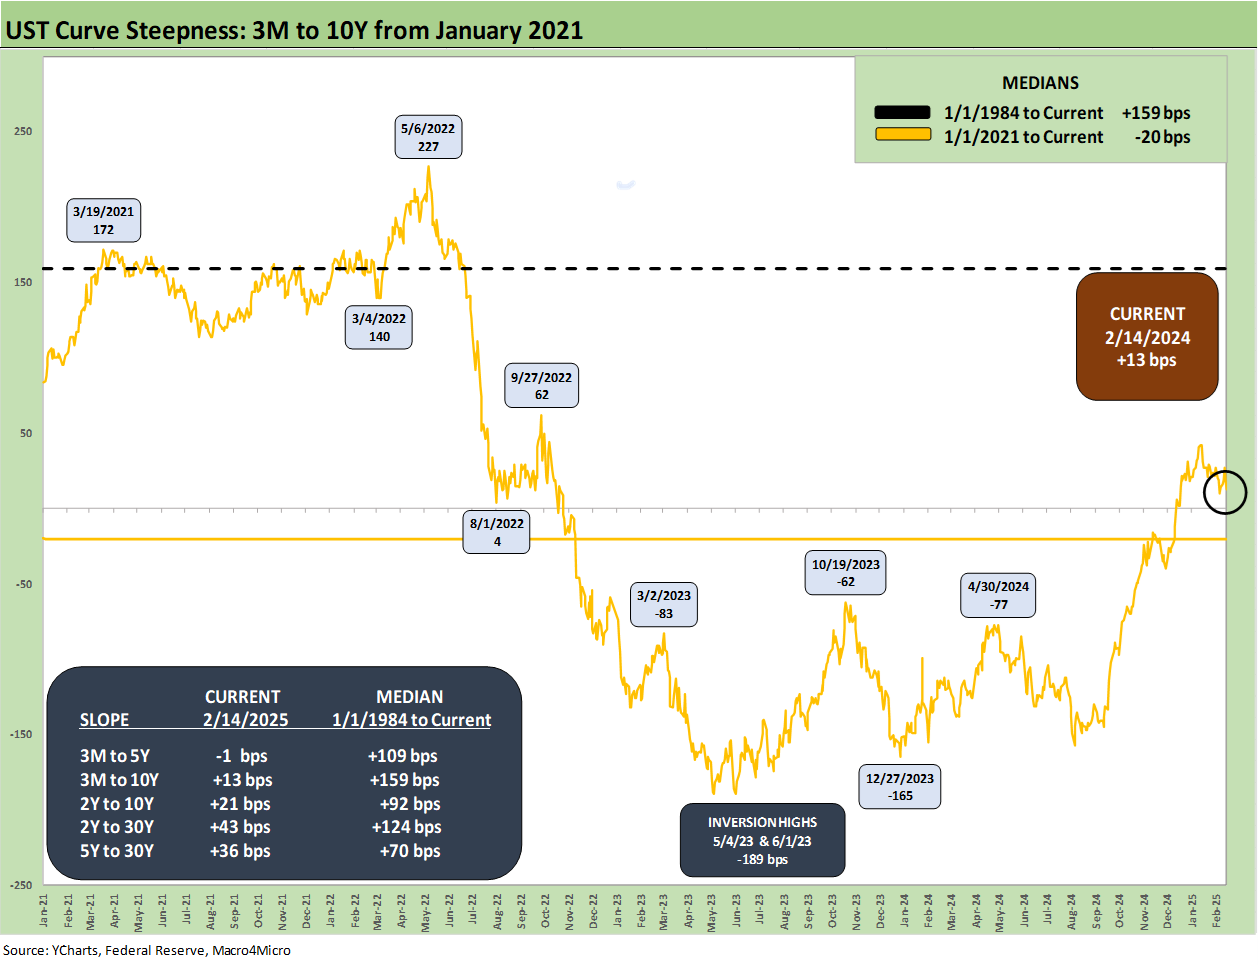
The above chart just shortens the timelines on the tightening cycle for better granular visuals on the moves. We see peak steepening to +227 bps in May 2022 and then a plunge to a peak inversion of -189 bps and then back to the current +13 bps.
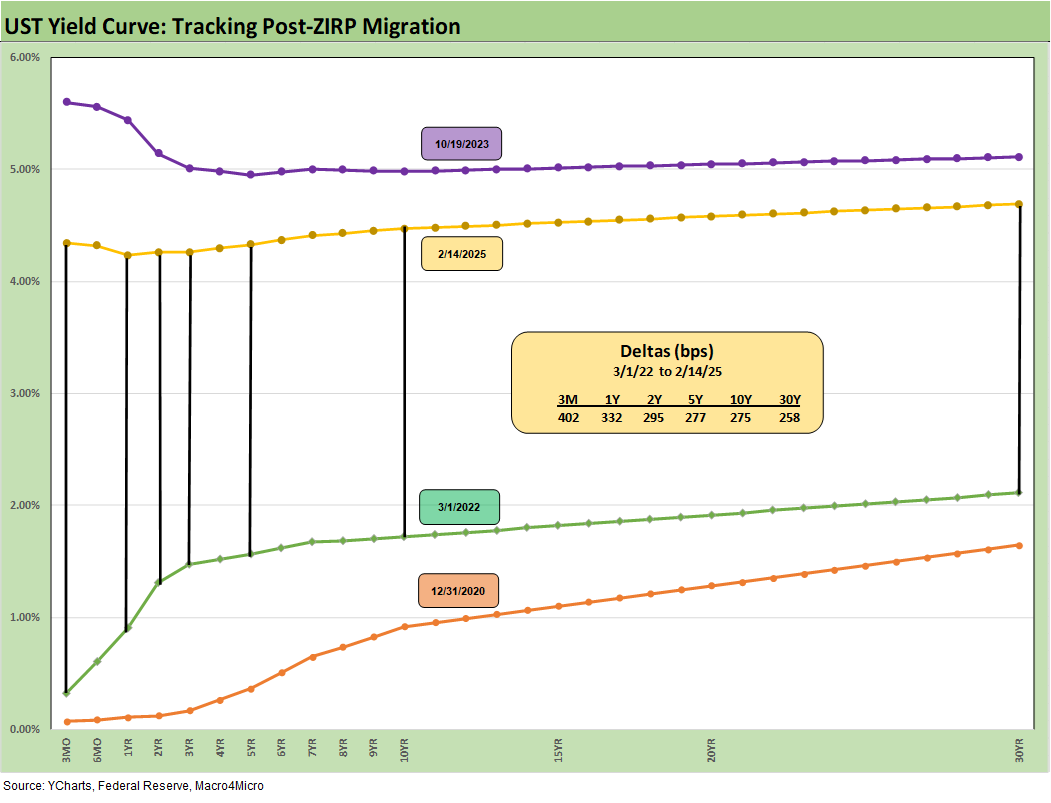
The journey of the UST migration from March 2022 to current times is updated above with the UST deltas from March 1, 2022 when ZIRP ended (effective 3-17-22). We also include the 10-19-23 peak date for the 10Y UST and the 12-31-20 UST curve as frames of reference.
See also:
Footnotes & Flashbacks: Asset Returns 2-16-25
Mini Market Lookback: Headline Frenzy, Sloppy Details 2-15-25
Iron Mountain 4Q24: Performance Bar Gets Raised 2-15-25
Retail Sales Jan 2025: Warning Sign or Holiday Hangover? 2-14-25
Industrial Production Jan 2025: Capacity Utilization 2-14-25
CPI Jan 2025: Getting Frothy Out There 2-12-25
Footnotes & Flashbacks: Credit Markets 2-10-25
Footnotes & Flashbacks: State of Yields 2-9-25
Footnotes & Flashbacks: Asset Returns 2-9-25
Mini Market Lookback: Simply Resistible! 2-8-25
Mini Market Lookback: Surreal Week, AI Worries about “A” 2-1-25
4Q24 GDP: Into the Investment Weeds 1-30-25
4Q24 GDP: Inventory Liquidation Rules 1-30-25
Credit Crib Note: Lennar Corp 1-30-25
D.R. Horton: #1 Homebuilder as a Sector Proxy 1-28-25
Durable Goods Dec 2024: Respectable ex-Transport Numbers 1-28-25
New Home Sales Dec 2024: Decent Finish, Strange Year 1-28-25
Tariff links:
Reciprocal Tariffs: Weird Science 2-14-25
US-EU Trade: The Final Import/Export Mix 2024 2-11-25
Aluminum and Steel Tariffs: The Target is Canada 2-10-25
US-Mexico Trade: Import/Export Mix for 2024 2-10-25
Trade Exposure: US-Canada Import/Export Mix 2024 2-7-25
US Trade with the World: Import and Export Mix 2-6-25
The Trade Picture: Facts to Respect, Topics to Ponder 2-6-25
Tariffs: Questions to Ponder, Part 1 2-2-25
US-Canada: Tariffs Now More than a Negotiating Tactic 1-9-25
Trade: Oct 2024 Flows, Tariff Countdown 12-5-24
Mexico: Tariffs as the Economic Alamo 11-26-24
Tariff: Target Updates – Canada 11-26-24
Tariffs: The EU Meets the New World…Again…Maybe 10-29-24
Trump, Trade, and Tariffs: Northern Exposure, Canada Risk 10-25-24
Trump at Economic Club of Chicago: Thoughts on Autos 10-17-24
Facts Matter: China Syndrome on Trade 9-10-24