
Footnotes & Flashbacks: Credit Markets 2-10-25
We see another uneventful week in credit spreads as steady credit fundamentals can be a source of “distraction from the distraction.”


Tariff setting process ready for some upgrades…
The supportive earnings season, modest UST curve rally in the long end, and a decent jobs report offered a smooth ride for credit markets the past week despite the scattered headlines from the White House and Washington likely to keep markets guessing on budgets, debt ceiling, and UST supply.
This week brings another round of CPI with Retail Sales and Industrial Production for some high utility color on what’s happening in the industry and consumer trenches.
More tariff headlines lurk from aluminum and steel tariffs at 25% to some ill-defined policies on revisiting the reciprocal tariff idea pitched back in 2019. All the actions and proposals to date have nothing to do with reciprocal tariffs and have been more arbitrarily set.
Away from the more obvious trend that the EU will be next for tariffs, the questions around Japan and South Korea remain for the auto sector given the high trade deficits with those two countries and their roles as major importers.
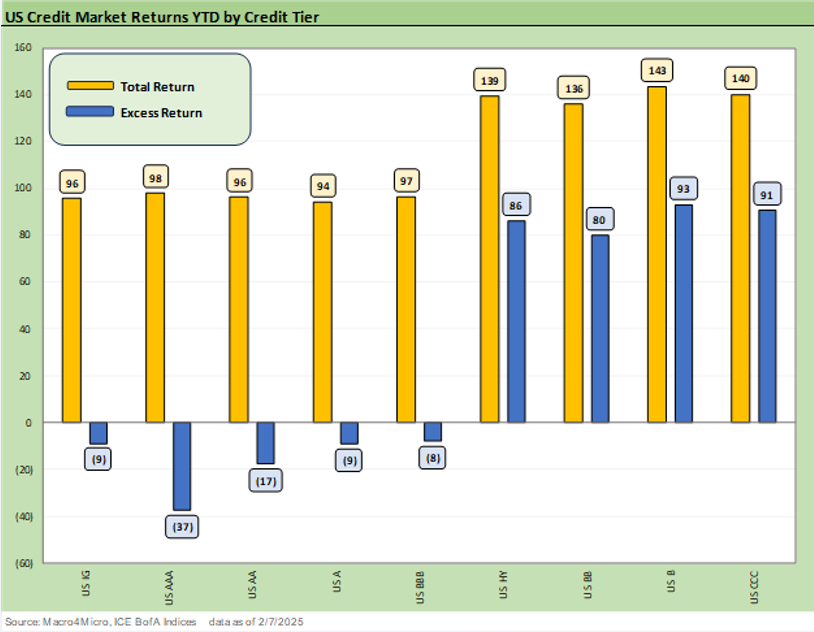
The above chart updates the YTD excess and total returns for IG and HY and across the credit tiers. We see HY running comfortably ahead on balance and notably on spread compression relative to IG, where total returns have been tied to the US curve and duration got a boost this past week.
A look at spreads…
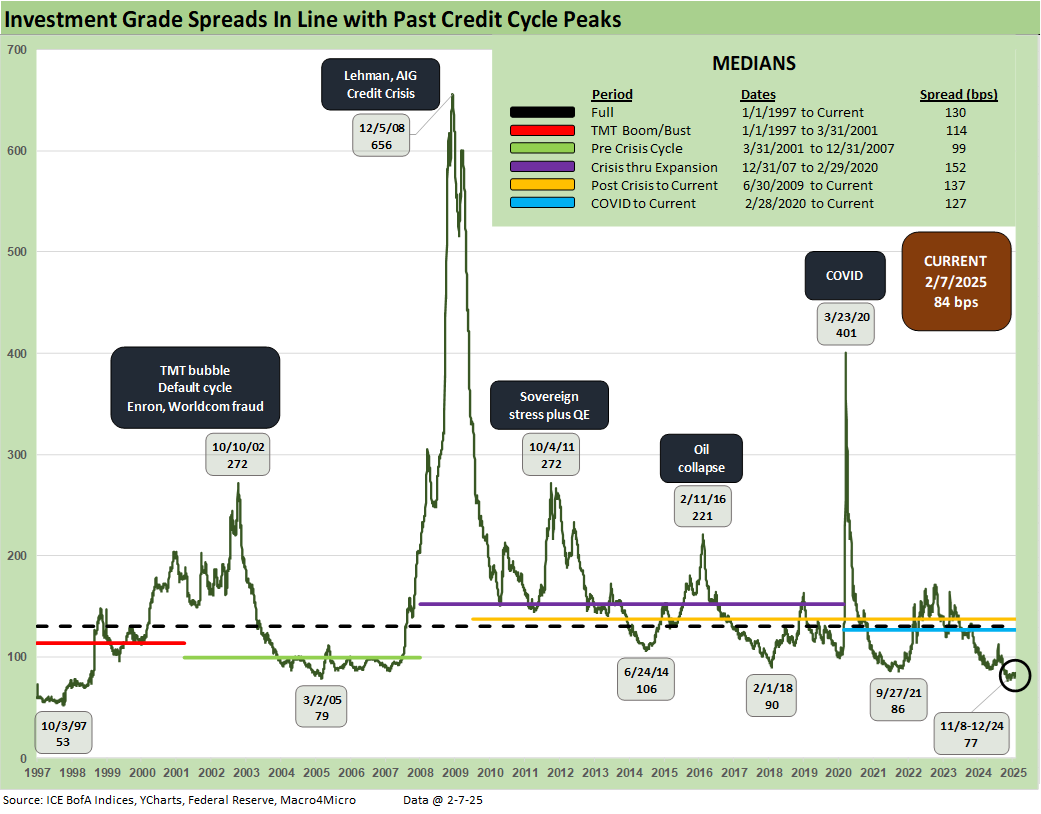
IG spreads moved slightly wider on the week but did not move the qualitative needle at all. Banks and bellwether issuing sectors have held in well, Current IG spreads remain below most prior cyclical lows even if above the late 2024 lows. The +84 bps sits below lows seen in Sept 2021, Feb 2018, and June 2014 as noted in the time series. The long-term median of +130 bps is +46 bps away from current levels.
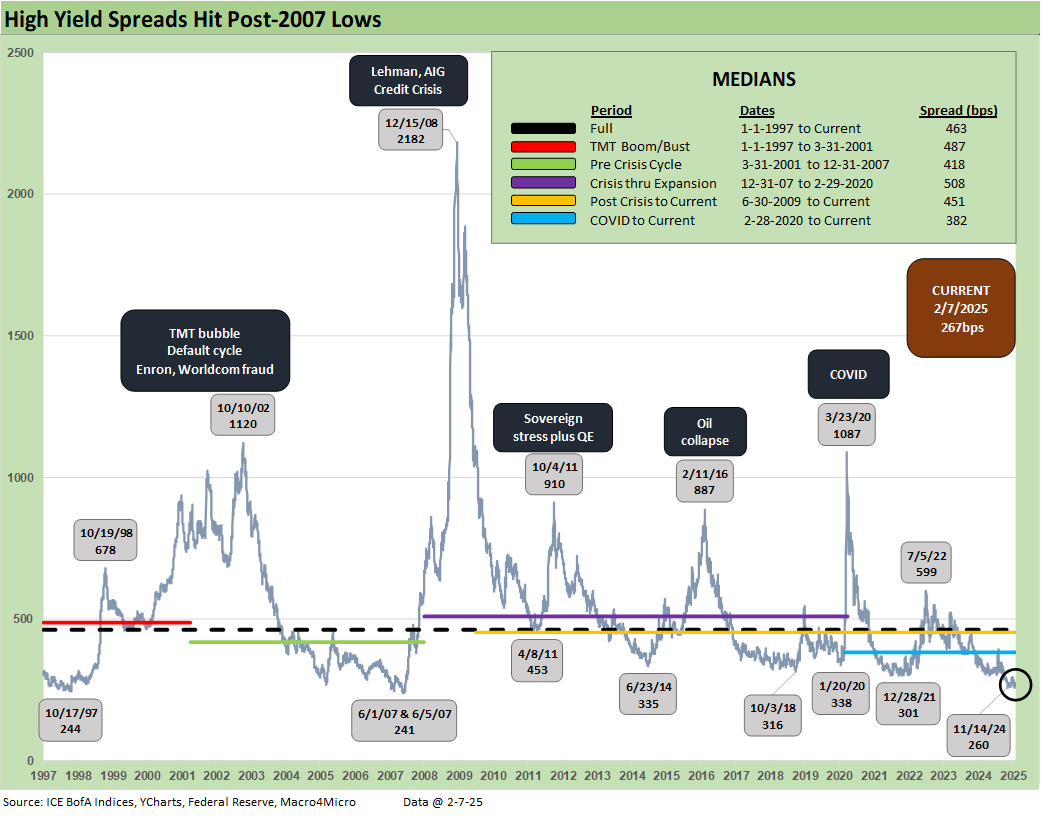
The HY OAS tightened slightly to +267 bps which remains well inside levels seen at the end of June 2007 and dramatically below the +463 bps long-term median. The sustained period below the +300 bps line has not been seen since 2007 and 1997.
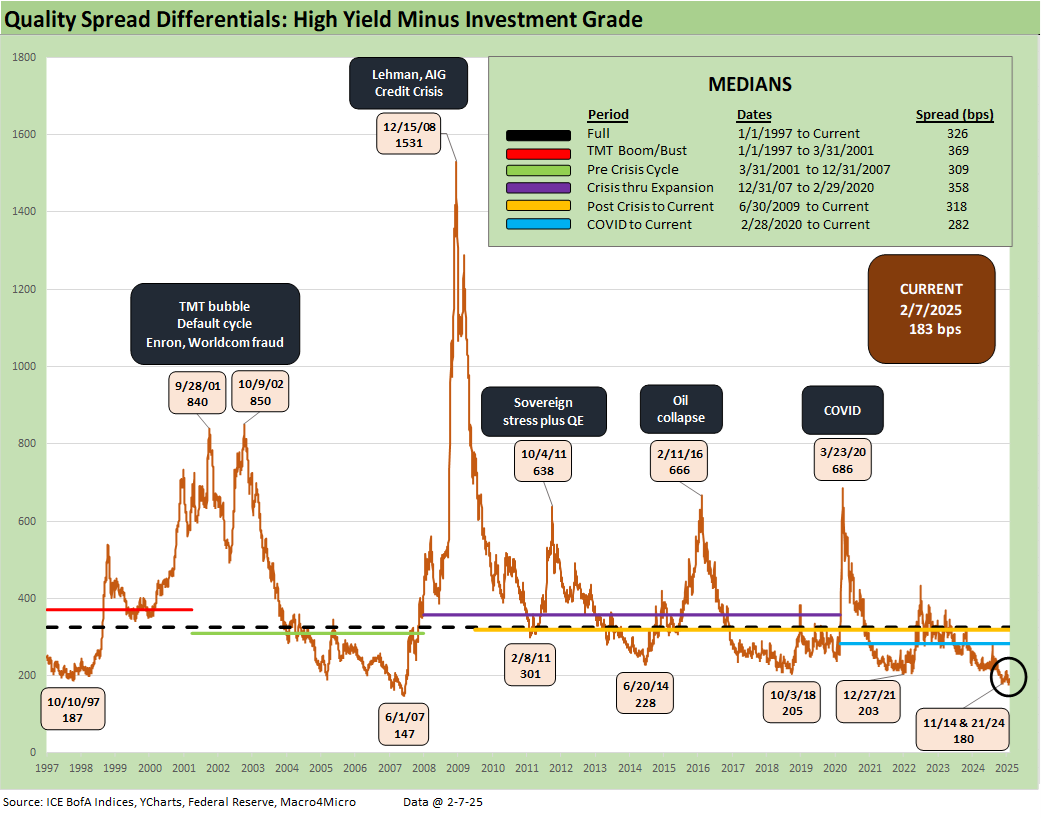
The “HY OAS minus IG OAS” differential of +183 bps follows the history of reaching a milestone for such a consistent period below the +200 bps line. That takes the market back to the cyclical peaks of credit demand in 2007 and 1997 and in some cases bubble periods. We are at least looking at a higher quality, more BB-heavy mix in this HY market.
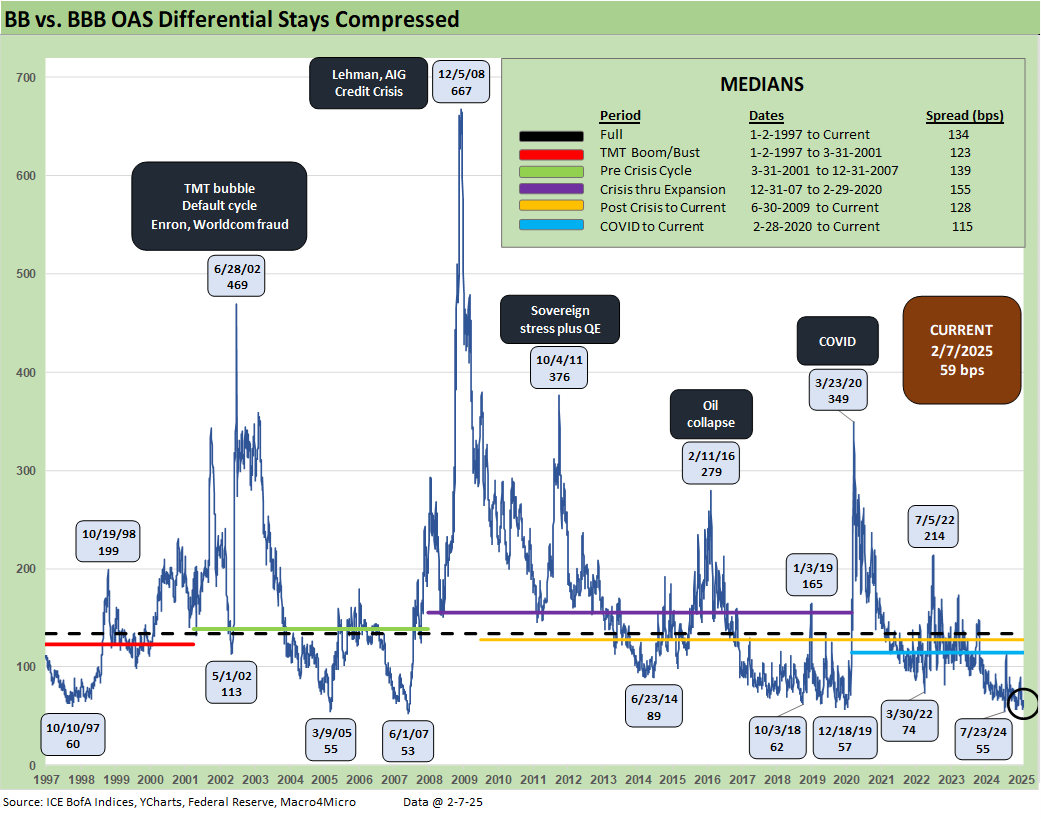
The BB vs. BBB quality spread differential at +59 bps is above the multicycle lows of July 2024 when it hit +55 bps, but it remains close to that low and the June 2007 and March 2005 lows.
The long-term median of +134 bps leaves a lot of room to maneuver. With some BBB names that could see some pressure ahead subject to macro developments (autos, Boeing), the differential would need to see more decompression waves in HY to shake the BB tier or the speculative grade divide would need to see some “new members” from BBB downgrades.
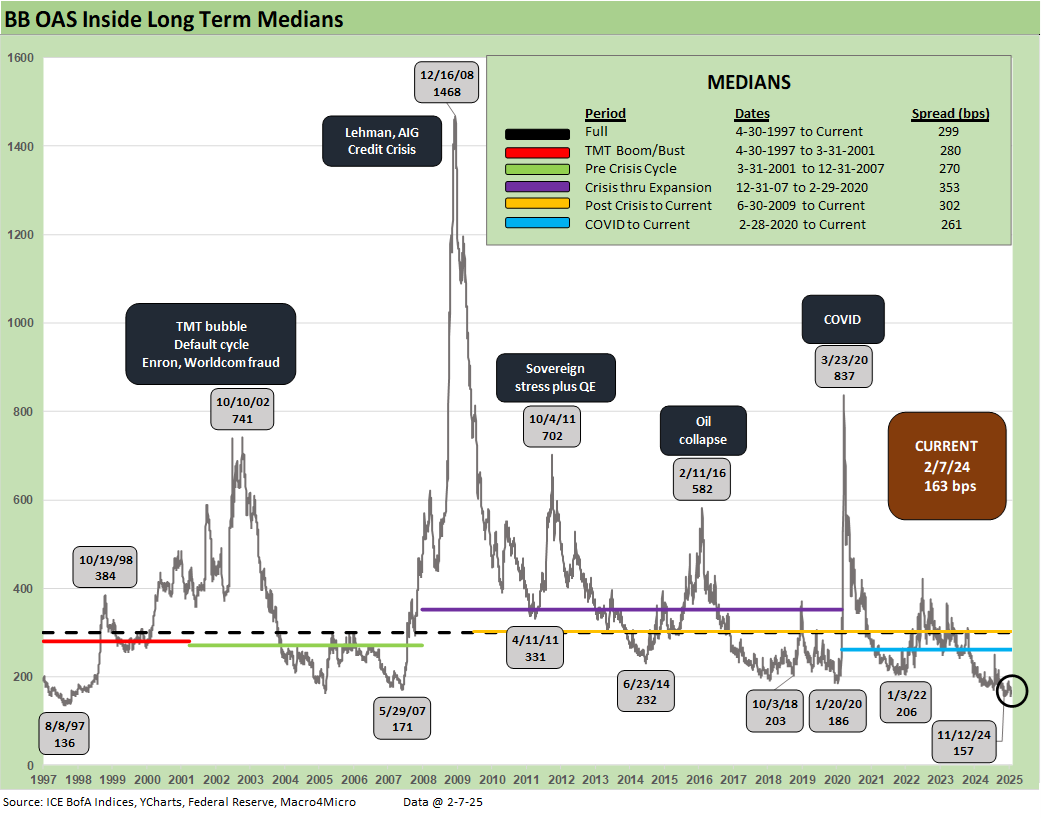
The BB tier at +163 bps remains well inside the +200 bps handles seen at the lows in Jan 2022, Oct 2018, and June 2014. The Jan 2020 lows had cracked the +200 bps line at +186 bps, but that was still +23 bps higher than current BB OAS.
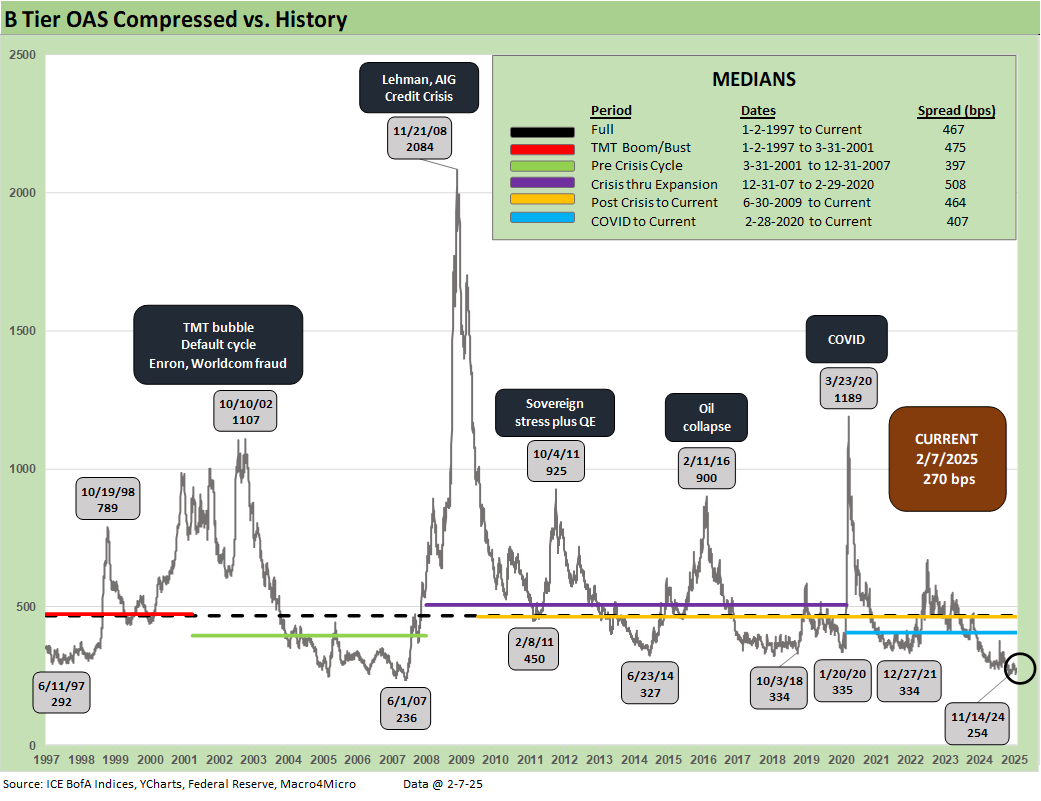
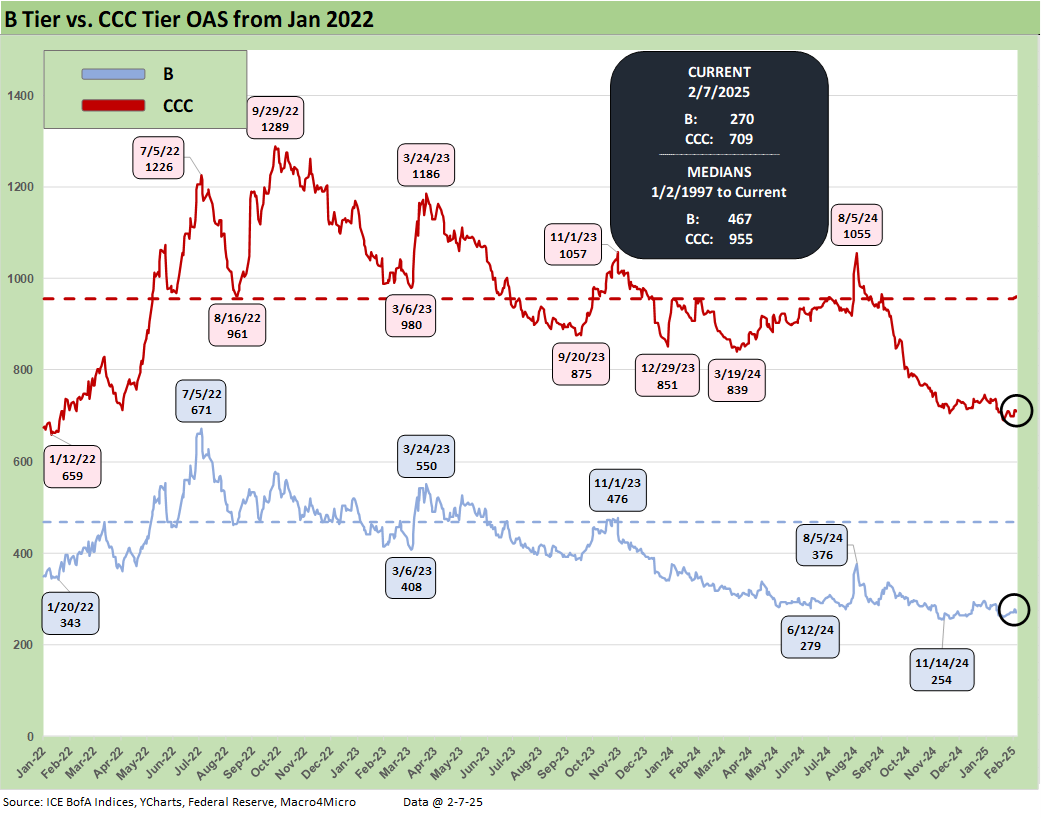
The B tier is the sweet spot of HY and the current +270 is well inside the +300 bps handle lows of Dec 2021, Jan 2020, Oct 2018 and June 2014 as noted. Early June 2007 had hit +236 before widening quickly later in June.
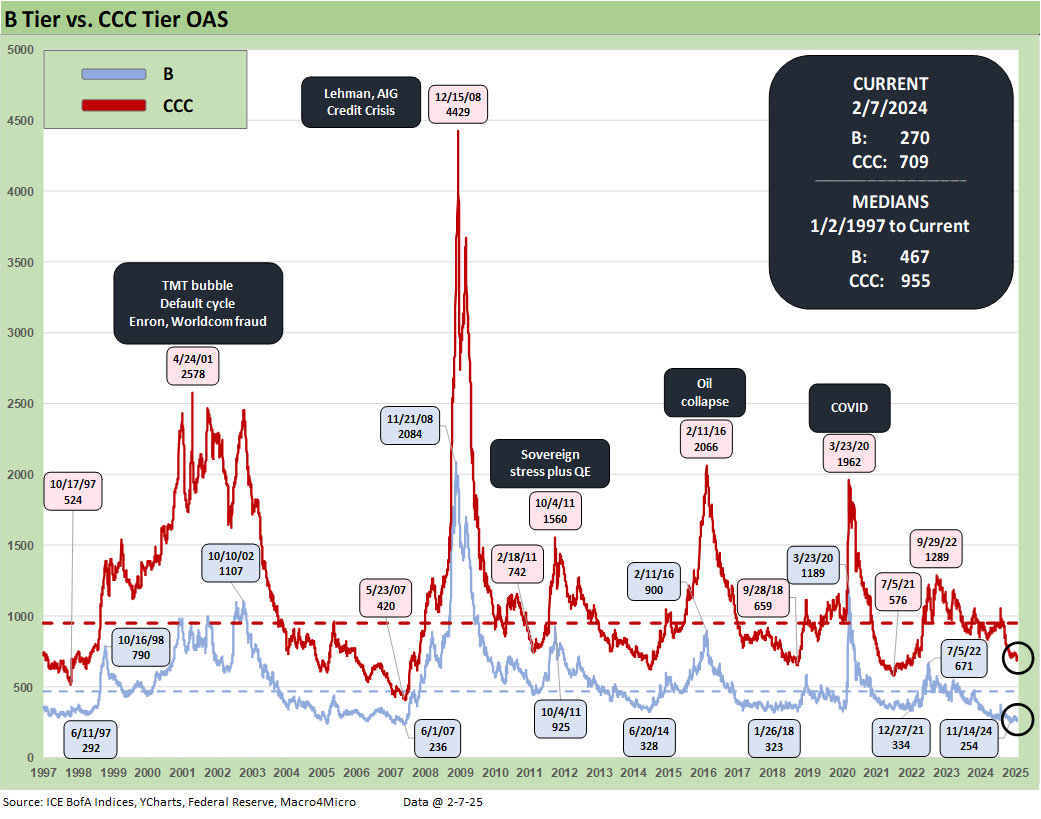
The B vs. CCC tier time series above features some notable points of B vs. CCC divergence, but that CCC history of sudden and sharp “gaps” wider are less threatening now with so much of the aggressive PE deals over in private credit.
We highlight the B tier and CCC tier lows along the journey. The current structure of the market offers a healthier mix of technical risks (notably on redemption risk and fund outflows) than earlier cycles. The sudden quality spread gaps from the bottom that can reverberate will still be there but in less shocking and less illiquid fashion. That’s the theory at least. Such ideas always get tested.
The above time series just shortens up the timeline from Jan 2022 (just before the tightening cycle) for a better visual on recent swings.
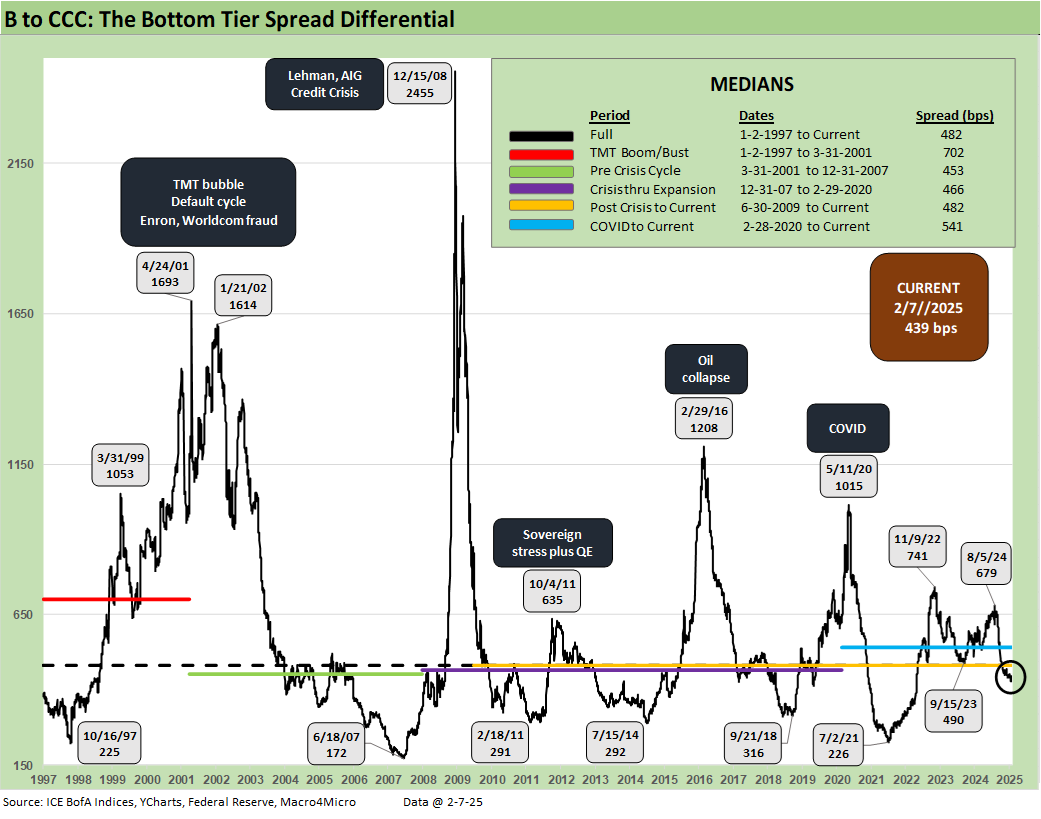
The long-term B vs. CCC tier OAS quality spread differentials are detailed above and are set against the long-term median of +482 bps. The current +439 bps differential is modestly inside the median.
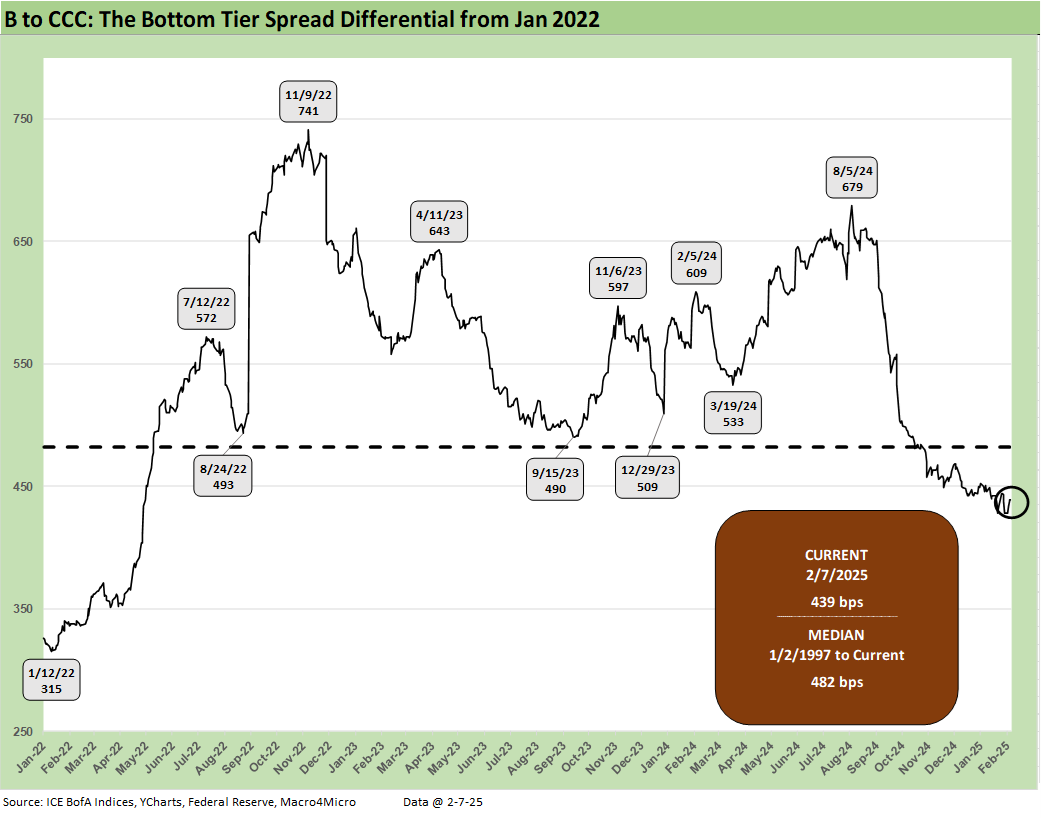
The shorter timeline version of the B vs. CCC differential shows the impressions from the spread rally as well as the usual constituent migration, default dropouts and distressed exchanges (or quasi-distressed) that can materially move the needle in the CCC tier.
A look at yields…
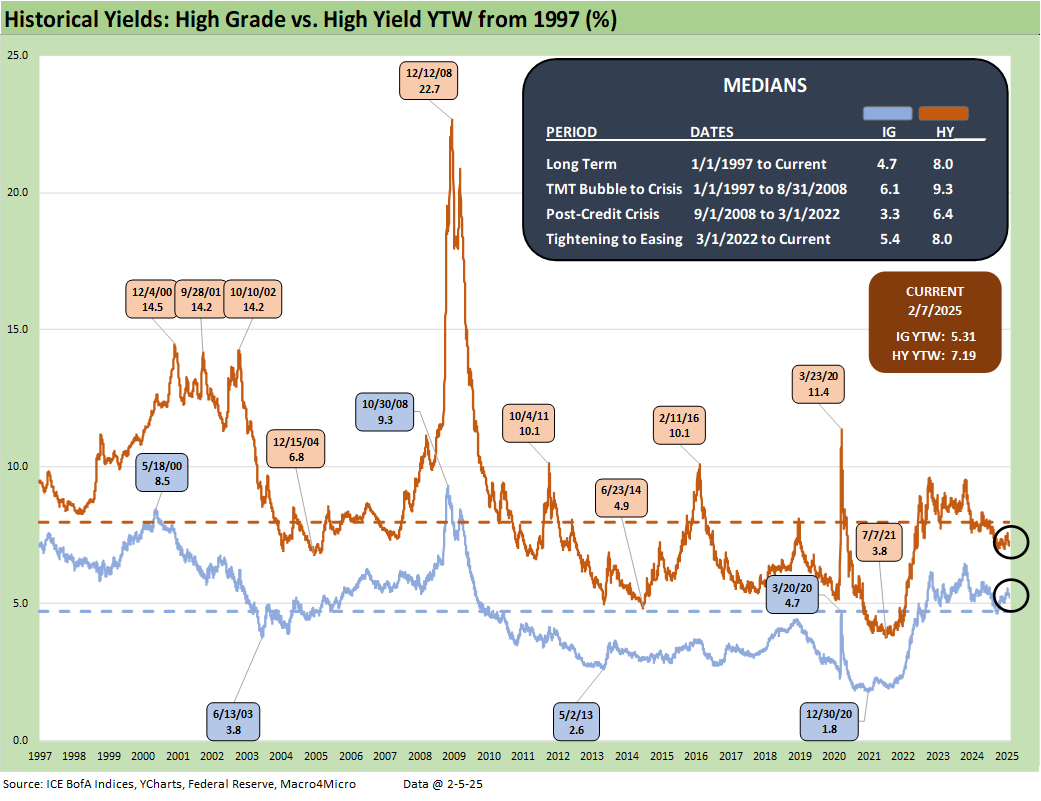
The HY index and IG index yield histories swung around with the credit cycles but were notably distorted across the ZIRP and QE years after late 2008. We believe the pre-ZIRP years are the most appropriate for long-term median comparison. We have made the case that the 9.3% pre-crisis (pre-ZIRP) median for HY and 6.1% in IG make for the most relevant frames of reference. That is backed up by framing median spreads vs. current spreads and index yield benchmarks.
Current yields reflect the low UST levels relative to past cycles as well as historically tight spreads. Median spreads would put all-in yield in HY closer to pre-crisis medians, so that is a frame of reference for historical context.
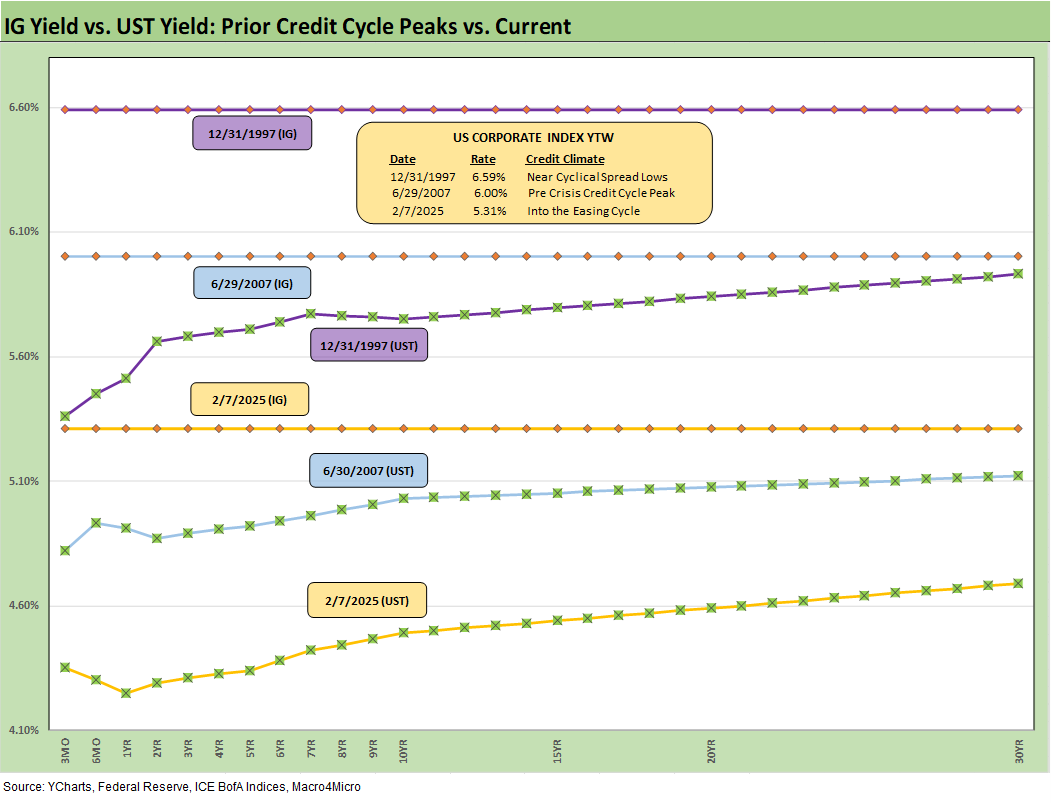
The above chart frames IG index yields and the related UST curve for the Friday close and for two useful comps from prior credit cycle peaks in June 2007 and Dec 1997 when credit markets were hot and spreads down near multiyear lows. For IG yields, the story is all about the UST curve differentials with spreads tight in all three markets.
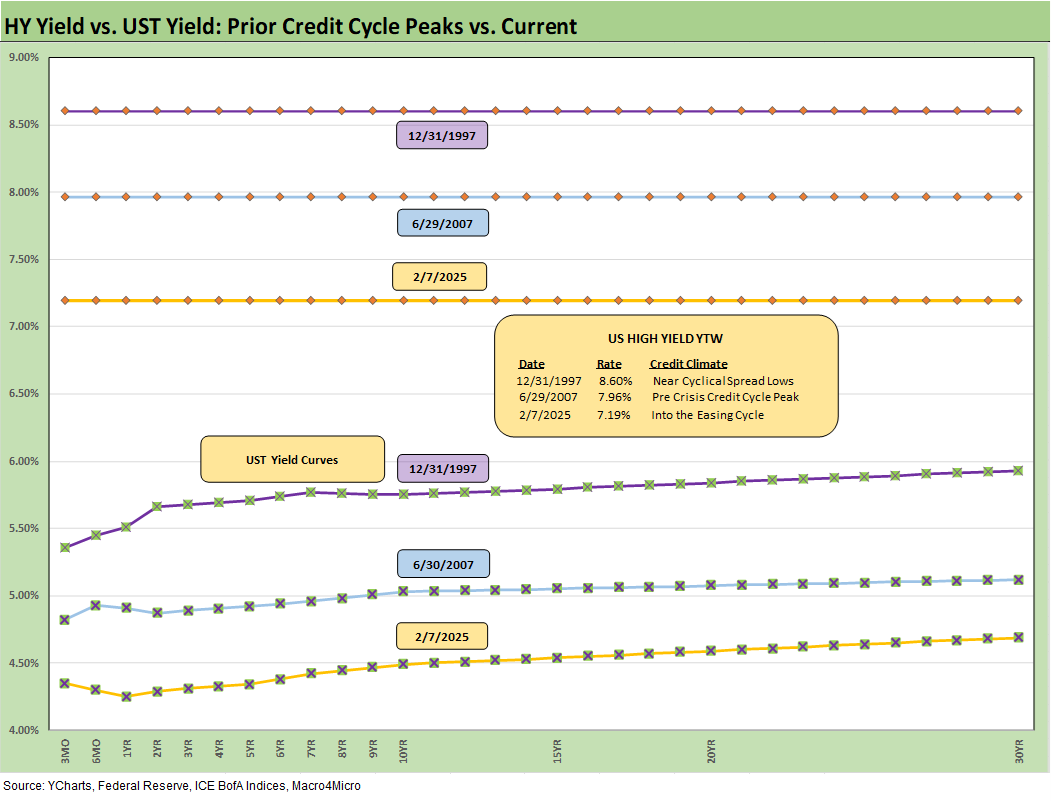
The above chart does the same drill as the prior chart but for HY index yields. Low UST curve and extremely tight spreads put the current HY index yield below the earlier peak credit cycles.
See also:
Aluminum and Steel Tariffs: The Target is Canada 2-10-25
US-Mexico Trade: Import/Export Mix for 2024 2-10-25
Footnotes & Flashbacks: Asset Returns 2-9-25
Mini Market Lookback: Simply Resistible! 2-8-25
Payroll Jan 2025: Into the Occupational Weeds 2-7-25
Payroll Jan 2025: Staying the Course, Supports FOMC Hold 2-7-25
Trade Exposure: US-Canada Import/Export Mix 2024 2-7-25
US Trade with the World: Import and Export Mix 2-6-25
The Trade Picture: Facts to Respect, Topics to Ponder 2-5-25
JOLTS Dec 2024: Before the Tariff JOLT Strikes 2-4-25
Footnotes & Flashbacks: Credit Markets 2-3-25
Footnotes & Flashbacks: State of Yields 2-2-25
Footnotes & Flashbacks: Asset Returns 2-2-25
Tariffs: Questions to Ponder, Part 1 2-2-25
Mini Market Lookback: Surreal Week, AI Worries about “A” 2-1-25
PCE: Inflation, Personal Income & Outlays 1-31-25
Employment Cost Index 4Q24: Labor Crossroad Dead Ahead 1-31-25
4Q24 GDP: Into the Investment Weeds 1-30-25
4Q24 GDP: Inventory Liquidation Rules 1-30-25
Credit Crib Note: Lennar Corp 1-30-25
D.R. Horton: #1 Homebuilder as a Sector Proxy 1-28-25
Durable Goods Dec 2024: Respectable ex-Transport Numbers 1-28-25
New Home Sales Dec 2024: Decent Finish, Strange Year 1-28-25
 |
|