
CPI Jan 2025: Getting Frothy Out There
Though tariffs are not in highest gear yet, Headline CPI and Core CPI both stepped up to MoM highs and 3% handles YoY.


Trump should have held off his social media post that “interest rates should be lowered” until after the 8:30 am CPI release as a hot headline number was printed at +0.5% for Jan 2025 on the heels of +0.4% for December, +0.3% for November after 3 earlier months of +0.2% that followed +0.1% in July. Core also showed a similar MoM sequence with slight differences. It is safe to say there is a pattern in a strong economy.
The YoY 3.0% headline CPI was a recent high after a string of 2% handles and 3.3% for Core CPI hovered around the recent highs. Food ticked to highs MoM at +0.4% and posted +2.5% YoY. “All Items less shelter” ticked higher MoM to +0.5% while “All items less food, shelter, and energy” more than doubled MoM to +0.5%. Total Services rose from +0.3% to +0.5%.
Durables swung materially higher MoM from -0.1% to +0.4%. We see New Vehicle inflation lower MoM at 0.0% with the potential for high tariffs and supply distortions dead ahead. Used Vehicles materially climbed MoM to +2.2% MoM from 0.8%.
As we go to print, the 10Y UST is higher by +9 bps and the 2Y UST by +7 bps. The Treasury Secretary has indicated that the10Y UST is the focal point, but the market will still be the one that decides the 10Y. Trump’s demand on Powell this morning to lower rates marks the second reversal in a week. We expect today’s CPI does not help the case for easing even if PCE is the main metric for the FOMC.
In the photo at the top, we thought Animal House imagery is always relevant and notably given the alpha male mindset of policy these days that were shaped in the early to mid-1960s. It has been an “All is Well” sentiment in some risky asset markets also in 2025 so far, and the tariffs have been more about debating and handicapping the policies as mere policy posturing or perhaps the latest version of a “transient” inflation factor (as if the cost of inventory is a concept and not a fact to the buyers who pay it).
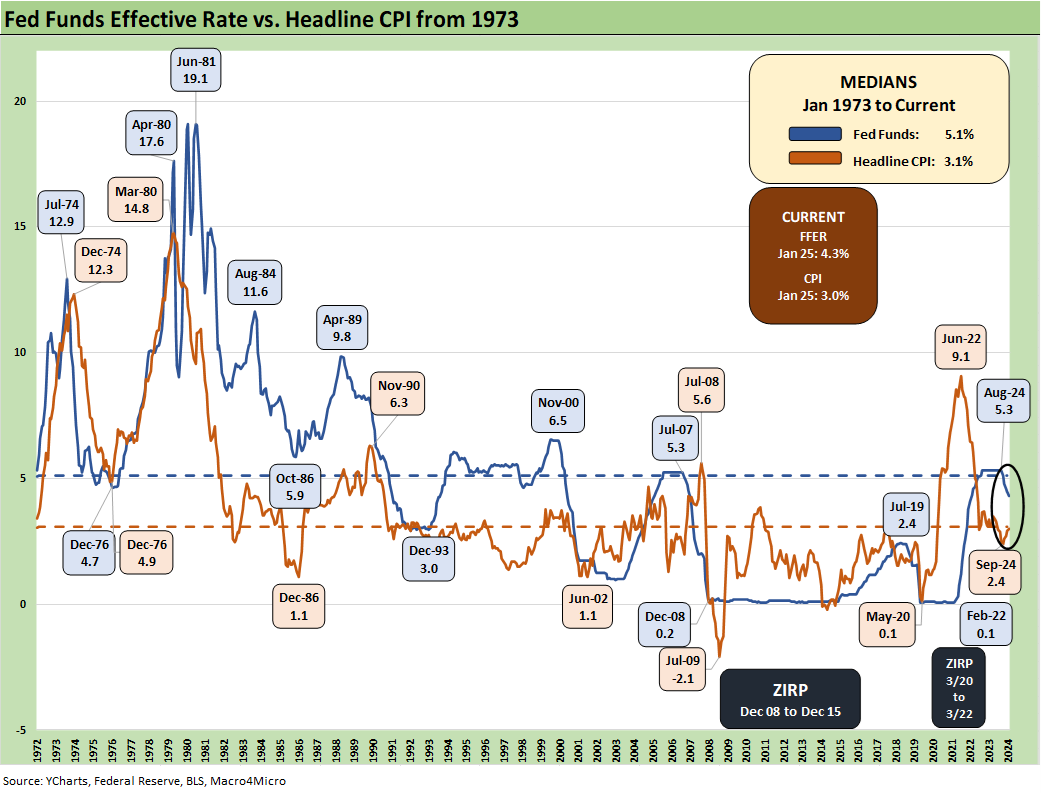
The chart above updates the long-term story line for Headline CPI with the market now around the long-term median from 1973 (3.1%). We are now back in a somewhat normal monetary backdrop with no more ZIRP and a post-tightening, post-inflation-fighting period. Memories might get jogged that Trump had been screaming for negative fed funds back in Trump 1.0 to rival Germany’s even as many of his allies wanted to blame Powell for inflation risk (pre-COVID) at the time. Powell was the one who pushed back and was attempting normalization. Memories do fade, and here we are again.
The higher inflation expectations that rattled the markets this past Friday (U of Michigan sentiment survey) are off to a prescient start with today’s print. We have not even experienced the “buyer pays” reactions on tariffs yet (see The Trade Picture: Facts to Respect, Topics to Ponder 2-6-25, Tariffs: Questions to Ponder, Part 1 2-2-25 and links at bottom).
Until the tariffs are actually in place on a broader scale with the EU and Canada and Mexico, a good economy inherited by Trump (despite the denials) is already influencing inflation. There should not be much surprise that the “good parts of Biden” and the “good parts of Trump” that have been in the GDP and payroll numbers across time would add up to solid demand.
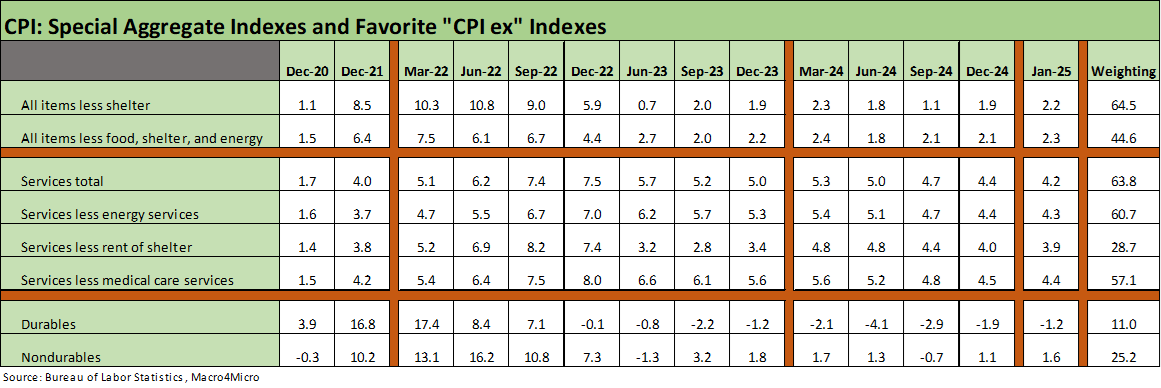
The special aggregate CPI indexes (Table 3) are always worth a look for a few more prisms, but they don’t help inflation optimists much with most key line items higher MoM and various angles on Services unfavorable. We still see Total Services at +4.2% YoY and MoM at +0.5% (up from +0.3% sequentially). Some of the sequential YoY metrics frame up more favorably but the MoM trends are a setback.
The Durables line is a small part of the index with its 11% weighting, and that has been in deflation mode YoY at -1.2%. However, for Jan 2025 the MoM Durables CPI was up from -0.1% in Dec to +0.4% in Jan 2025. Nondurables stayed in check at +0.4% MoM, down from +0.9% in Dec 2024. The Nondurables YoY was +1.6%.
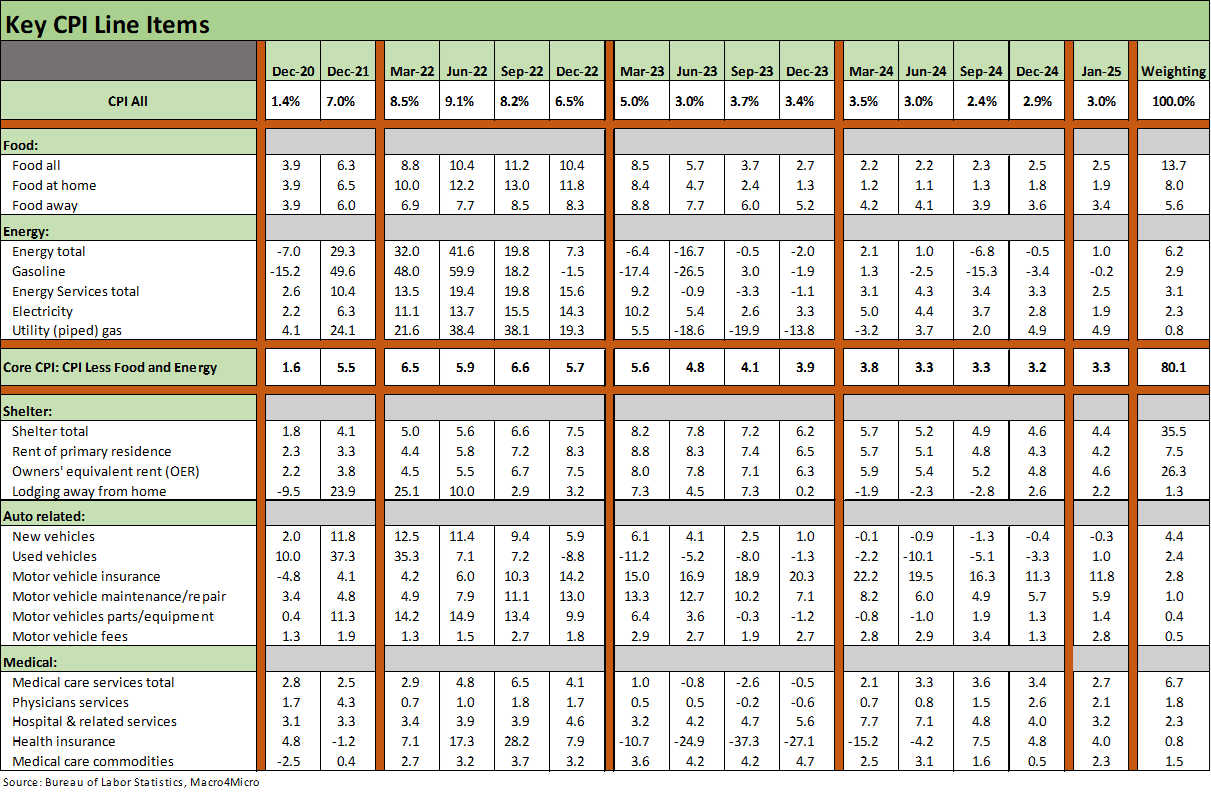
The above table runs through the Big 5 buckets that dominate the CPI index. Food, Energy, Shelter, Autos, and Medical are the pieces of the Big 5. Coming off an inflation and tightening cycle, the slow and steady uptick in Headline CPI YoY is important to note. Headline CPI has moved up steadily YoY from 2.4% in Sept to now hitting 3.0% for Jan 2025. Core has been mostly at 3.3% since Sept with a 3.2% YoY in Dec and now back to 3.3%. Core has been stubborn but not deteriorating YoY. That does not change the fact that getting into the MoM lines for Jan 2025 Core is unfavorable, moving from +0.2% to +0.4%.
Food and Energy are focal points with Trump promising “drill, drill, drill” and lower costs at the pump while his focus on “groceries” at the peak of his campaign and immediate aftermath leave headline CPI as an important metric (see Inflation: The Grocery Price Thing vs. Energy 12-16-24).
The “Food at Home” and the “Food Away from Home” lines face some risks ahead tied to trade (Canadian resources such as fertilizer and potash from Canada, retaliation and escalation around food and agricultural products, etc.). Meanwhile, labor costs (deportation, depletion of services payrolls) can flow into Food Away from Home as well as the operating costs of farms and dairies. Focusing on the price of eggs has become “a thing” after it was blamed on Biden, but bird flu should not be the main event. All the food lines and operating costs matter – including farm labor. The aggregate food numbers can also be heavily wagged by energy costs from fertilizer to delivery costs.
We created our own mix of Automotive CPI lines since autos are such a major piece of so many household budgets (see Automotive Inflation: More than Meets the Eye10-17-22). Autos will get more interesting if Trump decides to blow up the Mexico and Canadian auto sectors and dramatically reduce the supply of Mexico and Canada manufactured vehicles or takes policy actions that spike the unit costs of such vehicles (steel and aluminum).
We already got a taste of what happens to new and used vehicle prices when shortages unfold (notably in 2022), and that included strained production schedules on semiconductor shortages in earlier periods. China trade war risk and supplier chain worries around Taiwan would be one more dagger in the auto production chain that the market has already experienced. Those are good policy areas to avoid self-inflicted wounds, but we are heading in that direction for now. As we have covered in prior notes (see tariff links at the bottom), autos have extensive multiplier effects across a range of economic ecosystems and a wide geographic range of markets.
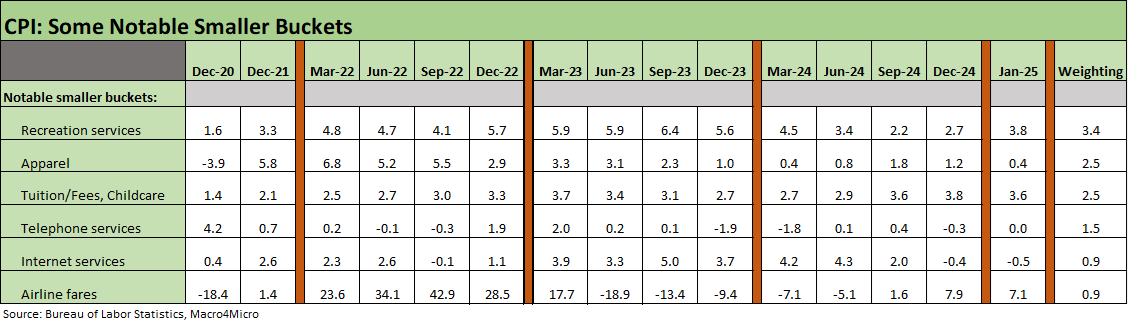
The notable add-ons are detailed above. They present a mixed picture with Recreation Services a sign of a robust consumer sector as well as labor cost pressures to pass on. Apparel has seen inflation ease with a MoM -1.4% rolling up into the +0.4% YoY. Airline fares remain high YoY but MoM eased to +1.2% from +3.0% in Nov.
See also:
Footnotes & Flashbacks: Credit Markets 2-10-25
Footnotes & Flashbacks: State of Yields 2-9-25
Footnotes & Flashbacks: Asset Returns 2-9-25
Mini Market Lookback: Simply Resistible! 2-8-25
Mini Market Lookback: Surreal Week, AI Worries about “A” 2-1-25
4Q24 GDP: Into the Investment Weeds 1-30-25
4Q24 GDP: Inventory Liquidation Rules 1-30-25
Credit Crib Note: Lennar Corp 1-30-25
D.R. Horton: #1 Homebuilder as a Sector Proxy 1-28-25
Durable Goods Dec 2024: Respectable ex-Transport Numbers 1-28-25
New Home Sales Dec 2024: Decent Finish, Strange Year 1-28-25
Inflation Related:
Payroll Jan 2025: Into the Occupational Weeds 2-7-25
Payroll Jan 2025: Staying the Course, Supports FOMC Hold 2-7-25
JOLTS Dec 2024: Before the Tariff JOLT Strikes 2-4-25
PCE: Inflation, Personal Income & Outlays 1-31-25
Employment Cost Index 4Q24: Labor Crossroad Dead Ahead 1-31-25
Inflation: The Grocery Price Thing vs. Energy 12-16-24
Inflation Timelines: Cyclical Histories, Key CPI Buckets11-20-23
Automotive Inflation: More than Meets the Eye10-17-22
Tariff links:
US-EU Trade: The Final Import/Export Mix 2024 2-11-25
Aluminum and Steel Tariffs: The Target is Canada 2-10-25
US-Mexico Trade: Import/Export Mix for 2024 2-10-25
Trade Exposure: US-Canada Import/Export Mix 2024 2-7-25
US Trade with the World: Import and Export Mix 2-6-25
The Trade Picture: Facts to Respect, Topics to Ponder 2-6-25
Tariffs: Questions to Ponder, Part 1 2-2-25
US-Canada: Tariffs Now More than a Negotiating Tactic 1-9-25
Trade: Oct 2024 Flows, Tariff Countdown 12-5-24
Mexico: Tariffs as the Economic Alamo 11-26-24
Tariff: Target Updates – Canada 11-26-24
Tariffs: The EU Meets the New World…Again…Maybe 10-29-24
Trump, Trade, and Tariffs: Northern Exposure, Canada Risk 10-25-24
Trump at Economic Club of Chicago: Thoughts on Autos 10-17-24
Facts Matter: China Syndrome on Trade 9-10-24
Trade Flows: More Clarity Needed to Handicap Major Trade Risks 6-12-24
Trade Flows 2023: Trade Partners, Imports/Exports, and Deficits in a Troubled World 2-10-24
Trade Flows: Deficits, Tariffs, and China Risk 10-11-23