
4Q24 GDP: Into the Investment Weeds
We detail the underlying Fixed Investment lines that roll up into headline GDP. We see mixed signals with many policy variables in play.


The first estimates for Private Fixed Investment in 4Q24 show continued growth in Intellectual Property but both Equipment and Structures contracting vs. 3Q24.
With Gross Private Domestic Investment GPDI retreating from all-time highs, the Government expenditures and investment side of the ledger saw another quarter of growth. The path for continued growth will be murky given the flurry of policy actions and how those flow energy capex and AI investments alongside some planned deep spending cuts.
Biden’s tenure oversaw Private Fixed Investment increases across almost all major areas except for Mining (using 4Q19 as a benchmark) with Structures up 30.0% and Equipment up 25.6%. One of the largest swings was seen in the very strong Manufacturing investment revival that is just shy of 3x the 4Q19 level.
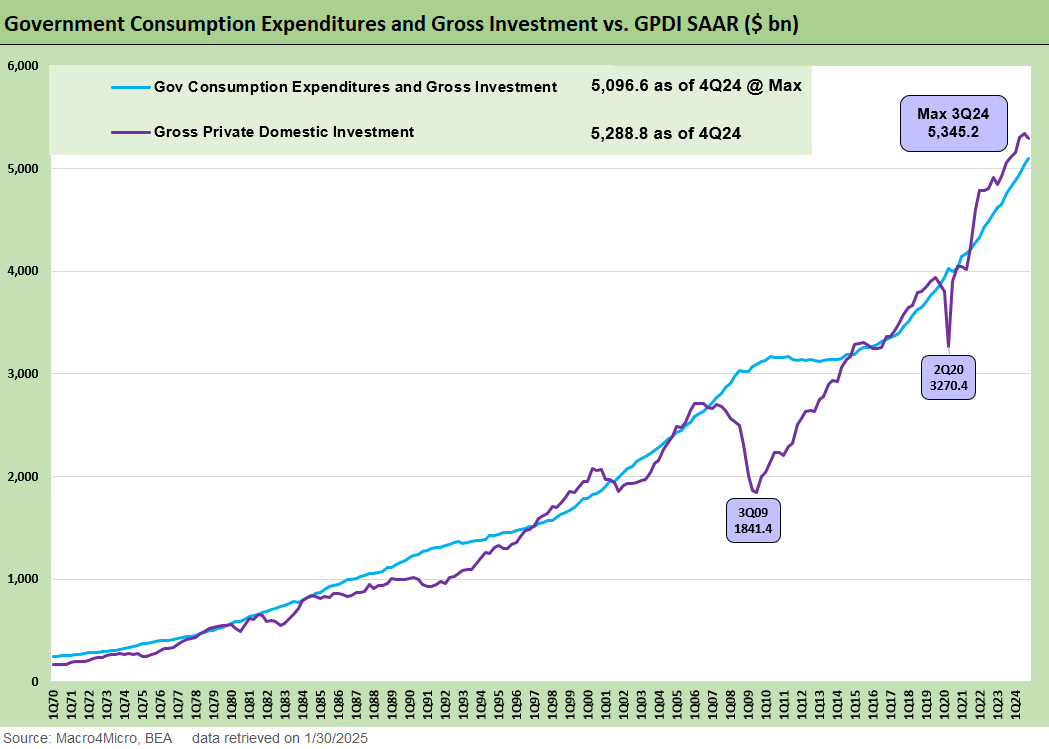
The first chart provides an overview of Government spending and investment compared with Gross Private Domestic Investment (GPDI). After the main PCE event, these are the other two major contributors to GDP. As a reminder, GDPI covers items such as manufacturing, construction, real estate, E&P, and tech investments. The Government component includes Federal, State, and Local spending with the majority coming from the State and Local level.
Recent trends are very favorable for GPDI and Government spending and include pockets of impressive growth outright but especially considering the backdrop of an inflation spike and the subsequent high interest rate environment. GPDI pulled back slightly this quarter after a solid run of numbers and notably in 2023.
Government spending has been in growth only mode alongside the growing Federal budget deficit. As the current administration considers policies affecting both sides of the ledger, the deficit continues to be a looming issue as well as its impact on longer rates. For now, we see growth at the Federal and State/Local level. The Federal growth rate was down sequentially from +8.9% in 3Q24 to +3.2% in 4Q24. Defense and Nondefense at the Federal level were both up over 3%. State/Local was down to +2.0% in 4Q24 from +2.9% in 3Q24.
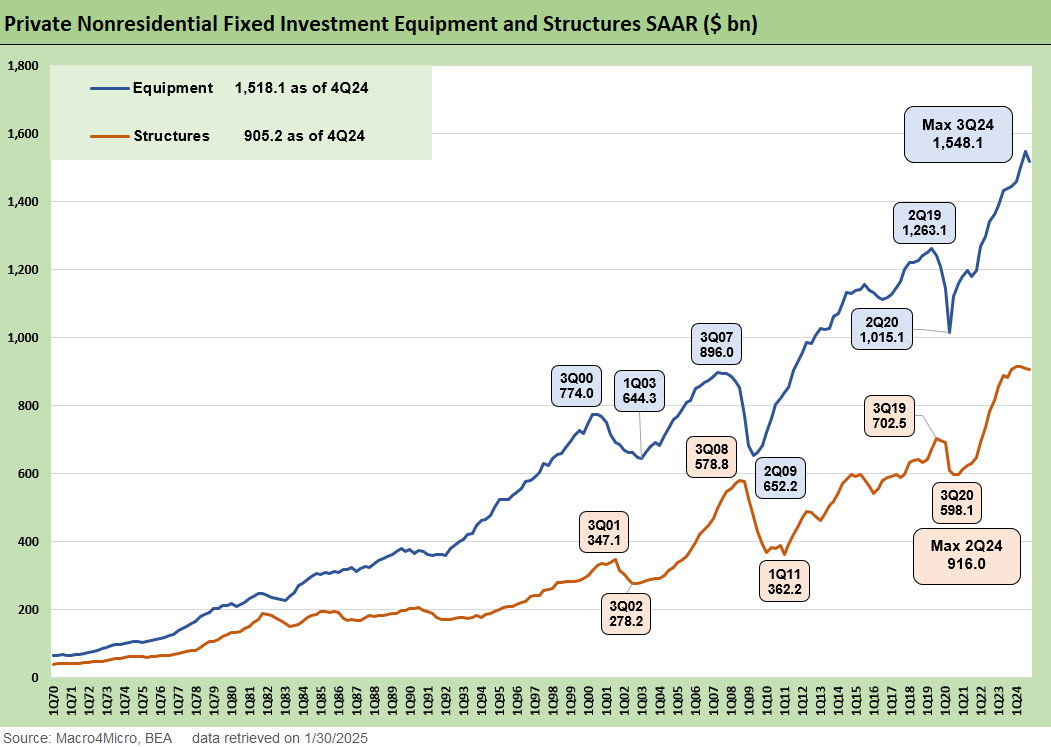
The above chart details the long-term time series for private investment in Structures and Equipment. For reference, these come from the GPDI line item in the GDP release and comprises just under 18% of GDP. We examine these as a high-level proxy for Capex trends across with more industry detail to follow.
The 4Q24 release today showed declines for both Equipment and Structures. Structures investment provides a stronger relative pause signal as it is virtually flat from where it ended in 4Q23. The Equipment Investment data point for this quarter sequentially and was down sharply by -7.8% in the GDP accounts. That said, the last year of growth still shows about a 5% increase since 4Q23.
The overall story is still impressive given the challenges of the higher interest rate environment and supports the Fed’s decision yesterday to maintain policy rate at current levels. The fixed investment rates are still quite resilient and interest rates are well down from the peaks. There is time to watch the moving parts of policy fallout (notably tariffs, deregulation, tax incentives etc.) and the flow-through into economic activity.
The next stretch will be about how incentives and fiscal support under the Biden administration will continue to be targeted under Trump and what replaces them. The flurry of policy action has already signaled the focus towards fossil fuel production and away from EVs and clean energy sources. Trade policy and tariffs used as an import deterrent or as a catalyst for domestic structures and equipment demand comes at a lag. The volume of tariff-driven structures or equipment that will actually be put in place is anything but clear. Meanwhile, the tariff rates and duration of those tariffs are uncertain variables for capital budgets that can stall commitments. There are many moving parts that need to be wrestled with by corporate decision makers.
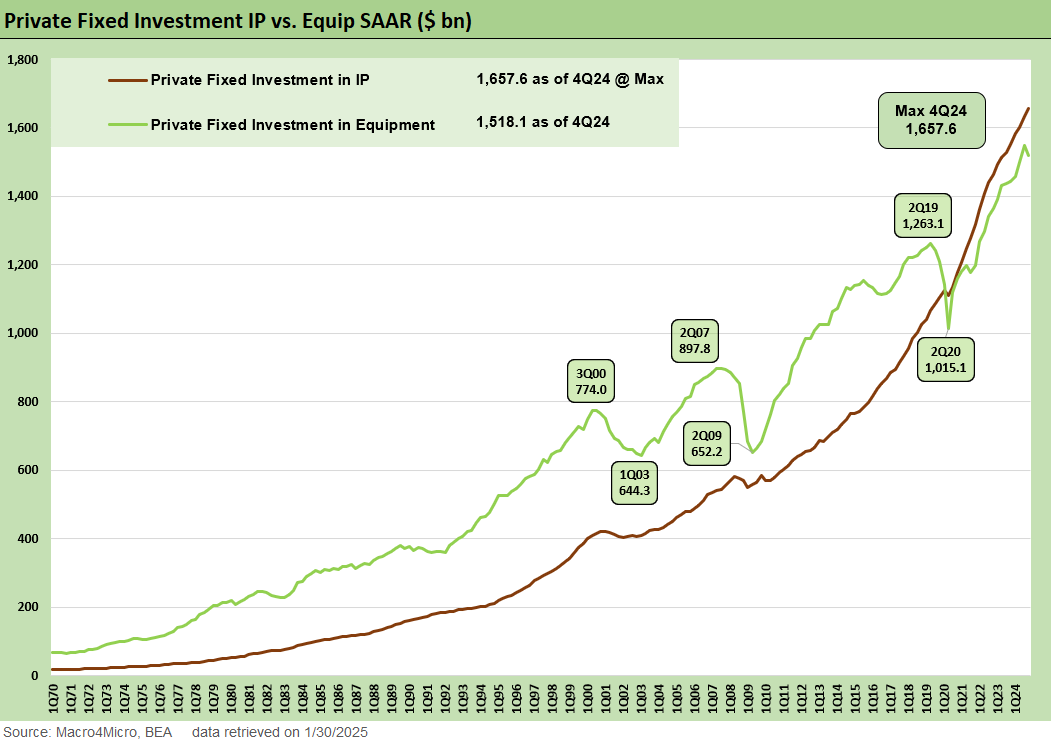
The above chart simply changes the frame of reference to a comparison of Equipment vs. Intellectual Property. IP is on a steady ascent and did not materially contract across the pandemic while Equipment investments cratered. IP is now the largest component of GPDI and has been since 2Q20. The secular shift to increased IP investments is still underway with the newest AI and data leg another evolution of the broader technological trends. That extends into numerous sectors such as power and data centers.
Continued IP investments here lead to questions around what supporting investments on data centers, semiconductors, energy, etc. are needed and where the fiscal support is allocated. The DeepSeek headlines this past week gave the debate fresh lags and excuses to revisit the most ambitious forecasts.
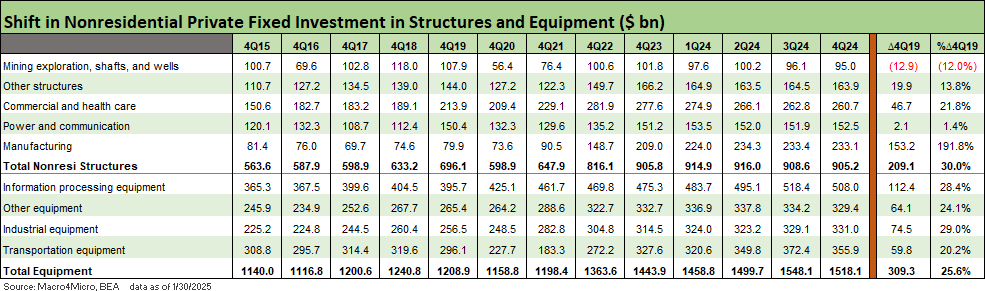
In the above chart and the following charts, we frame the private investment line items vs. the pre-COVID 4Q19 quarter and provide a medium-term history given the lead times involved. We detail the 4Q19 deltas on the right of the chart. The immediate dip across 2020 then saw rapid growth over the past few years with the Structures the beneficiary of legislative initiatives (IRA, CHIPS, Infrastructure bill) that led to +30.0% expansion in investment and a still respectable +25.6% for Equipment.
Within the Structures line, the winners and losers are very clear with E&P the only one seeing contraction since pre-COVID. We expect upstream energy and related infrastructure is an area that will see renewed focus under Trump, but it is relatively small in the larger context of Structures Investment. As we have covered earlier, the Manufacturing line is where the lion’s share of the growth came from with a gross increase of $209 bn that sees 4Q24 end at almost 3x the 4Q19 level. That is a very bug delta supporting manufacturing.
The Equipment side saw much more balanced growth across the lines as all four areas saw 20-30% growth in recent history. We see slightly more robust growth for Industrial Equipment and Information Processing equipment. As the next leg of planning is underway, the impact of strict immigration policy on labor force and the fallout for construction project planning will be an important theme to watch.

This chart narrows the focus to the Structures categories where we see some more nuance in the swings. We see some major winners the past few years such as Healthcare (+33.2%), Warehouses (+54.8%), and Alternative Electric (39.7%) subcategories.

The last chart runs a similar exercise for the Equipment subcategories. We see the major contributors to the pullback in Equipment investment this quarter at Computers and peripheral ($-11.5 bn) and Aircraft lines ($-24.3 bn). Stepping back to the 4Q19 comparison mark, we see broad growth across the board.
Kevin Chun, CFA
Glenn Reynolds, CFA
See also:
4Q24 GDP: Inventory Liquidation Rules 1-30-25
GDP 3Q24: Final Number at +3.1% 12-19-24
3Q24 GDP Second Estimate: PCE Trim, GPDI Bump 11-27-24
Fixed Investment in 3Q24: Into the Weeds 11-7-24
The Politics of Objective GDP Numbers: “Flex Facts” on Growth 10-30-24
3Q24 GDP Update: Bell Lap Is Here 10-30-24
2Q24 GDP: Final Estimate and Revision Deltas 9-26-24
2Q24 GDP 2nd Estimate: The Power of 3 and Cutting 8-29-24
Presidential GDP Dance Off: Clinton vs. Trump 7-27-24
Presidential GDP Dance Off: Reagan vs. Trump 7-27-24
GDP 2Q24: Banking a Strong Quarter for Election Season 7-25-24
State Unemployment: A Sum-of-the-Parts BS Detector 6-30-24
1Q24 GDP: Final Cut Moving Parts 6-27-24
Construction Spending: Stalling Sequentially at High Run Rates 6-4-24
1Q24 GDP: Looking into the Investment Layers 4-25-24
4Q23 GDP: Final Cut, Moving Parts 3-28-24
GDP and Fixed Investment: Into the Weeds 1-25-24
Tale of the Tape: Trump vs. Biden 12-4-23
Construction Spending: Timing is Everything 12-1-23
3Q23 GDP: Fab Five 11-29-23
Fixed Investment in GDP: The Capex Journey 10-30-23
GDP 3Q23: Old News or Reset? 10-26-23
Construction: Project Economics Drive Nonresidential 10-2-23
US Debt % GDP: Raiders of the Lost Treasury 5-29-23