
Footnotes & Flashbacks: State of Yields 2-9-25
The UST curve brought duration relief, but the big UST drivers are still ahead in tariffs and budgets.


The Grand Plan? 18-hole golf course, some timeshares, investors lining up, no cost to US taxpayers, no retaliation, no security needed.
Another week came and went with cavernous open items remaining subject to speculation across tariffs, the debt ceiling, budget priorities, which campaign pledges will get shredded, and how deportation will flow into labor imbalances by industry.
We get a fresh CPI reading this week coming off Friday’s constructive jobs report and a sharp upward move in consumer inflation expectations that rattled some headlines in a week that saw duration rewarded (see Mini Market Lookback: Simply Resistible! 2-8-25, Footnotes & Flashbacks: Asset Returns 2-9-25).
We update the 2Y to 10Y slope as the 2Y popped higher this week and the 10Y moved lower. FOMC actions are more likely to stay guarded, while the Treasury conveyed its focus on the 10Y and less on fed funds. Trump even reversed himself and indicated the Fed did the right thing a week after he said the opposite.
China tariffs will roll in and the week should see an articulation in some form of Trump’s reciprocal tariff plans. The USMCA plans are anything but reciprocal, but the latest twist has applications to numerous trade partners and major economies.
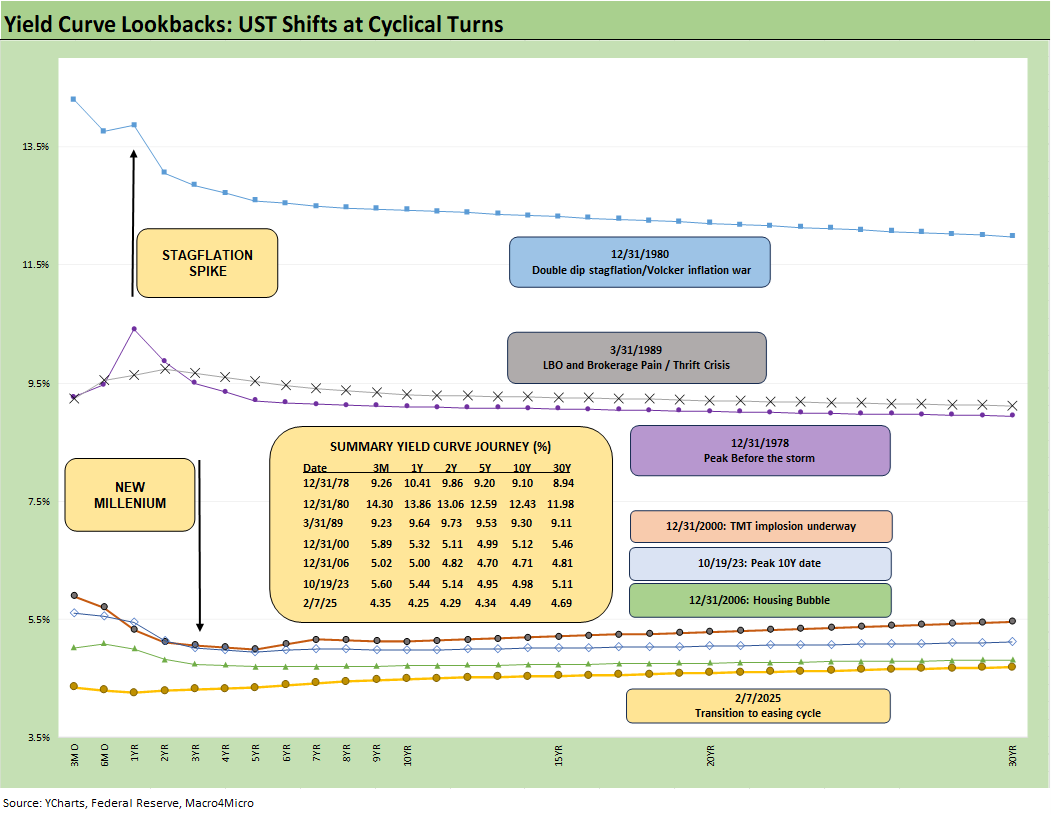
The above is our recurring chart that clearly shows how low the UST rates are in historical context when framed against the pre-crisis, pre-ZIRP histories that are free of the intrinsic ZIRP and QE distortions (i.e., pre-2008). We choose UST dates that reflect significant transition points in economic cycles or credit cycles. We also include 10-19-23 as the post-crisis, post-COVID peak in the 10Y UST after the last tightening cycle action of 2023 but before the easing cycle of 2024 that began in Sept.
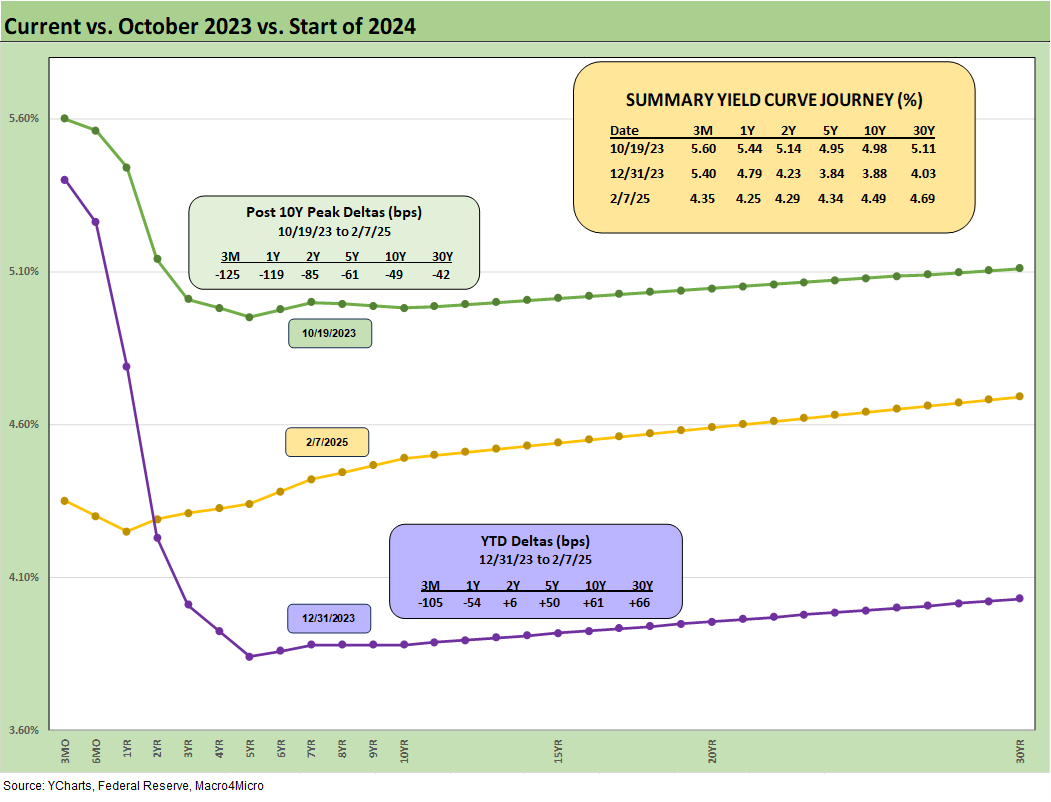
The above chart frames the migration and UST deltas from the 10-19-23 peak on the 10Y UST. We also show the moves from the start of 2024, when the market consensus for a bull flattener ended up as a bear steepener even with the easing since the fall of 2024 (see Footnotes & Flashbacks: State of Yields 12-29-24, Footnotes & Flashbacks: State of Yields 1-1-24).
We still see a material upward move beyond 2Y UST since the start of 2024 even with the easing on the front end. The chart also captures a very bullish downward shift from 10-19-23 that has lost some steam on the long end in recent whipsaws but rallied again this week.
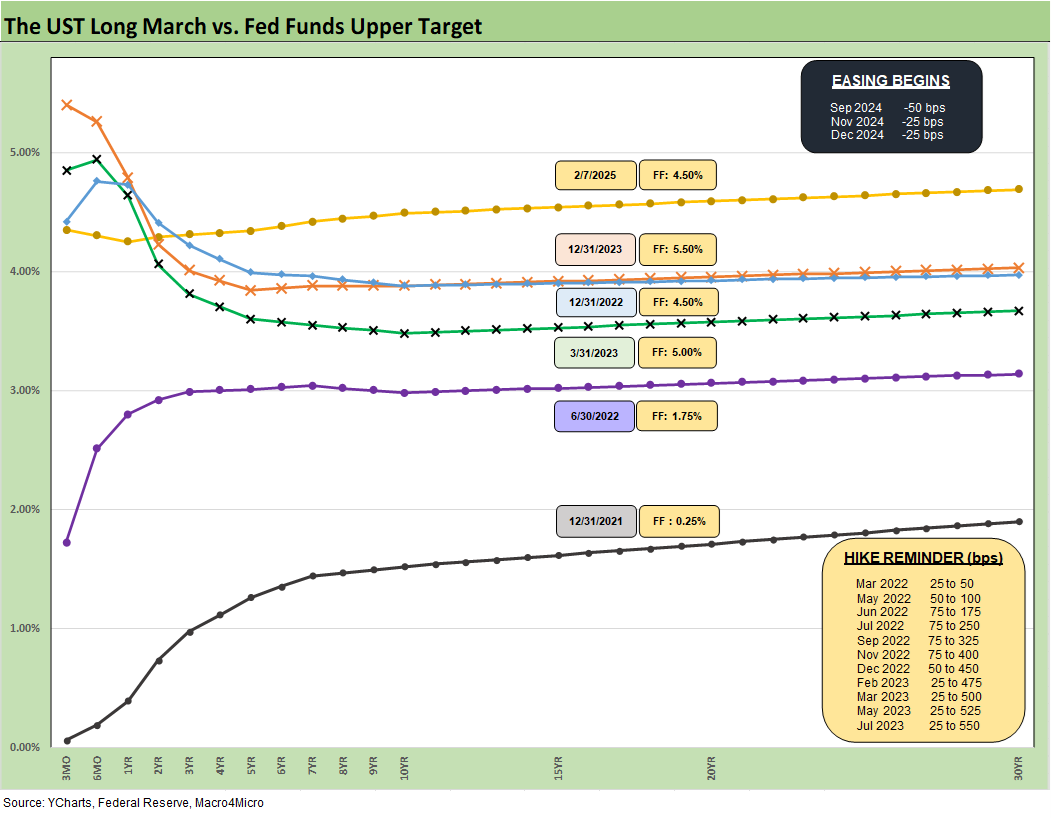
The above chart updates the migration from the end of 2021 and the days of ZIRP across the tightening cycle of 2022 and 2023 and then across 2024 into early 2025. We include a memory box to date the tightening cycles timing and magnitude and also a smaller box with the late 2024 easing moves.
We include the March 2023 downshift in the curve as a reminder of the regional bank crisis, but the trend in the long end across 2024 has been one of higher long rates and a steeper curve. The short end came down in 2024 while we see the long end higher in a bear steepener pattern.
For YTD 2025, we see the long end deltas modestly moving lower (a separate chart below). The debate rages on around where the 10Y can move from here in the face of record deficits, record supply and expectations of pricing pressure and inflationary forces from tariffs and labor market disruptions. The hope for an oil price crash to ease inflation from the “drill, drill drill” mantra sounded better in campaign meetings than in the capital budgeting planning of the upstream oil and gas companies who are likely to have learned from the 2014-2016 experience.
The desire to generate high GDP growth, lower inflation, lower trade deficits, lower taxes, and higher defense among other initiatives makes for tough math. While Trump’s recent statements that defense spending will be lower and that Musk will ring out waste, fraud and abuse in the Pentagon, Congress will look to raise defense spending – as will Trump. There are just too many priority programs he has favored. The defense spending targets as % GDP (e.g. 5%) that Trump demands of allies are inconsistent with his mixed statements on the US Pentagon budget.
In the end, it all means a much higher supply of UST that will need to clear the markets.
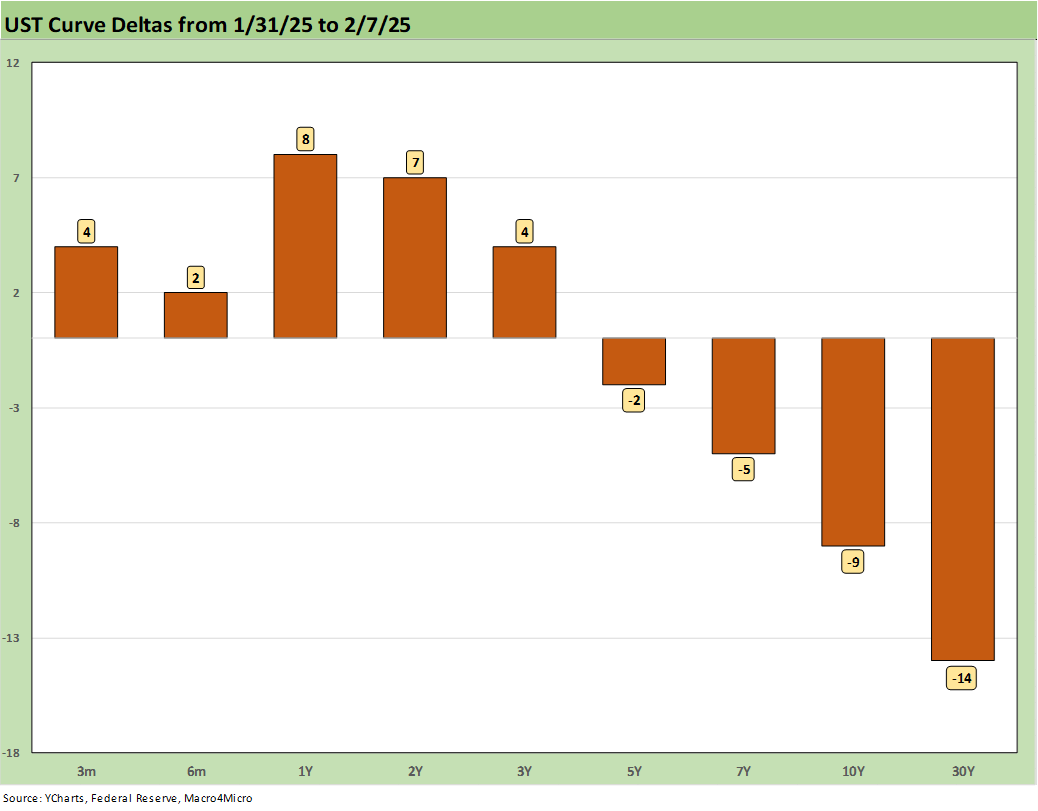
The above chart updates the 1-week period and shows a rally out past 5 years with yields moving higher on the short segment. The UST market is still materially wide to the Sept 2024 lows but most of the big moving parts of the inflation picture remain to be played out. Tariffs, debt ceilings, and the actual budget plan from the House (1 big “beautiful” plan ) or two plans from the Senate are going to get into some very lofty numbers and need to pass reconcilitation.
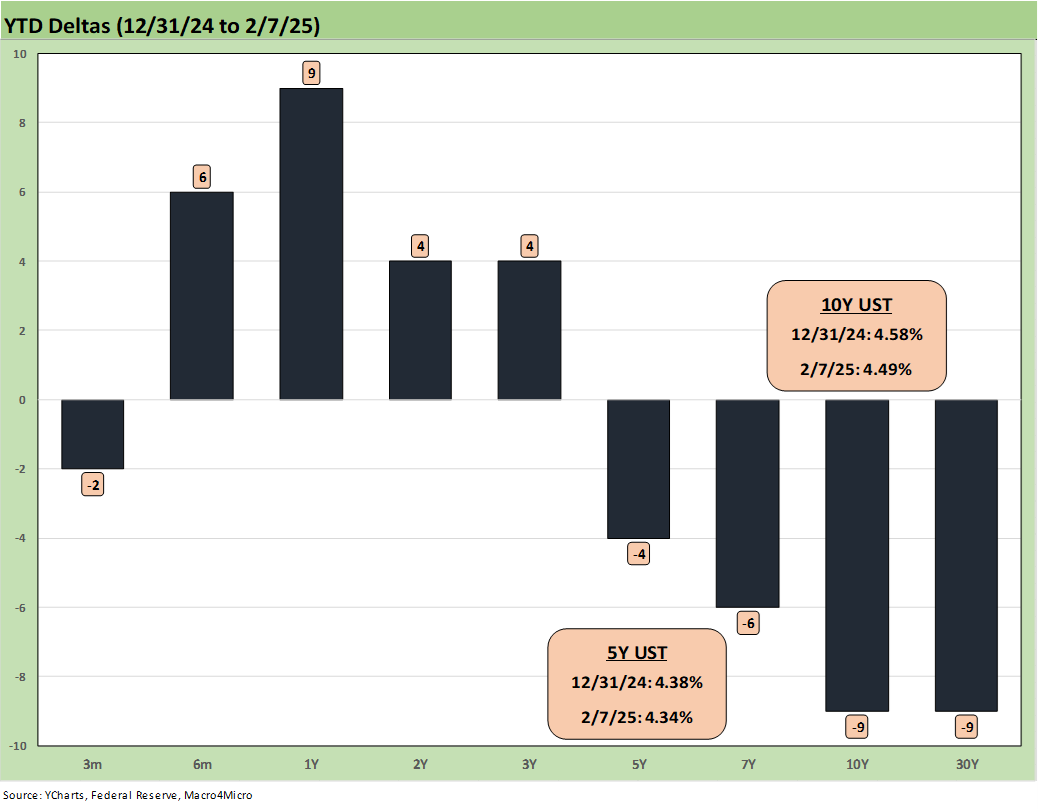
The above chart updates the YTD UST deltas with the 5Y UST lower and 10Y UST now lower YTD.
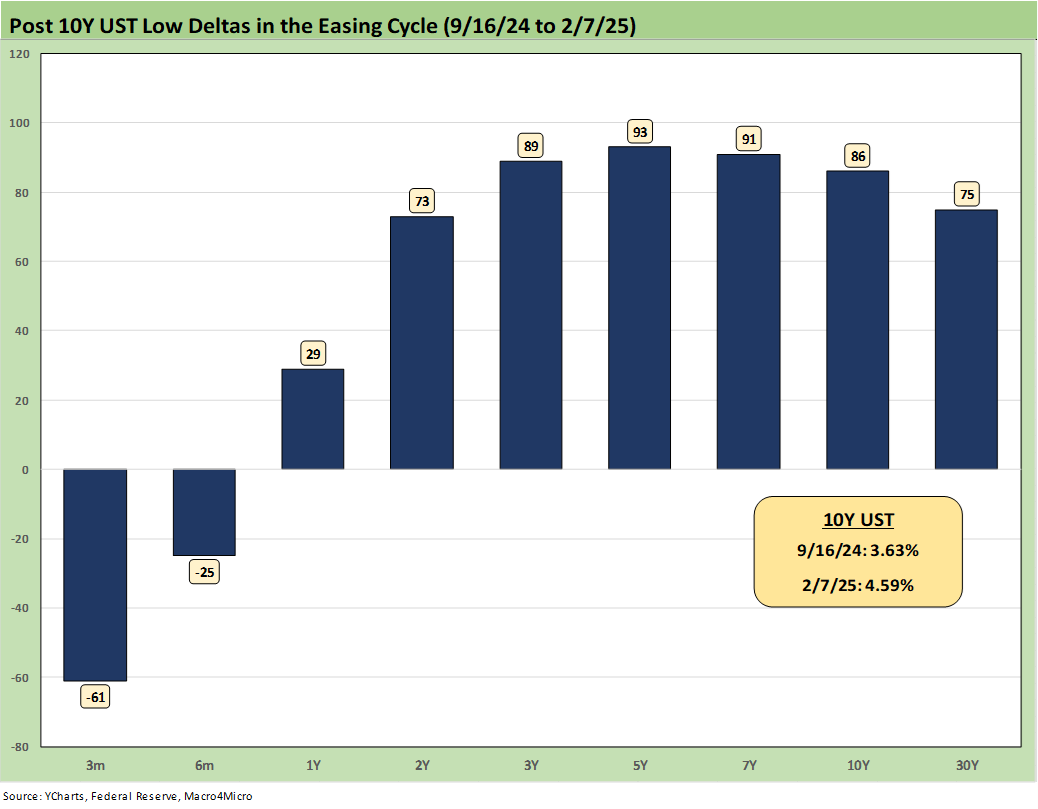
The above updates the UST deltas from the low point on the 10Y UST in mid-Sept 2024. The pattern is still a bear steepener even after the long end rallies from the recent highs of 2025.
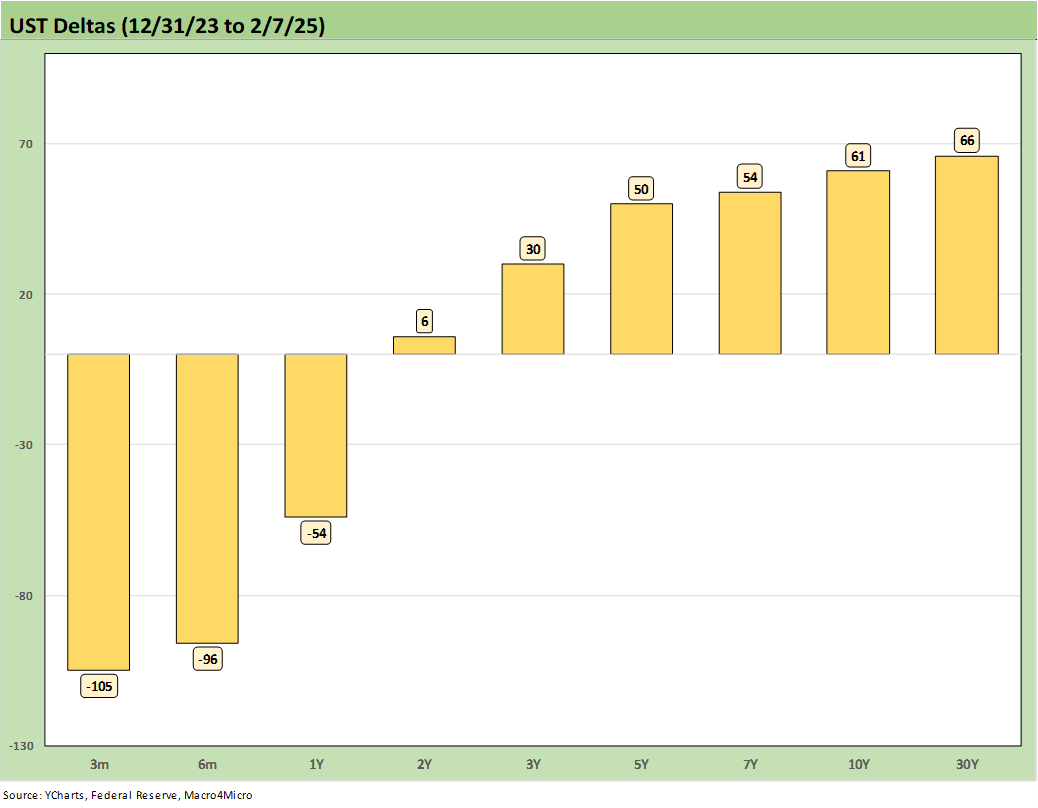
The above updates the running UST deltas from the end of 2023. We see the easing on the front end and steepening out past 2Y UST.
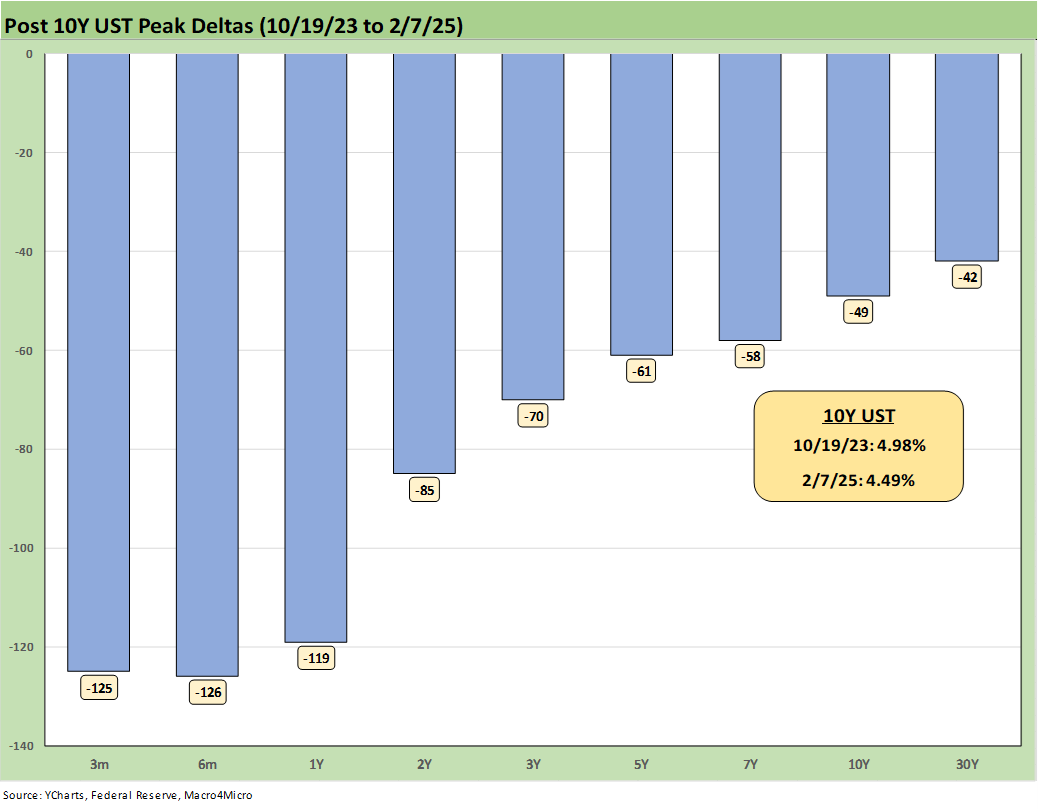
The above chart updates the running US deltas from the 10-19-23 peak. There are defensible scenarios where the long end reverts back to the 5% area for 10Y. Those scenarios are wrapped around inflation setbacks and a UST supply boom. The market will necessarily be on the lookout for such risks.
In many cases, investors would be less worried without the tariff excess and “unique” theories on how tariffs work in practice in global trade. It is safe to say 99.9% of investors know the “buyer pays” in tariffs. Washington seems to have a lower number on that.
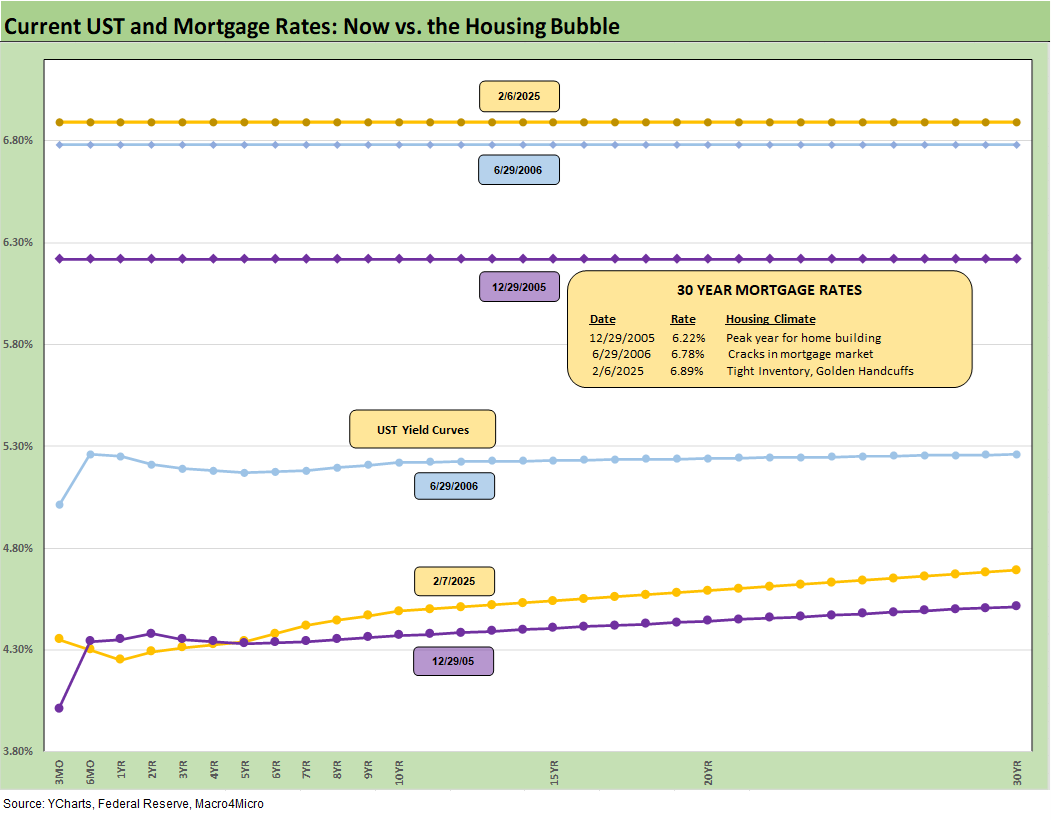
The above chart updates the recent yield curve and Freddie Mac 30Y benchmark (horizontal lines). We include two useful historical comps including the end of 2005 when homebuilding peaked and one for mid-2006 as excess RMBS origination was raising flags after record mortgage levels. We include the UST curves for each key date. Mortgage rates are higher now than 2006 despite a materially lower UST curve today.
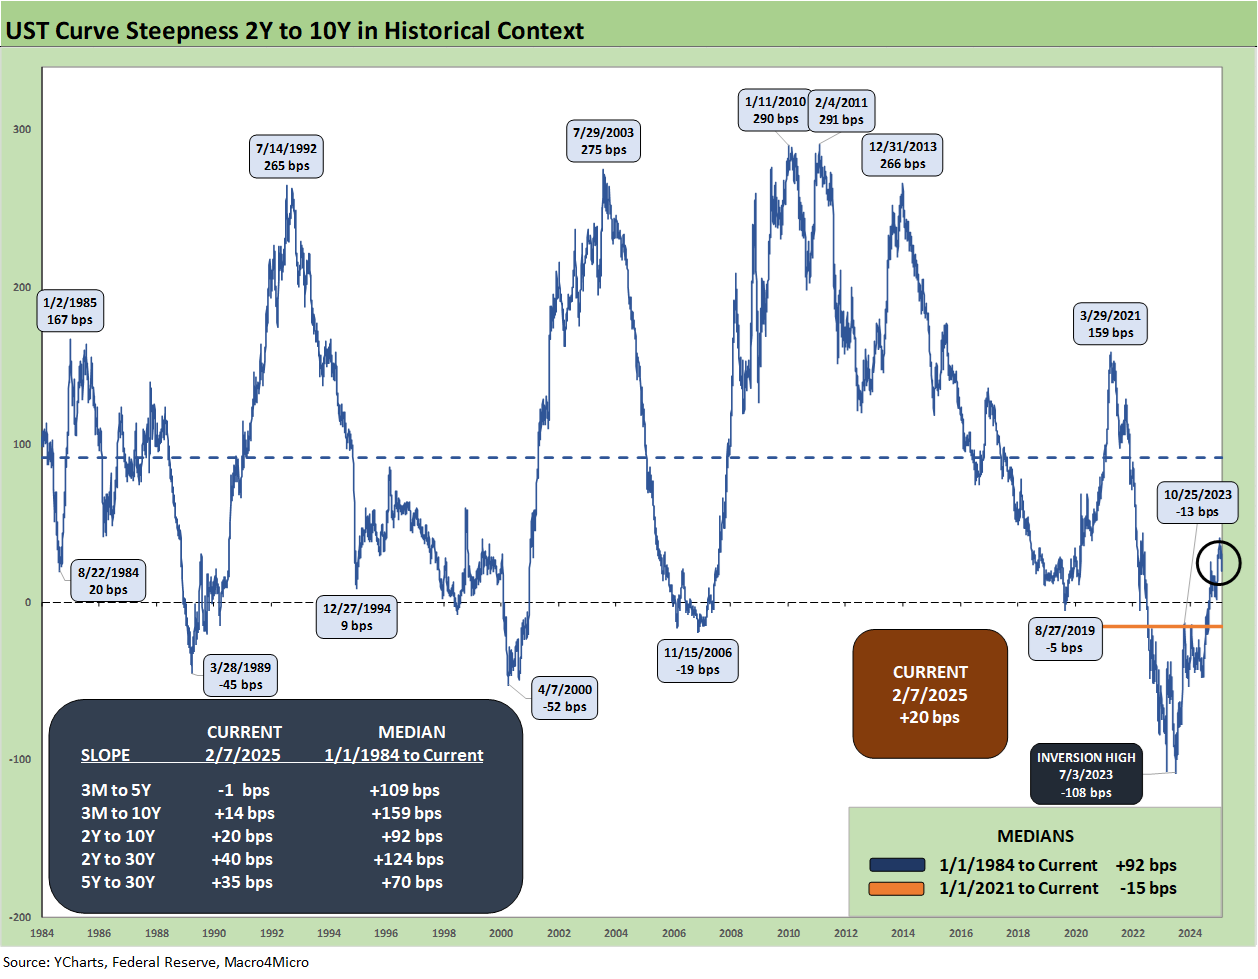
We update the 2Y to 10Y UST slope as the slope compressed by -16 bps from last week to +20 bps with the 10Y lower and 2Y higher. That is still well inside the long-term median of +92 bps.
You can sit around playing with the 2Y and 10Y yields we break out in the earlier charts, but the fact that the current slope is -72 bps below the median and the short end has only a modest downward bias near term does not bode well for the 10Y UST moving back to 3.6%.
The idea that the long end will chase an FOMC cut (or two) to lower levels on the longer end of the UST curve is quite optimistic. Inflation would need to be very cooperative or a flight-to-quality shift unfolding. That latter scenario on quality fears implies unfavorable trends in multiasset context. In the event there is in fact a flight to quality, there will be no shortage of new UST supply based on the policies in Washington.
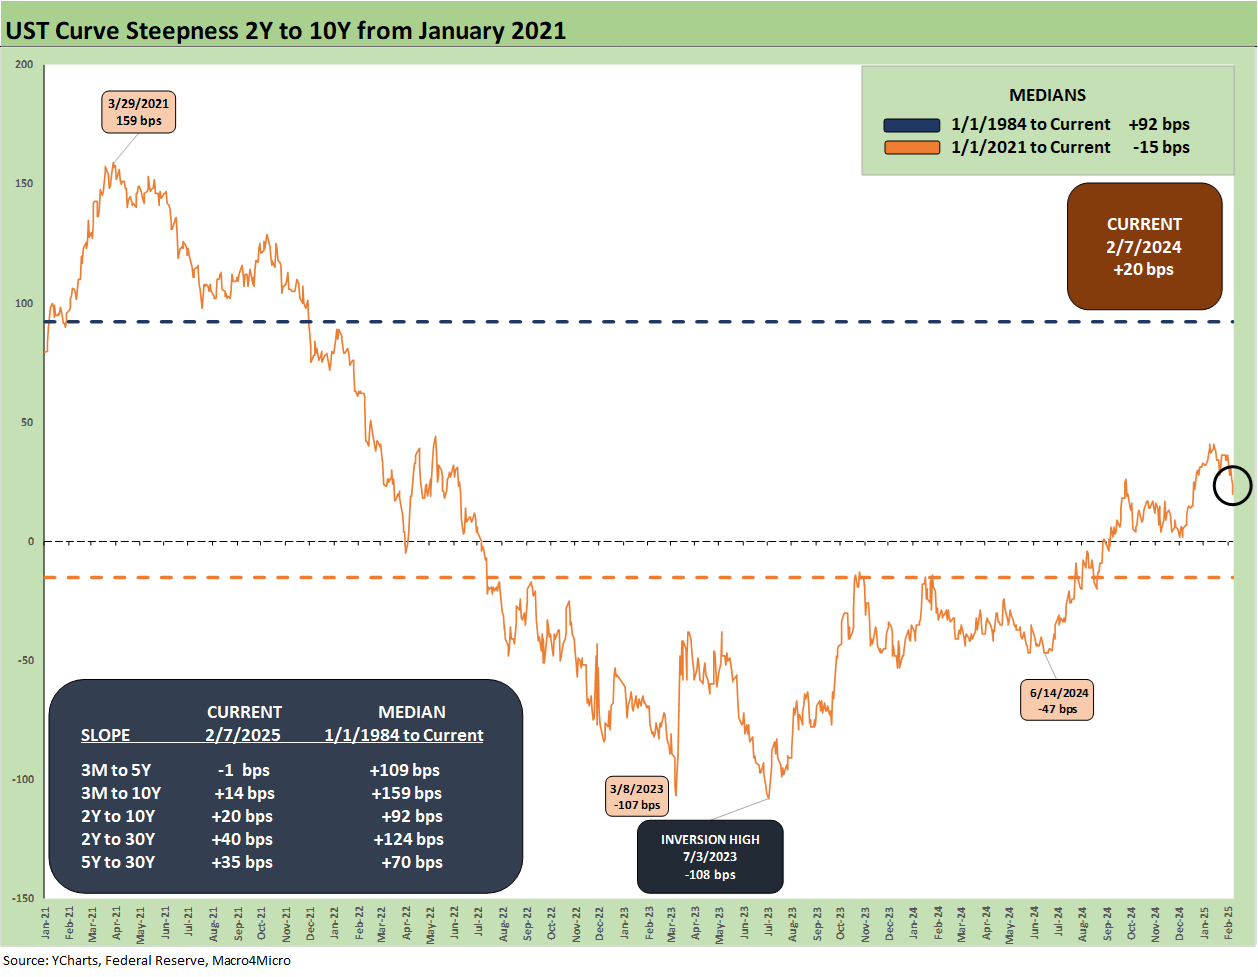
The above chart shortens up the timeline on the 2Y to 10Y slope from early 2021 and the ZIRP period. We see the steepening to a peak of +159 bps in March 2021 before the plunge to an inversion of -108 bps during July 2023 before the path back to +20 bps this week. Over the shorter time horizon, the median was around -15 bps vs. the long-term median of +92 bps.
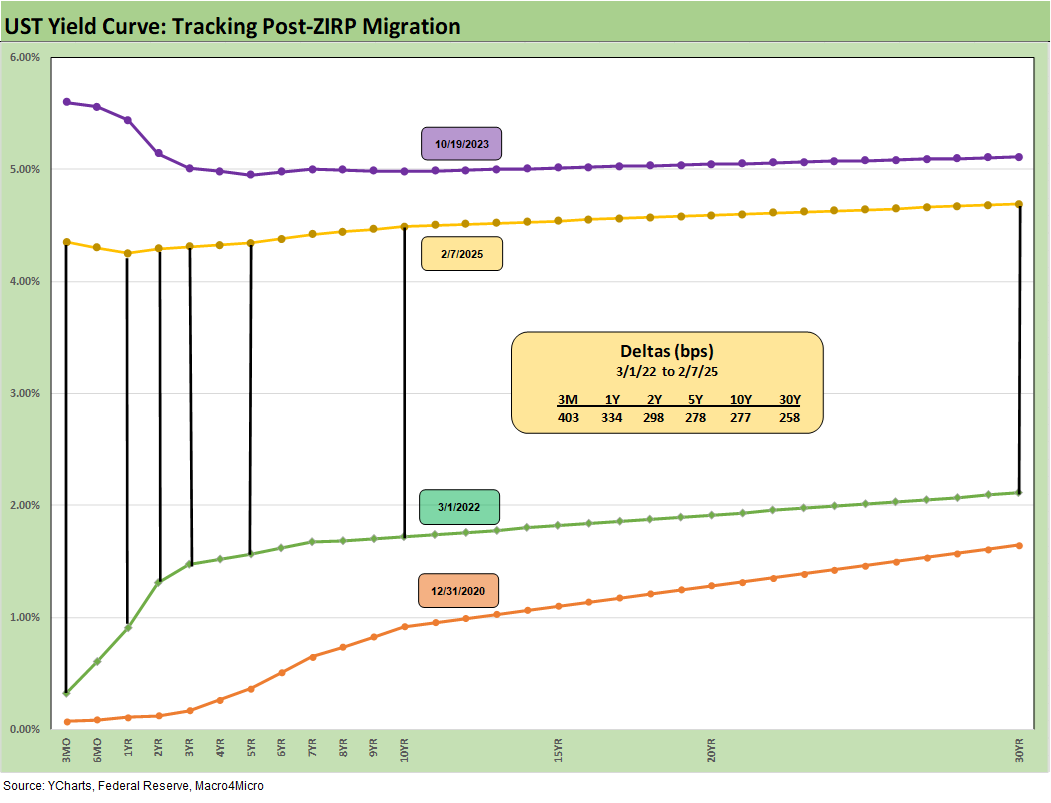
The final chart updates the running UST deltas from March 1, 2022, which was the month ZIRP ended (effective 3-17-22). The UST curve moves from low and steep to inverted and higher and now back to upward sloping and modestly lower in the long end vs. the 10-19-23 peak. The UST curve is clearly much closer to the peak of Oct 2023 than the starting point of March 2022. We also include the 12-31-20 UST curve as a frame of reference.
See also:
Footnotes & Flashbacks: Asset Returns 2-9-25
Mini Market Lookback: Simply Resistible! 2-8-25
Payroll Jan 2025: Into the Occupational Weeds 2-7-25
Payroll Jan 2025: Staying the Course, Supports FOMC Hold 2-7-25
Trade Exposure: US-Canada Import/Export Mix 2024 2-7-25
US Trade with the World: Import and Export Mix 2-6-25
The Trade Picture: Facts to Respect, Topics to Ponder 2-5-25
JOLTS Dec 2024: Before the Tariff JOLT Strikes 2-4-25
Footnotes & Flashbacks: Credit Markets 2-3-25
Footnotes & Flashbacks: State of Yields 2-2-25
Footnotes & Flashbacks: Asset Returns 2-2-25
Tariffs: Questions to Ponder, Part 1 2-2-25
Mini Market Lookback: Surreal Week, AI Worries about “A” 2-1-25
PCE: Inflation, Personal Income & Outlays 1-31-25
Employment Cost Index 4Q24: Labor Crossroad Dead Ahead 1-31-25
4Q24 GDP: Into the Investment Weeds 1-30-25
4Q24 GDP: Inventory Liquidation Rules 1-30-25
Credit Crib Note: Lennar Corp 1-30-25
D.R. Horton: #1 Homebuilder as a Sector Proxy 1-28-25
Durable Goods Dec 2024: Respectable ex-Transport Numbers 1-28-25
New Home Sales Dec 2024: Decent Finish, Strange Year 1-28-25