
Footnotes & Flashbacks: Credit Markets 12-2-24
Mild spread widening on the week was overshadowed by strong equities and a duration rally.


I knew this guy Patel would go overboard…
The credit markets are winding down the year in style ahead of the inevitable mid Dec slowdown with payroll teed up for this week and CPI in week 2 on the lead-in to the FOMC meeting and action in week 3. The duration rally this week offered some bond return relief after a tough stretch since the Sept lows (see Footnotes & Flashbacks: State of Yields 12-1-24).
The tariff noise has not dented the market yet, but the cascading array of tariff threats still have not touched the likely EU attack (so far). For now, Trump has aimed 25% at Canada and Mexico, some add-ons against China, and then 100% tariff threats against the disorganized BRICS group looking for a currency and payment system alternative.
The tariff headlines have kept the noise level high but senses increasingly dulled as the consensus is that it is part bluff and part headline addiction (see Tariff: Target Updates – Canada 11-26-24, Mexico: Tariffs as the Economic Alamo 11-26-24).
For portfolios and credit risks, the market is winding down the first back-to-back 20% return S&P 500 years since the 1990s and only the 4th since the roaring twenties with HY spreads not far from June 2007 lows (see Footnotes & Flashbacks: Asset Returns 12-1-24).
With equities so strong and the economy cruising along, it is a challenge for credit markets to discount in so many uncertain scenarios with revenue and earnings positive, equities hot, banks healthy, and private credit as a backstop for the low end and home for the most aggressive deals.

The above chart updates the YTD total return and excess returns for IG and HY and the credit tiers. We already drilled into the asset return mix in our separate Footnotes publication on asset returns, and the breadth of the asset rally from large cap to small cap and a wide range of industry groups made a very good asset allocation case for staying the course. So far, the optimism has not been seriously dented by the wide range of outcomes that could be on the other side of ill-conceived trade and deportation policies and questions around inflation resurgence.
The obvious question is how to frame the tariff ambitions of a President who might still believe that Mexico, Canada, and China pay the tariffs? The most troubling part is you really don’t know if he believes that. Between his nominee list and massive tariff goals, it takes on the flavor of a massive banzai charge that will cow the Senate. In Trump 1.0, Toomey and Corker tried to enact legislative checks on the use of Section 232 tariffs and introduce a bill to control that practice. They are no longer in the Senate (cause and effect). The lessons were learned in the Senate, which amounted to “Rational economic policy can be hazardous to your primary. You must obey. Or retire.”
The years 2023-2024 have richly rewarded risk maximization as reflected in banner equity returns. The lower tiers of HY have seen spread contraction and attractive excess returns that mitigate some of the duration headwinds that had been felt for much of 2024 with the upward shift in the UST curve beyond the 2Y (see Footnotes & Flashbacks: State of Yields 12-1-24).
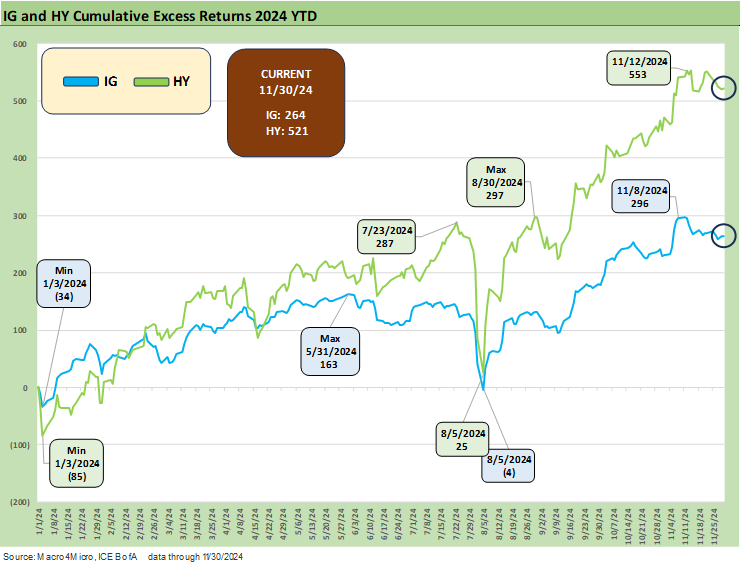
The above chart updates the running excess returns for IG vs. HY, and the rule of getting paid more for taking more risk has been satisfied. The excess returns have been rational across 2024 to a point where spread levels (addressed in detail below) have been able to run to levels in line with the credit cycle peaks of 1997 and 2007.
A very important distinction in the current credit cycle has been the higher quality mix of the HY index on favorable fundamental trends in earnings and balance sheet metrics for most bellwether issuers. A strong consumer cycle and very high rate of fixed investment along with expanded state and local budgets all kept driving favorable earnings trends. The risk rally has been steady coming off the sustained post-COVID recovery that was accompanied by a range of legislative initiatives supporting investment and payrolls (infrastructure, CHIPS, IRA etc.).
As we have discussed in prior commentaries, the higher quality mix of HY includes the migration of the most leveraged and aggressive private equity deals over to the private credit space. If credit markets see fallout from deal quality, the repricing risk will not fall quite as hard on the historical gap risk in that weak B to CCC tier. HY bond default forecasts also remain very low in historical context. There are plenty of forecasts out there from the rating agencies, a few major banks, and leading credit analysis firms (CreditSights, etc.). No matter what the outcome in loans and private credit, HY bond default rates will remain below average in 2025 barring some cataclysmic 7-standard deviation outcome.

The above chart tracks the BBB vs. BB excess returns and that relationship remains unusually compressed across 2024 with strong fundamentals and the increasingly blurred lines of traditional BBB buyers and BB buyers with the proliferation of HY Lite strategies.
The potential for some disconnects and divergence in the BBB vs. BB tier spread relationships would require some major trouble in the BBB tier and downgrades that disrupt pricing of falling angels. That is notably the case with a heavy base of long dated BBB paper that could come under pressure. That sort of digestion problem on BBB to BB bond repricing can lead to trouble in BBB and BB tier quality spread differentials during the adjustment period.
The lack of natural buyers of HY rated long bonds from fallen angels with IG covenants has always been a tricky repositioning when ratings agencies balk. That would require a lot to go wrong from here cyclically but also in terms of Trump policy actions (as distinct from noisemaking). Some of the proposals he has put up for consideration are so bad that they are hard to take seriously. That might be a bad assumption with this character.
You can always talk yourself into a panic (25% tariffs roll in, trade partners retaliate, China puts Boeing “in the box,” rating agencies get trigger happy in ratings, etc.) and then a wave of quality spread decompression (i.e. widening) could kick in along with name-specific issues.
With names such as Boeing under a rising level of stress and the auto industry under increased scrutiny, the BBB heavy auto sector appears to be wading into their latest set of problems. As someone who covered them on and off since the early 1980s, credit market challenges are hardly new to the supply-heavy auto issuers. Ford is on the cusp and GM just above them. The curse of Chrysler appears alive at Stellantis.
For autos, some of the issues now are issuer specific (Stellantis and Ford) and some are product driven (EV costs and cash bleeding for everyone except Tesla). The tariff uncertainty is the biggest emerging topical risk for the auto supplier-to-OEM chain. Tariffs that Trump has put on the table would severely and adversely impact autos and suppliers and a range of industries that supply Mexico operations. That is even before any new surprises that could come with the EU (the largest trade partner as a bloc), which is very important to broader cyclical trends even if less important to autos than the Mexico and Canada operations and those supplier chain issues.
The auto risk trends are for separate commentaries, but it is hard to see a way out of the negative trends that would hit autos on the tariff risk and EV headwinds alone at this point. With the CEO of Stellantis stepping down over the weekend and autos the epicenter of NAFTA/USMCA tariff stress plus additional strain from EV bleeding (and Trump’s vocal animosity toward mass produced EV plans), much is hanging over the 2025 auto outlook.

The above chart updates the “risk wins” story in the bottom tier of HY as we have addressed in numerous past commentaries. The B to CCC tier history is playing out better than would have been expected (see The B vs. CCC Battle: Tough Neighborhood, Rough Players 7-7-24).

The IG OAS move was slightly wider on the week by +3 bps to +83 bps after reaching a low of +77 bps for a few days earlier this month.

HY OAS ticked wider by +13 bps this past week to +274 bps, which still qualifies as a multi-cycle low range well inside of the lows of Dec 2021, Jan 2020, Oct 2018, and June 2014. The +260 bps from earlier on Nov 14 makes a statement. The June 2007 and late 1997 periods remain the logical comps from history (see HY OAS Lows Memory Lane: 2024, 2007, and 1997 10-8-24, HY Spreads: Celebrating Tumultuous Times at a Credit Peak 6-13-24 ). That said, the quality mix today is higher than in those bygone years with the BB heavy index and less late cycle LBO excess in the mix.

The “HY OAS minus IG OAS” was already addressed in our weekly Mini Market Lookback: Tariff Wishbones, Policy Turduckens commentary. The +191 bps quality spread differential remains near the lowest since mid-2007 and modestly above the Nov 2024 lows of +180 bps. It is well inside the +327 bps long-term median.

The “BB OAS minus BBB OAS” quality spread differential widened out this week with the BB widening of +10 bps vs. BBB tier widening of +3 bps. The +65 bps differential is only +10 bps higher than the July 2024 lows and comparable to the quality spreads seen in the credit cycle peaks of Oct 2018, and Dec 2019, and in early 2022 just as the tightening cycle was getting underway. The +65 bps is around half the long-term median of +135 bps.

The BB tier OAS of +168 bps is +11 bps wider than the +157 bps of mid-Nov and +10 bps wider on the week. These spreads are more in line with the late May 2007 and June 2007 lows and very compressed vs. the long-term median of +300 bps.

The B tier has been a key driver of performance in 2024 at -68 bps tighter YTD. The +273 bps is off the lows of +254 bps earlier in mid-Nov and impressively tight to the +468 bps long term median.
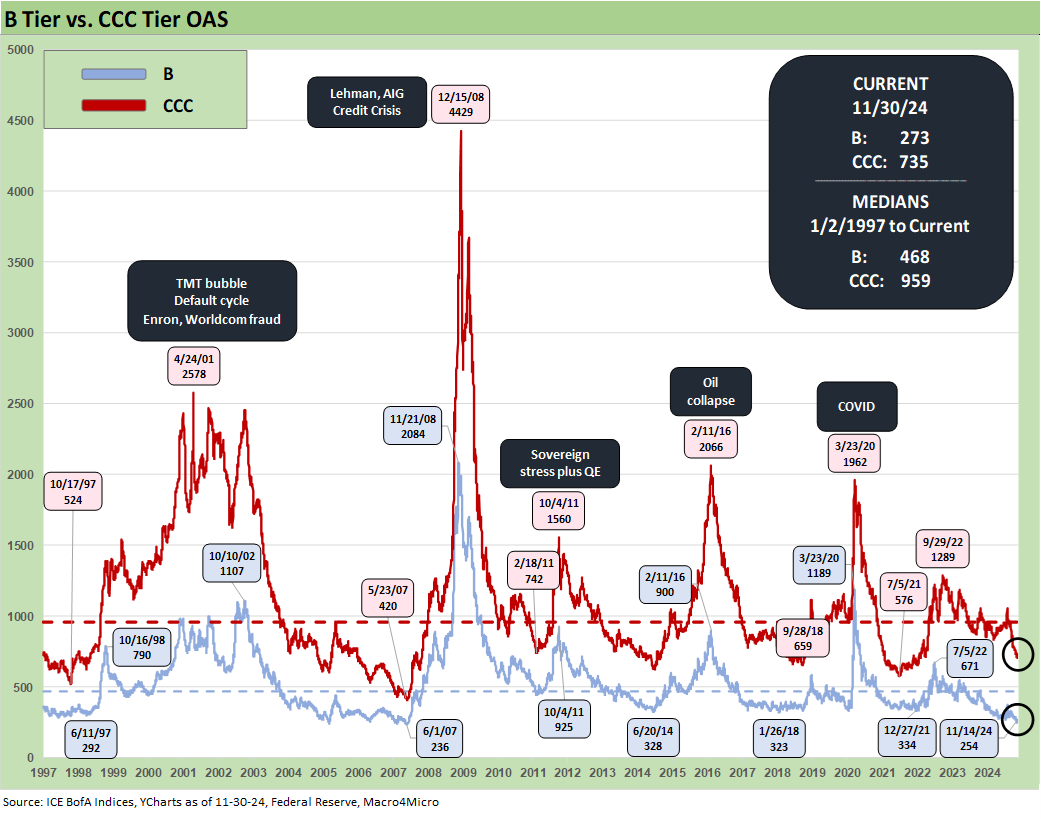
The above chart updates the long-term time series for the B and CCC tier OAS to help highlight the periods of disconnection and material divergence between the two as CCC bonds gap wider and start behaving more like high-risk equities. The CCC tier remains more sensitive to constituent migration and the distortion of drop-ins and dropouts (notably defaults). The current +735 bps for CCC is well inside the long-term median of +959 bps.
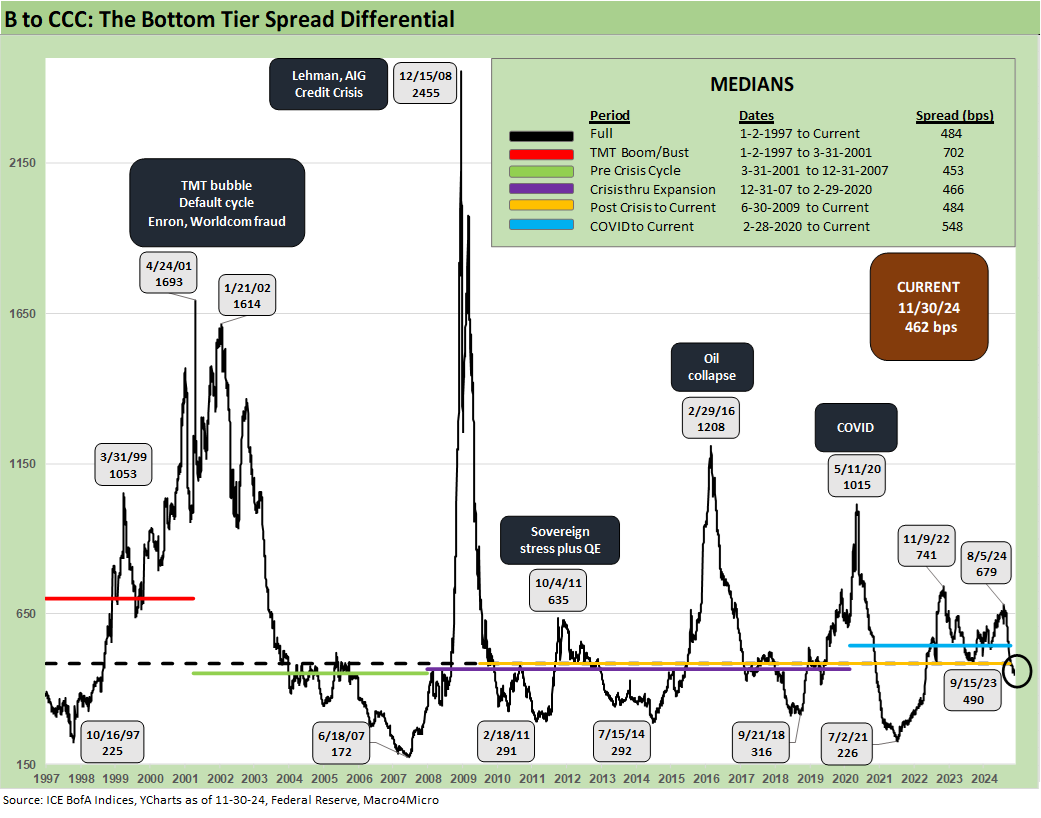
The above chart frames the quality spread differential between the B and CCC tier across the cycles, and the spread gaps (or dollar price gaps) between the two across time is obvious. As we detailed in our commentary on these histories in The B vs. CCC Battle: Tough Neighborhood, Rough Players 7-7-24, there were times when quoting the differences in dollar prices made more sense with spreads so wide and the bonds were about dollar price targets relative to theoretical recovery rates.
Among some notable trends across the cycle on differentials, we would highlight some major dollar price differentials along the way including when the CCC tier hit a 42.9 dollar price low in Oct 2001 after the CCC YTW hit a 28% yield in late Sept 2001. During some of the worst credit cycle dislocations, the “B minus CCC” dollar price gap soared to 43.5 (Jan 2002). That was wider than the later credit crisis with the B minus CCC dollar price at 31.9 (Feb 2009). The difference in the credit crisis in late 2008/early 2009 was that everything plunged in price.

The above chart shortens the timeline to focus more on the recent swings between the B and CCC tiers since just before the tightening cycle in early 2022. The OAS swings include a tightening cycle induced widening and then a rally in quality spreads. We saw more than a few distortions from the constituent mix including distressed exchanges and some below average defaults along the way.
A look at some yields…

The above chart updates the current IG vs. HY index yields across the cycles and we also break out some key timeline medians. As we routinely highlight, we prefer pre-crisis, pre-ZIRP medians (6.1% IG, 9.3% HY) as the most relevant for a long-term perspective since the ZIRP, QE, and normalization periods distorted the UST curve lower since 4Q08. The long-term median of 4.7% for IG and 8.0% for HY includes a long stretch of ZIRP and limited post-ZIRP normalization policies before a return to ZIRP from March 2020 to March 2022.

The above chart updates the IG index yield for Nov 30 close on the horizontal line and frames it against prior credit cycle peaks of June 2007 and late 1997. We also include the UST curves for relevant dates.
As detailed above in the spreads section, we currently see IG spreads at +83 bps or near multicycle lows. IG spreads are below mid-2007 (mid to high +90s bps in June 2007 and +100 bps to end June 2007) and close to late 1997. The all-time low tick of +53 bps in Oct 1997 was a world apart. IG spreads ended 1997 at +70 bps. The current market posts the lowest UST curve of the mix to compound the all-in yield challenge.

The above chart does the same update exercise for the HY Index yields for the same credit cycle comp dates we used for IG in the prior chart. With HY spreads near the June 2007 period lows, the combination of tight spreads with a materially lower UST at Friday close has the unsurprising result of a low 7.16% HY index yields vs. the long-term median of 8.0% and the pre-crisis, pre-ZIRP median of 9.3%. As a frame of reference on ZIRP impacts, the median for HY from the start of Sept 2008 to the start of March 2022 saw HY index yields at +6.4% and IG yields at +3.3%.
See also:
Footnotes & Flashbacks: State of Yields 12-1-24
Footnotes & Flashbacks: Asset Returns 12-1-24
Mini Market Lookback: Tariff Wishbones, Policy Turduckens 11-30-24
PCE Inflation Oct 2024: Personal Income & Outlays 11-27-24
3Q24 GDP Second Estimate: PCE Trim, GPDI Bump 11-27-24
New Home Sales Oct 2024: Weather Fates, Whither Rates 11-26-24
Mexico: Tariffs as the Economic Alamo 11-26-24
Tariff: Target Updates – Canada 11-26-24
Mini Market Lookback: Market Delinks from Appointment Chaos… For Now 11-23-24
Credit Crib Note: Ashtead Group 11-21-24
Existing Home Sales Oct 2024: Limited Broker Relief 11-21-24
Housing Starts Oct 2024: Economics Rule 11-19-24
Mini Market Lookback: Reality Checks 11-16-24
Industrial Production: Capacity Utilization Circling Lower 11-15-24
Retail Sales Oct 2024: Durable Consumers 11-15-24
Credit Crib Note: United Rentals (URI) 11-14-24
CPI Oct 2024: Calm Before the Confusion 11-13-24
Mini Market Lookback: Extrapolation Time? 11-9-24
The Inflation Explanation: The Easiest Answer 11-8-24
Fixed Investment in 3Q24: Into the Weeds 11-7-24
Morning After Lightning Round 11-6-24
Payroll Oct 2024: Noise vs. Notes 11-2-24
Select Histories:
Tariff: Target Updates – Canada 11-26-24
Mexico: Tariffs as the Economic Alamo 11-26-24
Tariffs: The EU Meets the New World…Again…Maybe 10-29-24
Trump, Trade, and Tariffs: Northern Exposure, Canada Risk 10-25-24
Trump at Economic Club of Chicago: Thoughts on Autos 10-17-24
HY OAS Lows Memory Lane: 2024, 2007, and 1997 10-8-24
Credit Returns: Sept YTD and Rolling Months 10-1-24
HY Industry Mix: Damage Report 8-7-24
Volatility and the VIX Vapors: A Lookback from 1997 8-6-24
HY Pain: A 2018 Lookback to Ponder 8-3-24
Presidential GDP Dance Off: Clinton vs. Trump 7-27-24
Presidential GDP Dance Off: Reagan vs. Trump 7-27-24
The B vs. CCC Battle: Tough Neighborhood, Rough Players 7-7-24
HY Spreads: Celebrating Tumultuous Times at a Credit Peak 6-13-24
Credit Markets Across the Decades 4-8-24
Credit Cycles: Historical Lightning Round 4-8-24
Histories: Asset Return Journey from 2016 to 2023 1-21-24
Credit Performance: Excess Return Differentials in 2023 1-1-24
Return Quilts: Resilience from the Bottom Up 12-30-23
HY vs. IG Excess and Total Returns Across Cycles: The UST Kicker 12-11-23
HY Multicycle Spreads, Excess Returns, Total Returns 12-5-23
US Debt % GDP: Raiders of the Lost Treasury 5-29-23