Footnotes & Flashbacks: State of Yields 12-1-24
We look at yields across a duration rally week that included big tariff threats, a mixed PCE release and a steady 3Q24 GDP update.
Look mommy! It’s a new tariff squirt gun!
The UST rally rewarded duration returns the past week as the market pushed right past the threats to slap 25% tariffs on our two largest trading partners in the NAFTA/USMCA deal and threatening China with even more tariffs (see Tariff: Target Updates – Canada 11-26-24, Mexico: Tariffs as the Economic Alamo 11-26-24).
Just for good measure, Trump threatened 100% tariffs on any BRIC nation (including China and a few top 15 trade partners) that would seek to circumvent the dollar as the reserve currency of choice or seek to build defenses against the ability of the US to slap sanctions on whatever target the White House sees fit.
The market is building in assumptions of no major trade clashes, no material retaliation, and little inflation impact as the UST cleared the week with a favorable set of UST deltas and duration outperformance that has been hard to come by in 2024 (see Footnotes & Flashbacks: Asset Returns 12-1-24).
The inflation handicapping and FOMC pulse reading will get another temperature check this week with payroll data and whatever new tariff headline spinning comes out of Truth Social, Canada, or Mexico.
The above chart updates the migration of the UST curves across the notable periods in pre-crisis years all the way back to the Carter inversion of 1978 ahead of the 1979 inflation spike. We focus more on the cycles before the distortions of the ZIRP and QE periods and the few post-crisis attempts at normalization before a fresh round of ZIRP with COVID.
We see those pre-crisis years as the most relevant to capture the history of yield levels and how today’s UST curve is positioned in historical context. That is, today’s UST yields are extraordinarily low and especially when framed against the 1970s and 1980s. As much as the markets and the new White House will promise lower yields and lower inflation, there is nothing along the historical timeline like the current UST demand needs and the tariff and deportation policy mix being teed up in 2025.
The above chart updates the UST shifts from the peak date for the 10Y UST curve (10-19-23) during the tightening cycle. We include the UST deltas in the boxes from 10-19-23 and 12-31-23 through this past Friday while also posting the related UST curves for the 3 dates.
For the YTD period, we see the upward shift in the UST and modest steepening from year end for maturities beyond 2 years. We also see how the fed funds action has flowed into the short end as the inversion beyond 3M declines.
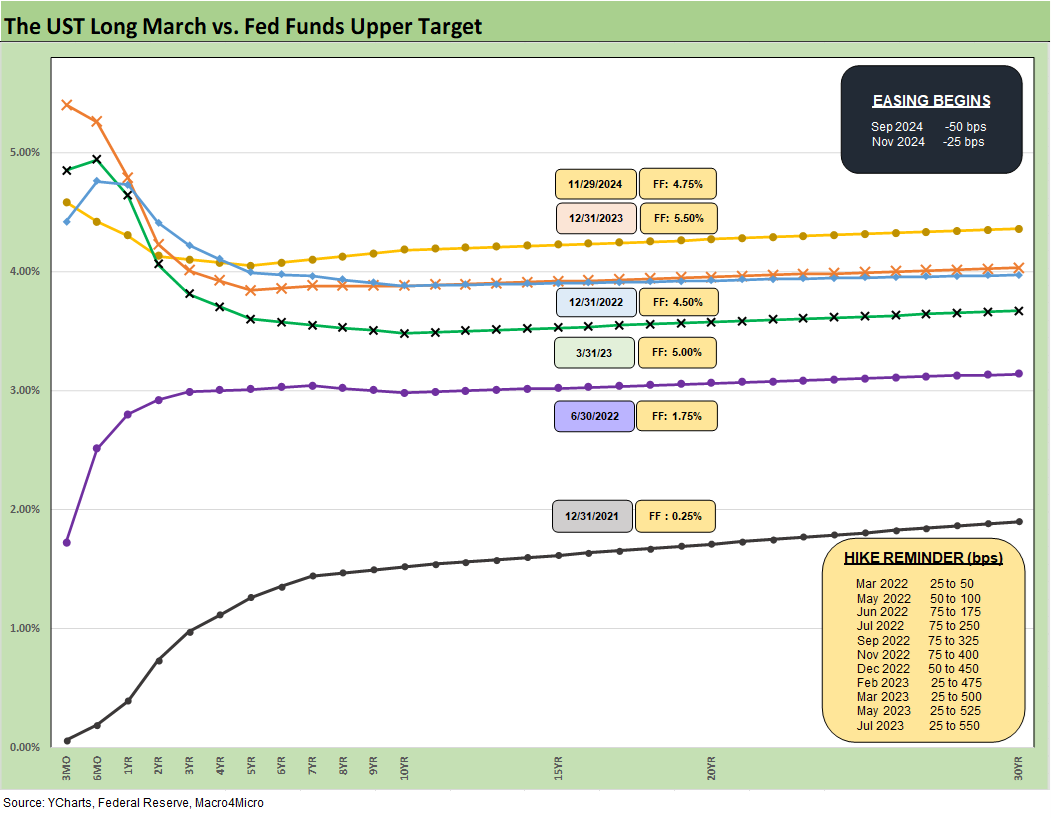
The above chart updates the migration of the UST curve from the ZIRP period at the end of 2021 across the tightening cycle of 2022 into 2023 before the easing cycle commenced in Sept 2024. We include memory boxes as reminders of the dates and magnitude of the tightening actions by the FOMC and now the easing dates with another -25 bps currently expected in Dec 2024.
The 100 bps differential between fed funds of 12-31-22 and 12-31-23 are notable since the 10Y area converged despite that fed funds gap. The year 2024 is likely to end with 100 bps differential again in fed funds. The idea that the 10Y has to follow the direction of fed funds (whether higher in 2023 or lower now) is suspect just given recent experiences.
The above chart just gives a different visual of the UST deltas for the past week with the 2Y to 30Y shifting down and delivering a healthy weekly duration return to bonds and bond ETFs as covered in the separate Footnotes publication on asset returns. The UST shift lower put the long duration UST 20Y+ ETF (TLT) on top for the week.
The above chart updates the YTD deltas across the curve that highlight the effects of the easing cycle inside the 2Y UST and the bear steepening beyond the 2Y UST out to 30Y.
The above chart updates the UST migration materially lower since the 10Y UST peak in Oct 2023 (10-19-23) for those considering extension out the UST curve. The debate will be raging ahead around how much juice is left in duration from this point. The bull view is we were just at 3.6% on the 10Y in Sept 2024 while the skeptics will point at a kamikaze budget deficit that demands a much-enlarged investor base including countries such as China.
So much budget has been used to “buy love” from so many constituencies that it will be hard to backpedal on much higher deficits. The shift to such high and broad tariffs will need to flow into prices or out of earnings since (drum roll) the buyer pays the tariff – not the seller – despite Trump’s claim to the contrary. That means higher costs (lower earnings of the buyer) or higher prices charged to the customer. Simple enough. But you can get an argument from the next White House resident.
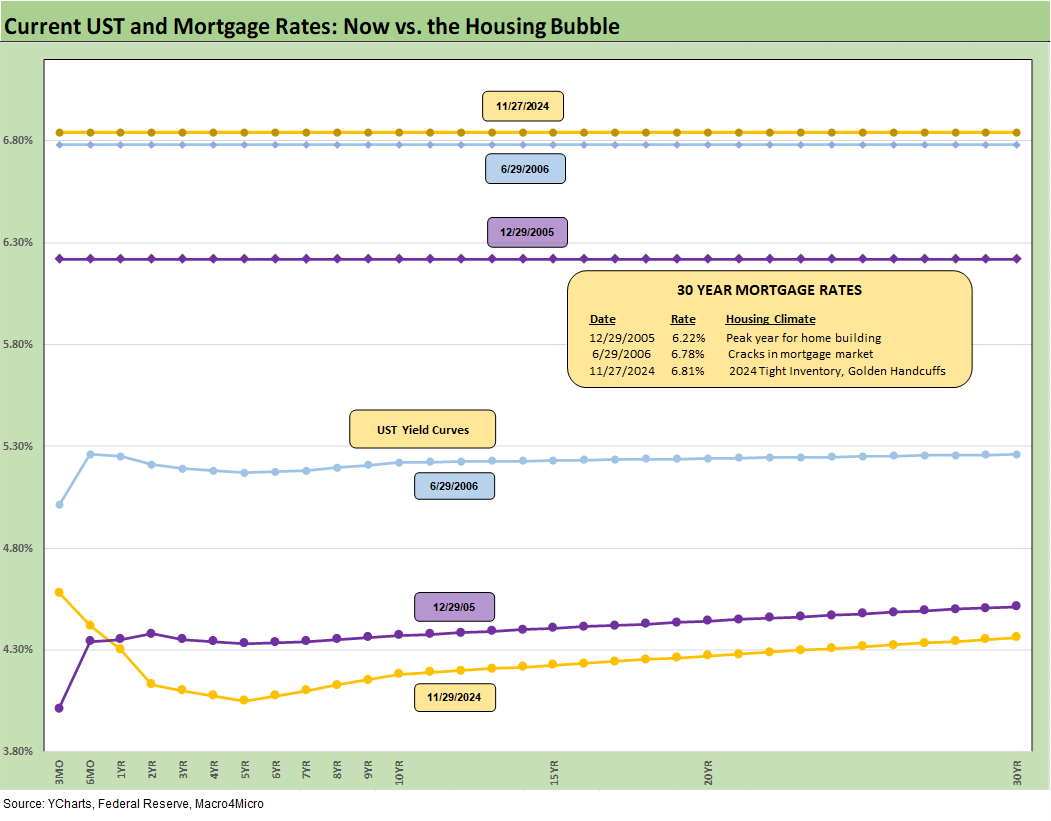
The above chart details the Freddie Mac 30Y benchmark mortgage rate for this past week. We also frame current rates vs. the levels in the peak homebuilding year of 2005 and for mid-2006 when RMBS anxiety was flaring up. We include the UST curve for the same dates. Today’s UST curve is the lowest of the lot for 10Y UST and yet the current 30Y mortgage rate is the highest.
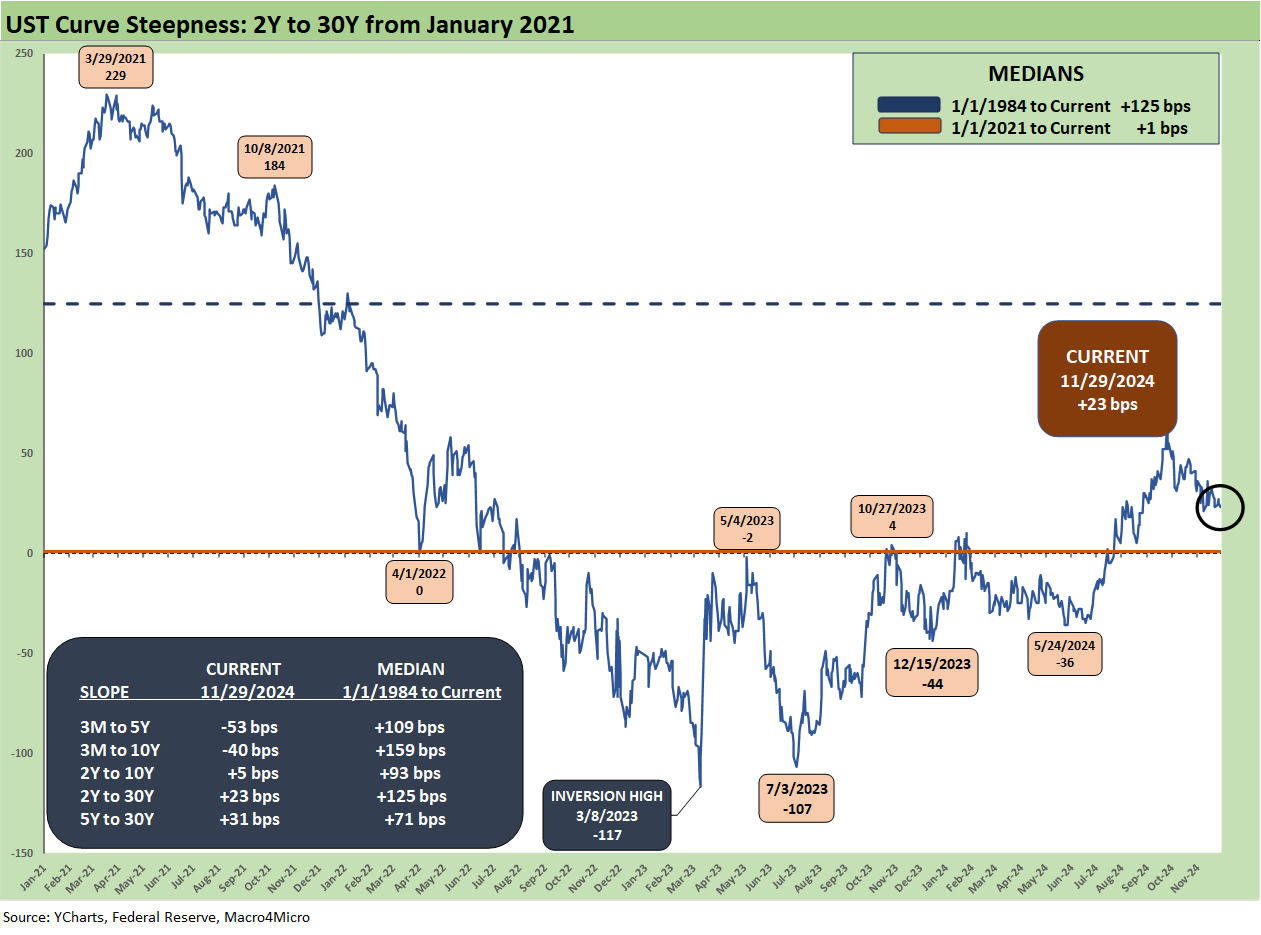
The above chart updates the 2Y to 30Y UST slope since 1984 along with the median across those cycles. We include the other UST slopes and medians we routinely monitor. The current 2Y to 30Y slope of +23 bps is well inside the long-term median of +125 bps.
The above chart shortens up the timeline to begin the time series on Jan 2021 during ZIRP and ahead of the tightening cycle. We see a peak steepness in 2021 of +229 bps in March 2021 followed by a peak inversion of -117 bps in March 2023 just ahead of the regional bank panic.
We wrap with the UST deltas across time from the start of March 2022 through this past week. ZIRP ended in March 2022 (effective 3-17-22) and we frame the deltas for the running period from 3-1-22. We include the 12-31-20 and 10-19-23 UST curves when 10Y UST peaked as frames of reference. The bear inversion of 2022 to 2024 is slowly retracing back toward flat in the easing cycle as inflation declines. One question is, “Will a higher 10Y and lower 3M from here be the path to get back to flat or upward sloping from 3M to 10Y?”
See also:
Footnotes & Flashbacks: Asset Returns 12-1-24
Mini Market Lookback: Tariff Wishbones, Policy Turduckens 11-30-24
PCE Inflation Oct 2024: Personal Income & Outlays 11-27-24
3Q24 GDP Second Estimate: PCE Trim, GPDI Bump 11-27-24
New Home Sales Oct 2024: Weather Fates, Whither Rates 11-26-24
Mexico: Tariffs as the Economic Alamo 11-26-24
Tariff: Target Updates – Canada 11-26-24
Footnotes & Flashbacks: Credit Markets 11-25-24
Mini Market Lookback: Market Delinks from Appointment Chaos… For Now 11-23-24
Credit Crib Note: Ashtead Group 11-21-24
Existing Home Sales Oct 2024: Limited Broker Relief 11-21-24
Housing Starts Oct 2024: Economics Rule 11-19-24
Mini Market Lookback: Reality Checks 11-16-24
Industrial Production: Capacity Utilization Circling Lower 11-15-24
Retail Sales Oct 2024: Durable Consumers 11-15-24
Credit Crib Note: United Rentals (URI) 11-14-24
CPI Oct 2024: Calm Before the Confusion 11-13-24
Mini Market Lookback: Extrapolation Time? 11-9-24
The Inflation Explanation: The Easiest Answer 11-8-24
Fixed Investment in 3Q24: Into the Weeds 11-7-24
Morning After Lightning Round 11-6-24
Payroll Oct 2024: Noise vs. Notes 11-2-24
Employment Cost Index Sept 2024: Positive Trend 10-31-24
Tariffs: The EU Meets the New World…Again…Maybe 10-29-24
Trump, Trade, and Tariffs: Northern Exposure, Canada Risk 10-25-24
PulteGroup 3Q24: Pushing through Rate Challenges 10-23-24
Trump at Economic Club of Chicago: Thoughts on Autos 10-17-24


