
Footnotes & Flashbacks: Credit Markets 11-25-24
We look at the action in credit markets, spreads, and yields as the past week brought more HY compression and a relatively quiet UST curve.


Stalin to Hegseth and Trump: Never announce a military purge in advance…
The credit markets have been running hot, and HY has kept the beat going with a move to +261 bps this week getting back closer to the lows of early June 2007 (+241 bps) and are already inside where June 2007 ended (+298 bps).
Among notable nuances in the current market vs. June 2007 is the heavy weighting of BBs in the current HY index mix at over 52% of face value vs. around 37% back in 2007. That gives the spread compression a better relative value angle than the June 2007 lineup, which included record breaking LBOs and a lot of systemic risk threatening credit.
The excess return relationships across the HY tiers are rational in the low end with the BBB vs. BB tier compressed but materially less so than in recent months.
We look back at how the excess returns are framing up vs. 2023 with a handful of weeks to go in 2024.
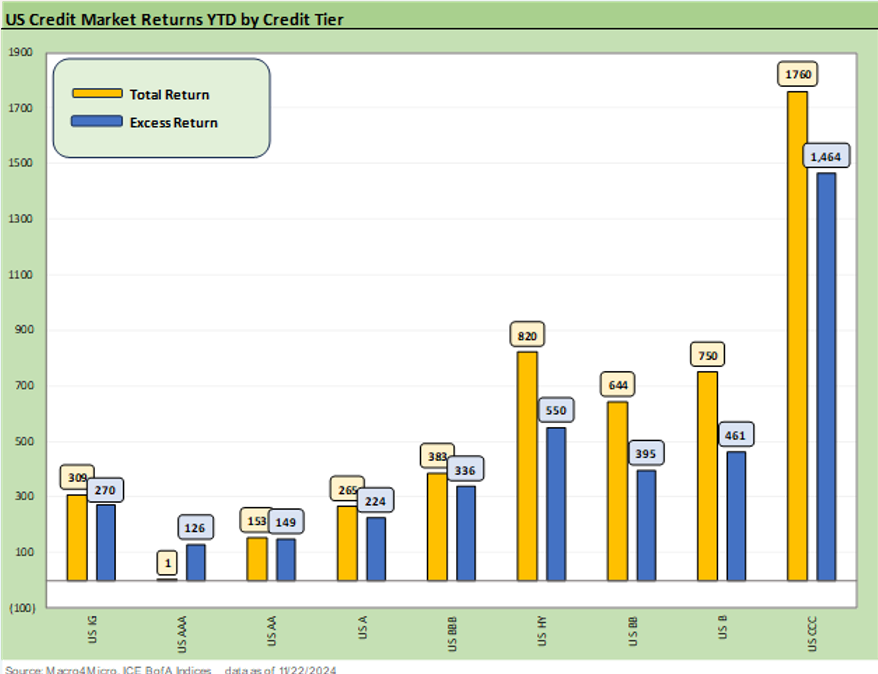
The above chart updates the YTD total returns and excess returns for IG and HY and the credit tiers. For IG, the duration setbacks during 2024 have left the A tier and BBB tier total returns YTD short of the weighted average coupon for those tiers with around 5 weeks to go. That comes even as refinancing and new money issuance will be repricing the coupon mix slightly higher after so many years of record lows during the ZIRP years. The excess returns in the HY tiers tell a good story on relative performance. For total returns, the lower duration in the HY mix has mitigated some of the yield curve toll along the way in 2024.

The running IG vs. HY excess returns offer a reasonable differential across the “mini credit cycle” that came after the COVID peak. We saw the 2021 rally year rolling into a 2022 tightening cycle and a sustained fundamental rebound in 2023 that carried into 2024 and the expected start of easing. We now know that easing took longer than anticipated by the consensus and there was less easing in 2024 than forecasted.
The HY credit market as a bellwether of credit risk had a wild few years. The rally of 2021 saw +6.8% of excess return, the sell-off of 2022 was at -3.0% excess return, and 2023 generated +9.1% of excess return with a dazzling compression to end the year in Nov-Dec 2023. (see Credit Performance: Excess Return Differentials in 2023 1-1-24, HY vs. IG Excess and Total Returns Across Cycles: The UST Kicker 12-11-23).
The credit market pricing trend of 2021 to 2023 was an unusual run just given a tightening cycle and an inflation fighting exercise not seen in 4 decades. The “comps” exercise for credit spreads in tightening cycles has limits since the HY market was only launched in scale after the stagflation pain of the double dip of 1980-1982 even if some issuers were around in HY. In other words, this cycle included a mix of factors unlike most in the HY market history.

The above chart updates the running excess returns of the BBB tier vs. the BB tier. We see the gap widening somewhat from recent differentials as the IG OAS level stalls and the HY market keeps on running tighter. The running excess return differential of +59 bps comes in a market where spreads are tight and will necessarily be lower relative to a rally year such as 2023 coming off the 2022 Fed tightening sell-off in HY.
As a frame of reference, the 2023 differential for BB vs. BBB by year end showed “BB excess return minus BBB excess return” of +148 bps. 2023 showed excess returns for BB of +713 bps and BBBs at +565 bps. The 2024 backdrop was a market with more certain cyclical dynamics and the expectation of easing that finally arrived in Sept 2024.
In a prior note, we had looked at the running 2023 excess returns for the credit tiers by month and on a YTD basis (see Return Quilts: Resilience from the Bottom Up 12-30-23). That commentary can help the thought process and the “comps” exercise as 2024 winds down. With spreads as tight as they are now, it is hard to compete with rally years following a sell-off such as 2022. The wild finish in 2023 to wrap the year generated a lot of compression and notably in the critical B tier.

The above chart highlights the CCC rally as we get into the home stretch. The +1464 bps excess return on the CCC tier YTD 2024 is not too far off from the full 2023 CCC tier excess return of +1605 bps. The B tier 2024 YTD run rate of +461 bps is a different story since 2023 posted +956 bps of excess return as the B tier compressed impressively in late 2023 to +341 bps or -174 bps tighter for the full year. During 2023, that included a -59 bps tightening in Dec 2023 after -70 bps of contraction in Nov 2023.
The differential above to this point in 2024 is +1003 bps (1464 bps for CCC tier – 461 bps for the B tier) while the 2023 calendar year differential between the B and CCC tier excess returns was “only” +649 bps. The CCC tier always comes with the usual asterisks of index drop-outs, defaults, distressed exchanges and drop-ins (notably downgrades).

IG spread trends have been calm and unchanged on the week at +80 bps. The IG market reflects bank sector confidence and some comfort that more bank consolidation and less capital demands will clear the decks for positive event risk in the financials sector. The banking sector is the largest in IG at over $1.5 trillion (face value) and has narrowed by -37 bps YTD to +77 bps. The BBB tier is -29 bps tighter YTD and single A tier at -21 bps YTD are the dominant layers in what has been an overall pattern of quality spread compression with the AA tier -10 bps tighter.

As we have been covering along the way each week, the HY market is in a protracted conga line without the usual late cycle excess and hyper leveraged private equity deals. The most ambitious deals have migrated over to private credit where such deals will have more room to maneuver and not be the usual trigger point for HY fund outflows and heightened redemption risks.
The move of HY OAS down into the June 2007 zone gets some tangible support from the FOMC on floating rate borrowing costs and reassures credit investors that the market faces less threat of credit contraction. That supports a market where yields are still hard to find (see HY OAS Lows Memory Lane: 2024, 2007, and 1997 10-8-24, HY Spreads: Celebrating Tumultuous Times at a Credit Peak 6-13-24).

The “HY OAS minus IG OAS” tightened by -11 bps on the week from +192 bps to +181bps. The compression continues as IG OAS moves moderate and HY keeps the tightening wave going.
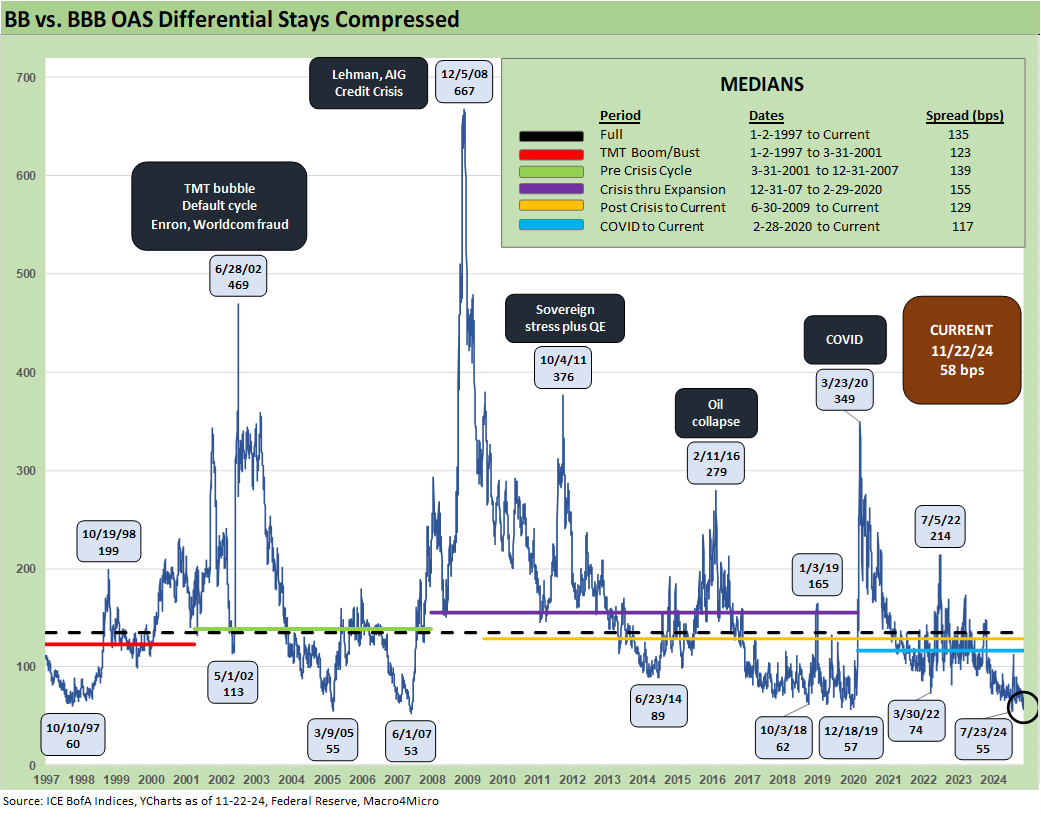
The “BB OAS minus BBB OAS” quality spread differential kept on narrowing also from +67 bps to +58 bps as the BB tier tightened by -10 bps and the BBB tier tightened by -1 bps.

The HY compression pattern was seen across all tiers with the BB tier -10 bps on the week as the trailing 1-month time horizon is now at -27 bps tighter and YTD at -47 bps.

The time series above updates the long-term history of the B tier and CCC tier (see The B vs. CCC Battle: Tough Neighborhood, Rough Players 7-7-24). For the week, the B tier was -11 bps tighter bringing YTD to -83 bps. The B tier started a great run to end 2023 and that continues to the current sub-200 bps range vs. the long-term median of +468 bps.
The B tier has been the sweet spot of the “HY Classic” investor since the 1980s, and the quality spread compression trends helped pull the CCC tier along with some of the B and CCC names overlapping in both tiers on capital structure layers.

The “CCC OAS minus B tier OAS” quality spread differential tightened slightly by -4 bps to +452 bps which is modestly inside the long-term median of +484 bps.
A look at yields…

The above chart updates the current IG vs. HY yields across the cycles and some key timeline medians. As we routinely state, we prefer the pre-crisis medians (6.1% IG, 9.3% HY) as the most relevant since the ZIRP, QE, and normalization periods distorted the UST curve lower. The long-term median of 4.7% for IG and 8.0% for HY includes a long stretch of ZIRP and post-ZIRP normalization and then a return to ZIRP from March 2020 to March 2022.

The above chart updates the IG index yield for Friday close on the horizontal line and frames it against the prior credit cycle peaks of June 2007 and late 1997. We also include the UST curves for those same dates.
As detailed above in the spreads section, we currently see IG spreads at +80 bps or near multicycle lows. IG spreads are below mid-2007 (+100 bps to end June 2007) and near spring 2005 lows and relatively close to late 1997. The all-time low tick of +53 bps in Oct 1997 was one for the ages given the growth in the market. IG spreads ended 1997 at +70 bps. The current market posts the lowest UST curve of the mix to compound the all-in yield challenge.

The above chart does the same update exercise for the HY Index yields for the same credit cycle comp dates we used for IG in the prior chart. With HY spreads back near the June 2007 period as detailed above in the spreads section, the combination of tight spreads with a materially lower UST at Friday close has the unsurprising result of low 7% handle HY index yields vs. the long-term median of 8.0% and the pre-crisis, pre-ZIRP median of 9.3%.
See also:
Footnotes & Flashbacks: State of Yields 11-24-24
Footnotes & Flashbacks: Asset Returns 11-24-24
Mini Market Lookback: Market Delinks from Appointment Chaos… For Now 11-23-24
Credit Crib Note: Ashtead Group 11-21-24
Existing Home Sales Oct 2024: Limited Broker Relief 11-21-24
Housing Starts Oct 2024: Economics Rule 11-19-24
Mini Market Lookback: Reality Checks 11-16-24
Industrial Production: Capacity Utilization Circling Lower 11-15-24
Retail Sales Oct 2024: Durable Consumers 11-15-24
Credit Crib Note: United Rentals (URI) 11-14-24
CPI Oct 2024: Calm Before the Confusion 11-13-24
Mini Market Lookback: Extrapolation Time? 11-9-24
The Inflation Explanation: The Easiest Answer 11-8-24
Fixed Investment in 3Q24: Into the Weeds 11-7-24
Morning After Lightning Round 11-6-24
Payroll Oct 2024: Noise vs. Notes 11-2-24
PCE Inflation Sept 2024: Personal Income and Outlays 10-31-24
Employment Cost Index Sept 2024: Positive Trend 10-31-24
3Q24 GDP Update: Bell Lap Is Here 10-30-24
The Politics of Objective GDP Numbers: “Flex Facts” on Growth 10-30-24
Tariffs: The EU Meets the New World…Again…Maybe 10-29-24
Trump, Trade, and Tariffs: Northern Exposure, Canada Risk 10-25-24
Durable Goods Sept 2024: Taking a Breather 10-25-24
New Home Sales: All About the Rates 10-25-24
PulteGroup 3Q24: Pushing through Rate Challenges 10-23-24
Trump at Economic Club of Chicago: Thoughts on Autos 10-17-24
CarMax: Why Do We Watch KMX as a Bellwether? 10-3-24
Select Histories:
Tariffs: The EU Meets the New World…Again…Maybe 10-29-24
Trump, Trade, and Tariffs: Northern Exposure, Canada Risk 10-25-24
Trump at Economic Club of Chicago: Thoughts on Autos 10-17-24
HY OAS Lows Memory Lane: 2024, 2007, and 1997 10-8-24
Credit Returns: Sept YTD and Rolling Months 10-1-24
HY Industry Mix: Damage Report 8-7-24
Volatility and the VIX Vapors: A Lookback from 1997 8-6-24
HY Pain: A 2018 Lookback to Ponder 8-3-24
Presidential GDP Dance Off: Clinton vs. Trump 7-27-24
Presidential GDP Dance Off: Reagan vs. Trump 7-27-24
The B vs. CCC Battle: Tough Neighborhood, Rough Players 7-7-24
HY Spreads: Celebrating Tumultuous Times at a Credit Peak 6-13-24
Credit Markets Across the Decades 4-8-24
Credit Cycles: Historical Lightning Round 4-8-24
Histories: Asset Return Journey from 2016 to 2023 1-21-24
Credit Performance: Excess Return Differentials in 2023 1-1-24
Return Quilts: Resilience from the Bottom Up 12-30-23
HY vs. IG Excess and Total Returns Across Cycles: The UST Kicker 12-11-23
HY Multicycle Spreads, Excess Returns, Total Returns 12-5-23
US Debt % GDP: Raiders of the Lost Treasury 5-29-23