
Footnotes & Flashbacks: State of Yields 11-24-24
The UST curve saw a muted set of moves ahead of the PCE release and updated 3Q24 numbers this coming week.


What do you mean the “buyer pays” on tariffs?
The UST curve is coming off another rough patch since the Sept rally took mortgages close to 6.0% before a UST shift took mortgages closer to the 7% area.
The slow migration toward a flat UST curve is still underway based on the FOMC easing and a rise of the longer UST segments.
The UST curve faces a PCE test this week that will update the price index but also offer the latest vantage point on income and outlays from the critical consumer sector as well as their latest savings rates with wages running ahead of inflation.
A change in administration with a very different view of Fed independence will bring challenges that are compounded by a factual disagreement on who pays tariffs and what will influence underlying inflation. Of course, the question of “who pays” tariffs is not really a question.
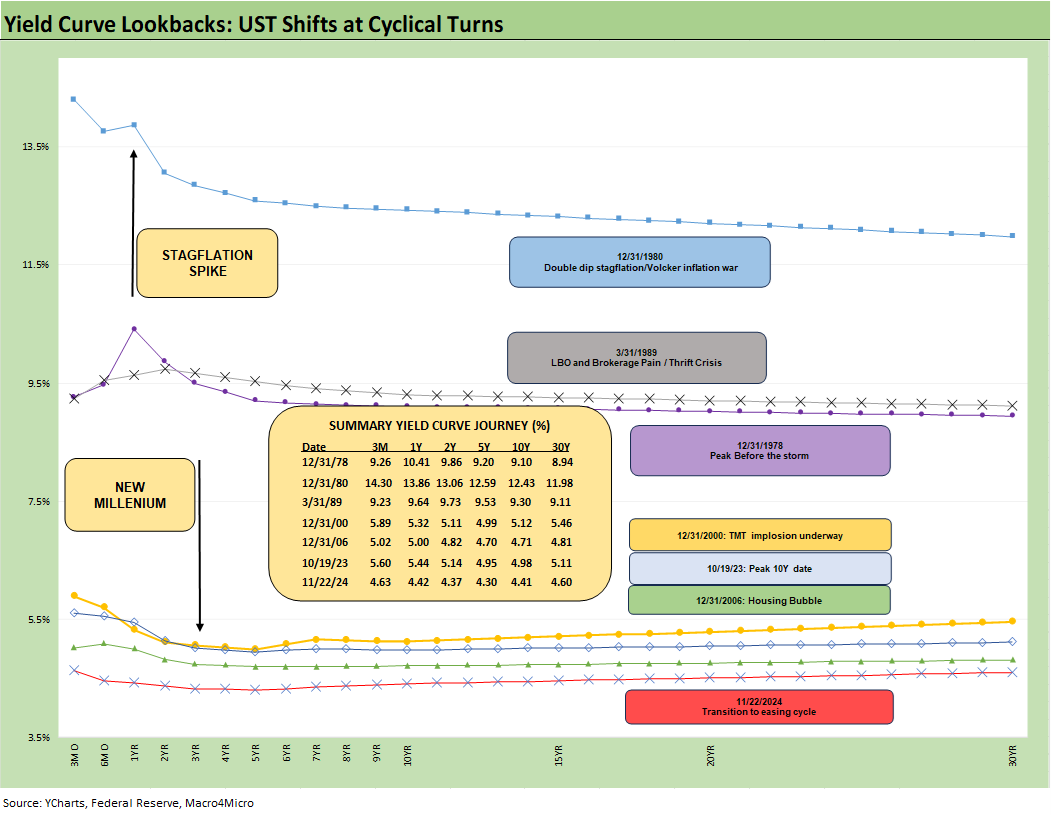
The yield curve history from the “Carter inversion of 1978” through this past Friday details the UST curve migrations across some key cyclical time periods before the credit crisis. We do not detail the post-crisis UST curves that were distorted by ZIRP, QE, and normalization periods and jump right to the 10-19-23 peak date in the 10Y UST.
We see the non-ZIRP, QE, and normalization periods as distorted by distinctive FOMC relief policies, so we prefer to frame the current UST curve against the non-ZIRP periods. The easy takeaway remains that the current yield curve backdrop is extraordinarily low vs. the history of pre-crisis cycles. That includes some brutal economic downturns as well as material swoons in the capital markets.
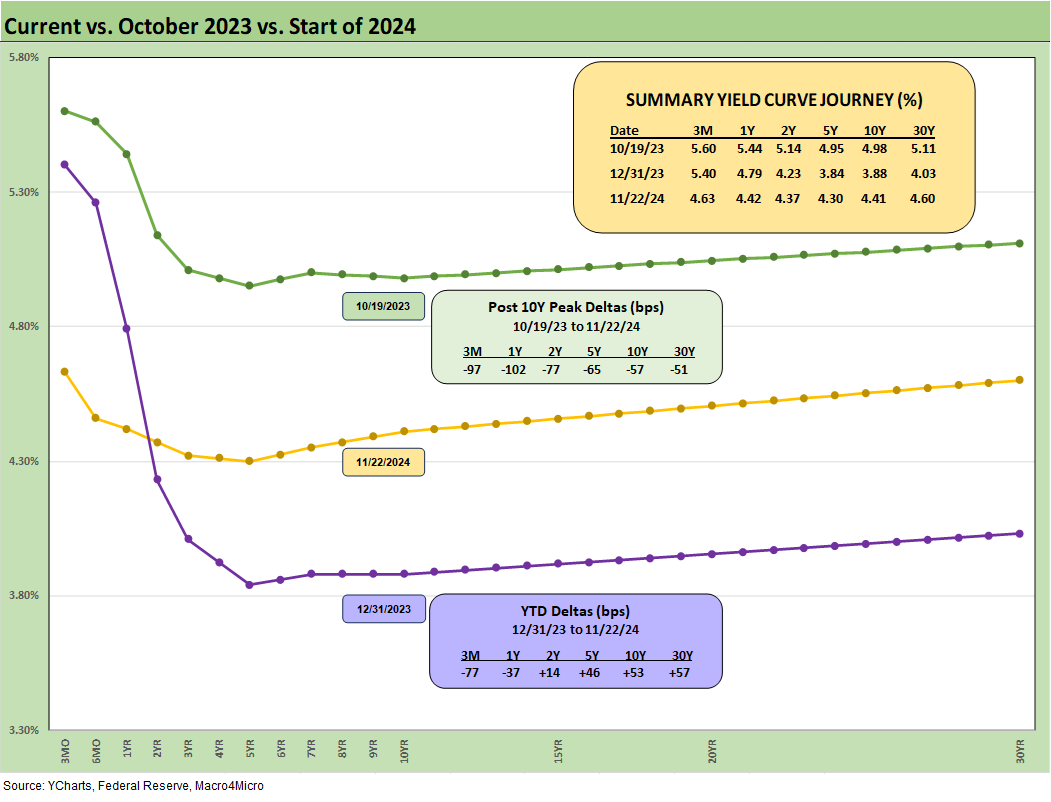
The above chart updates the UST deltas from the 10-19-23 peak date on the 10Y UST and from the 12-31-23 date for a running YTD metric. For 2024, we see the bear steepener from the 2Y UST out to 30Y even as the FOMC eased by -75 bps during the fall with another -25 bps still expected in Dec unless this week’s PCE numbers rattle the Fed.
The odds of a cut have declined sharply over the past month from north of 70% to just over 50%. That enters the week as a near tossup. The anomaly of the front-end inversion from 3M to 5Y/10Y is still an anomaly in an extended economic expansion with below median inflation. For now, we see the market slowly moving toward a flatter profile from the short end even if the longer end has not been cooperating in recent weeks.
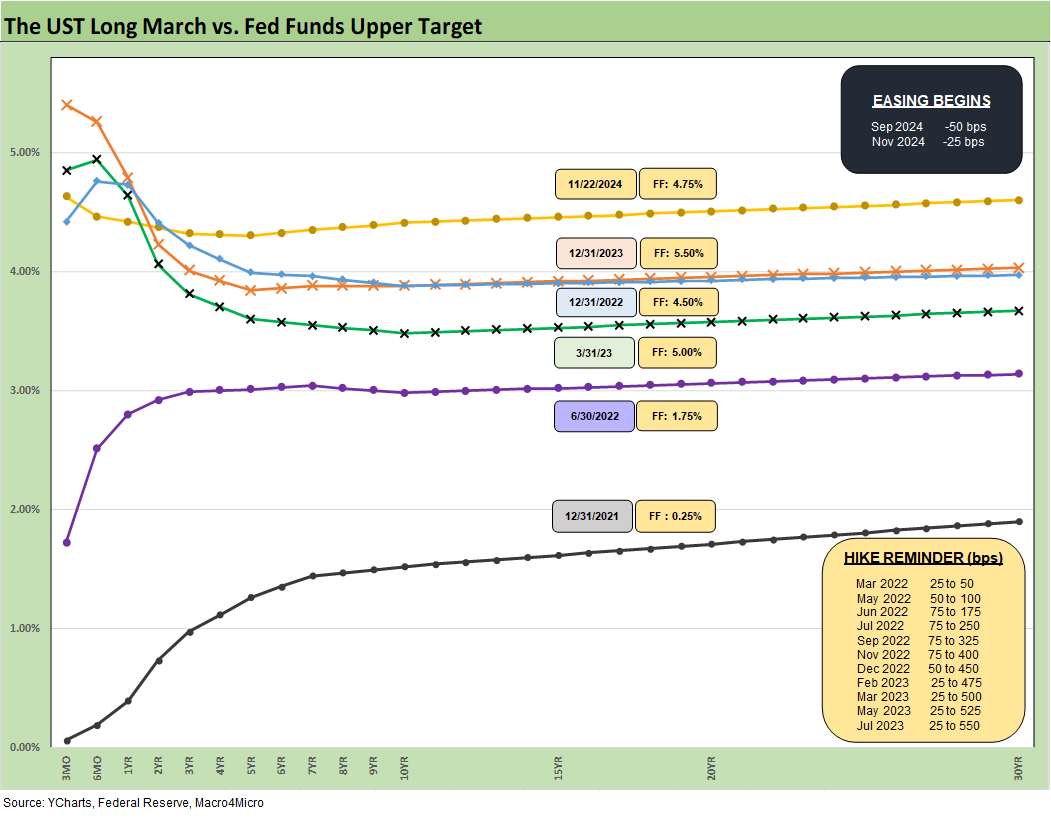
The above chart shows where the current UST curve is positioned across the tightening cycle. We also include the memory boxes on the tightening cycle timing and magnitude and now the easing cycle. The Friday 11-22-24 UST curve tops this chart and shows a modest upward slope from the 2Y UST area.
The 100 bps differential in fed funds between the 12-31-22 UST curve vs. the 12-31-23 curve still saw a convergence in the 10Y UST area between those two curve dates despite that tightening. When considering where the UST curve is today, we also could be looking at a 100 bps differential again by year end 2024 with the 10Y materially higher. The lack of movement in the 10Y last time is food for thought.
The 2022 to 2023 history showed the 10Y did not follow the tightening. For now, the indications that the 10Y UST will follow the easing is not there yet and in fact has been going the wrong way. The tariff question is another factor to consider this time as 2025 unfolds and the White House shouts “let the tariff games begin.”
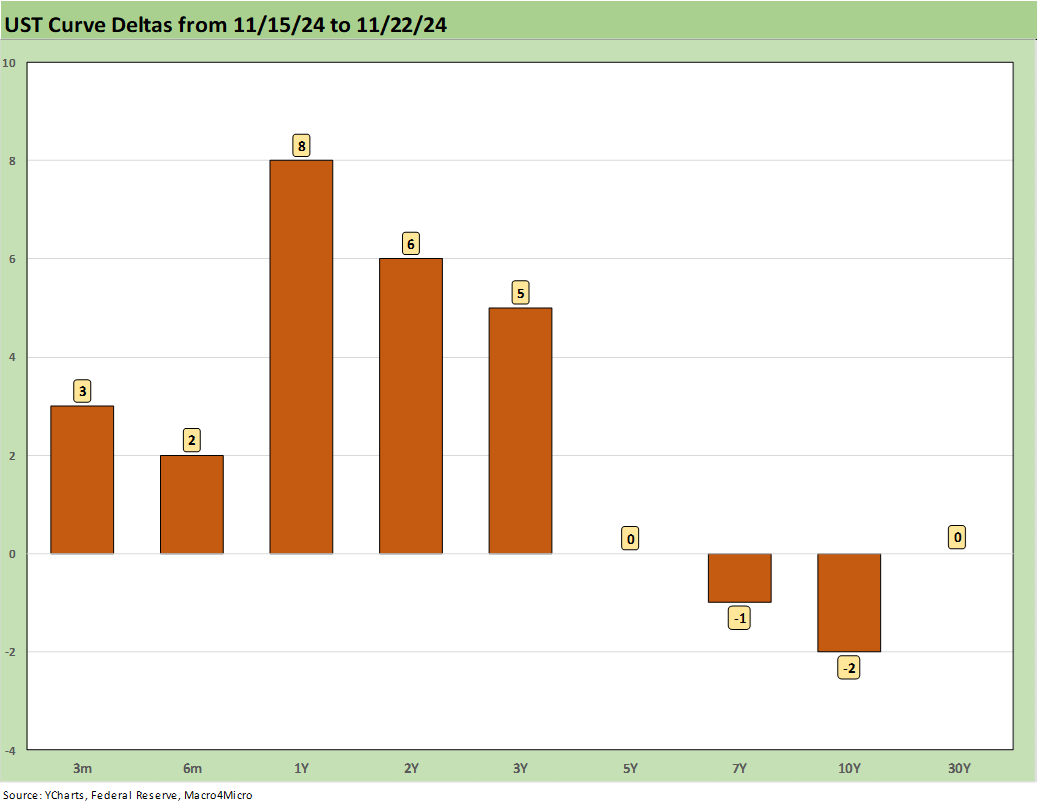
The above chart breaks out the weekly UST deltas with small (or zero) moves from 5Y to 30Y and adverse moves on the short end. As detailed in this week’s Footnotes publication on asset returns, bond ETF returns were mostly positive this week even if all 7 were in the bottom quartile of the 32 benchmarks and ETFs in a strong equity week (see Footnotes & Flashbacks: Asset Returns 11-24-24).
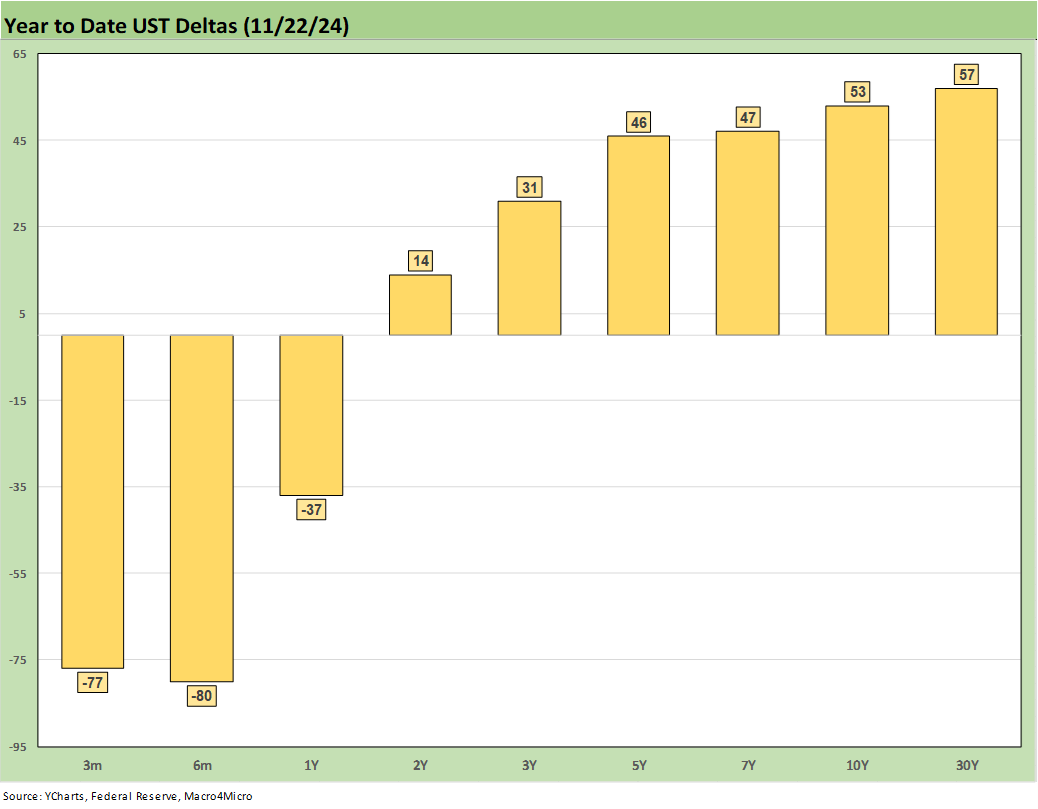
The YTD UST deltas are updated above with an another visual on the deltas. The bear steepener from the 2Y UST helps frame the underperformance of bonds YTD as covered in the asset returns Footnotes publication.
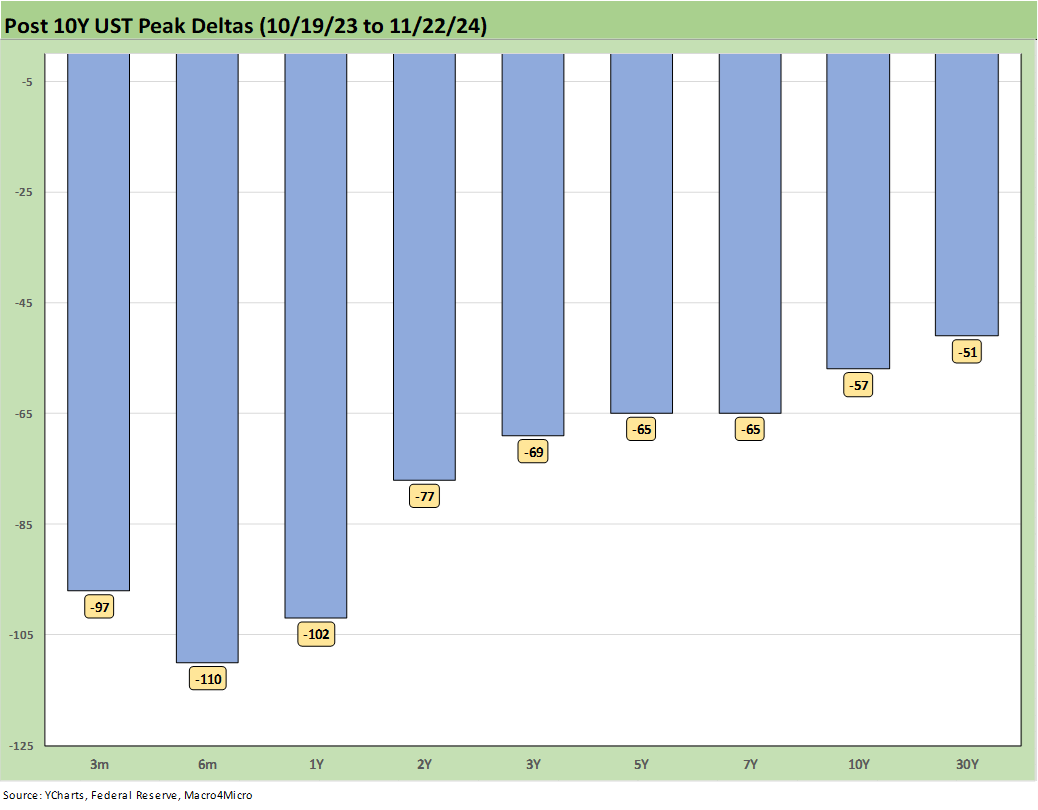
The above chart updates the impressive downward migration of the UST curve since the peak UST 10Y date of 10-19-23. Inflation was on its way into a downward trajectory and the market was moving toward a consensus of very aggressive fed easing (5-6 cuts were the expectation norm for a while) and the reshaping of a bull flattener across 2024. That bull flattener did not pan out, but the UST move as the crow flies from mid-Oct 2023 was still very bullish for duration. The long duration 20+Y UST ETF (TLT) has generated a total return of +14% since that time frame.
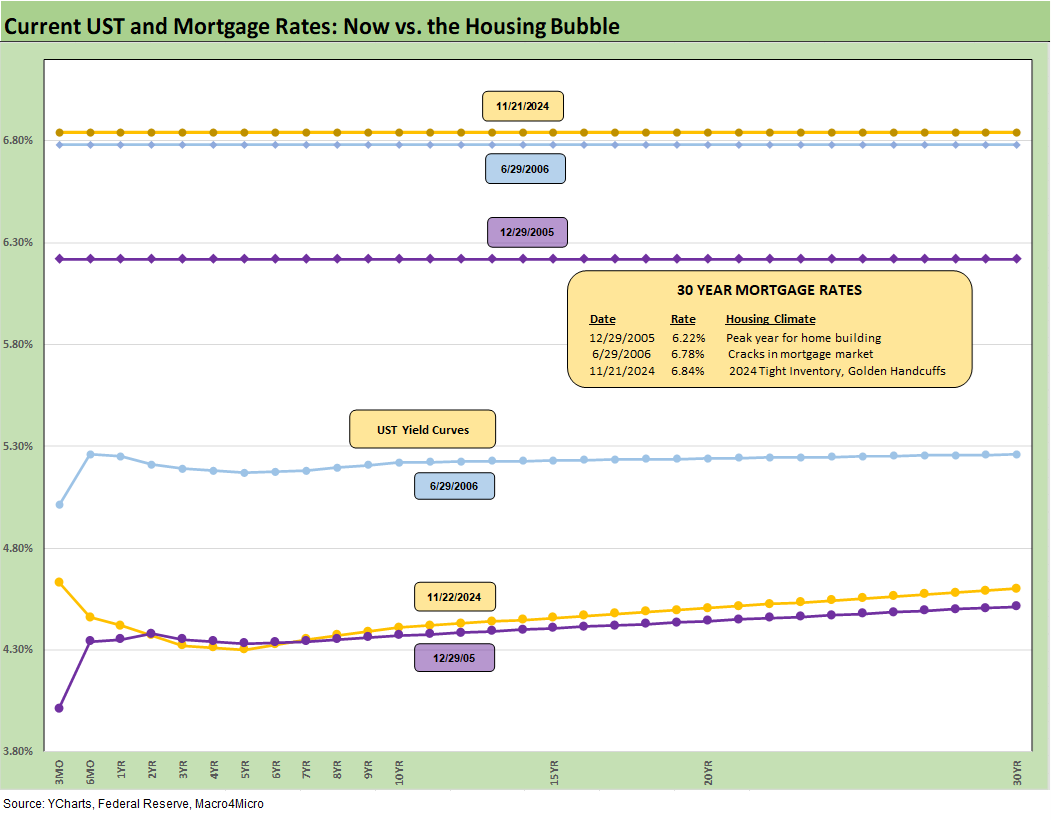
We already looked at the time series for the 10Y UST and how it flowed into the Freddie Mac 30Y Mortgage benchmark in the Mini Market Lookback: Market Delinks from Appointment Chaos… For Now (11-23-24). The Freddie Mac 30Y rate ticked up to 6.84% this week from 6.78% last week. That is a hefty rise from late Sept when it hit 6.08% (see Footnotes & Flashbacks: State of Yields 9-29-24). Away from the Freddie Mac benchmark, there are plenty of 7.0% quotes.
The above chart allows for an easy comparison of today’s rates to the Freddie Mac benchmark of 2005 as the peak homebuilding year and the mid-2006 time horizon when asset quality and RMBS anxiety was creeping into the market before it was seriously escalated in 2007. We also include the UST curves at the same dates as food for thought.
The materially higher home prices today with modestly higher mortgage rates have been a problem for home buyers while the magnitude of the increase from 2021 after so many low mortgages were locked in has been a “barrier to exit” and undermines sellers (see Existing Home Sales Oct 2024: Limited Broker Relief 11-21-24).
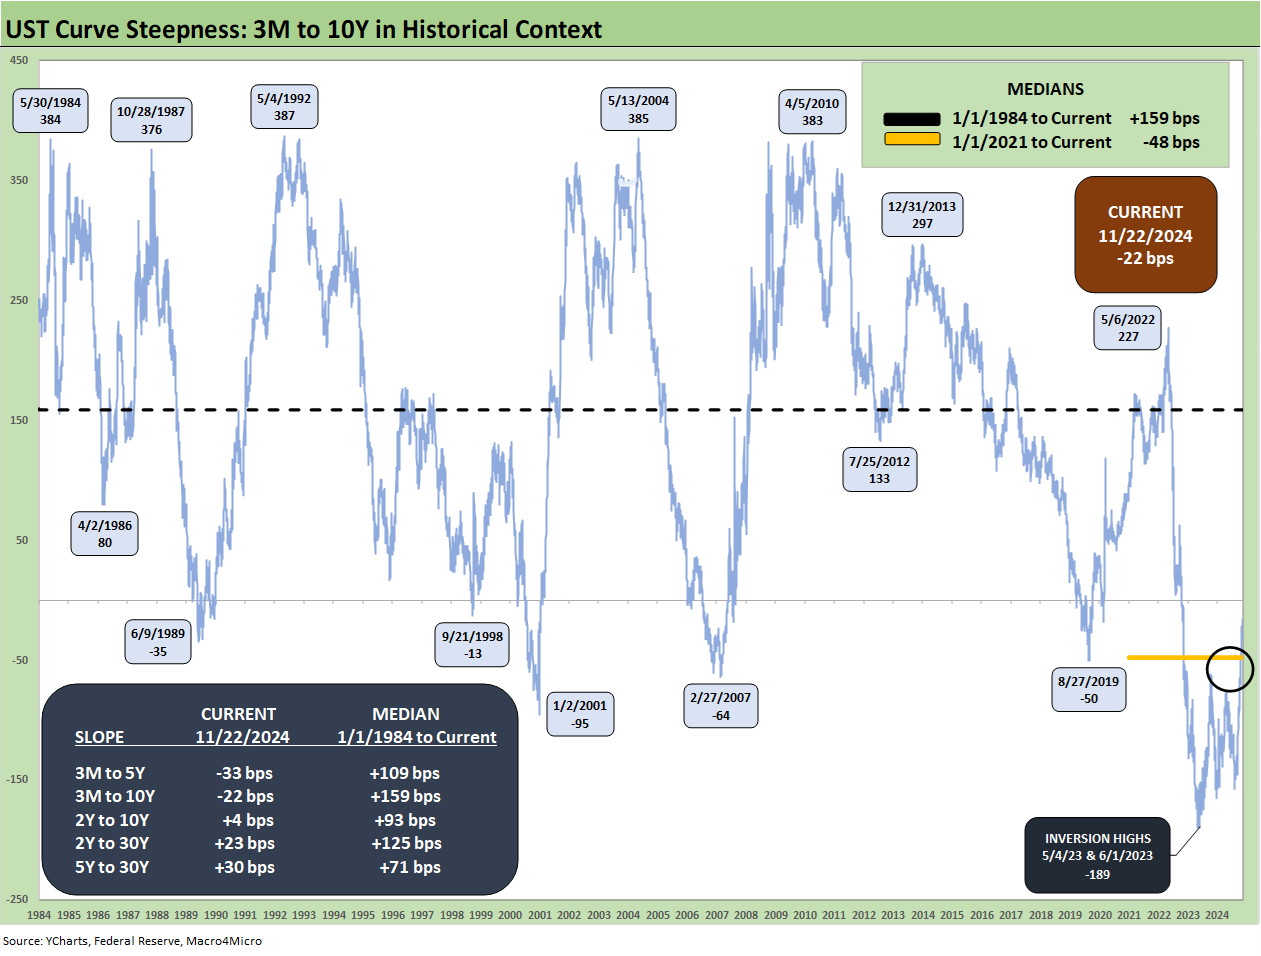
The above chart updates the 3M to 10Y UST slope across the cycles from 1984 and updates the other slopes we watch. The 3M to 10Y continues its migration toward flat with the current slope at -22 bps vs. a median of +159 bps but a long way from the peak inversions of -189 bps (5-4-23, 6-1-23).
The market still sees many waiting for more attractive term premiums to take the duration risk. The diametrically opposite views on tariffs and the impact on inflation from tariffs (among other risk factors) is complicating that decision to extend. The mass deportation risk factor is no small variable either and is unprecedented in the scale as described in campaign rhetoric (“15 million” “20 million” etc.).
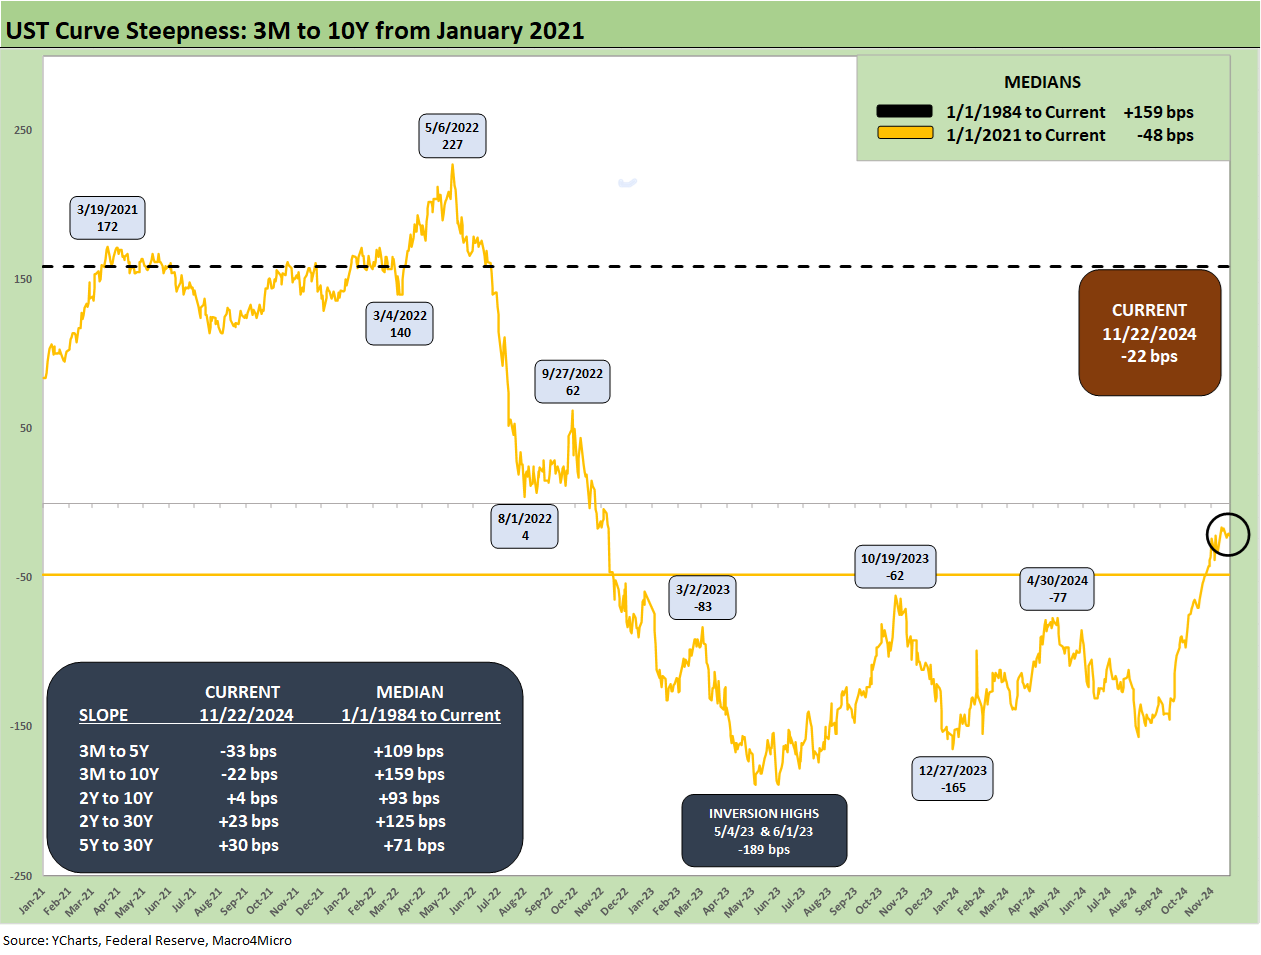
The above chart shortens up the timeline on that same 3M to 10Y slope for a more granular view of the journey across the tightening cycle and now the easing process.
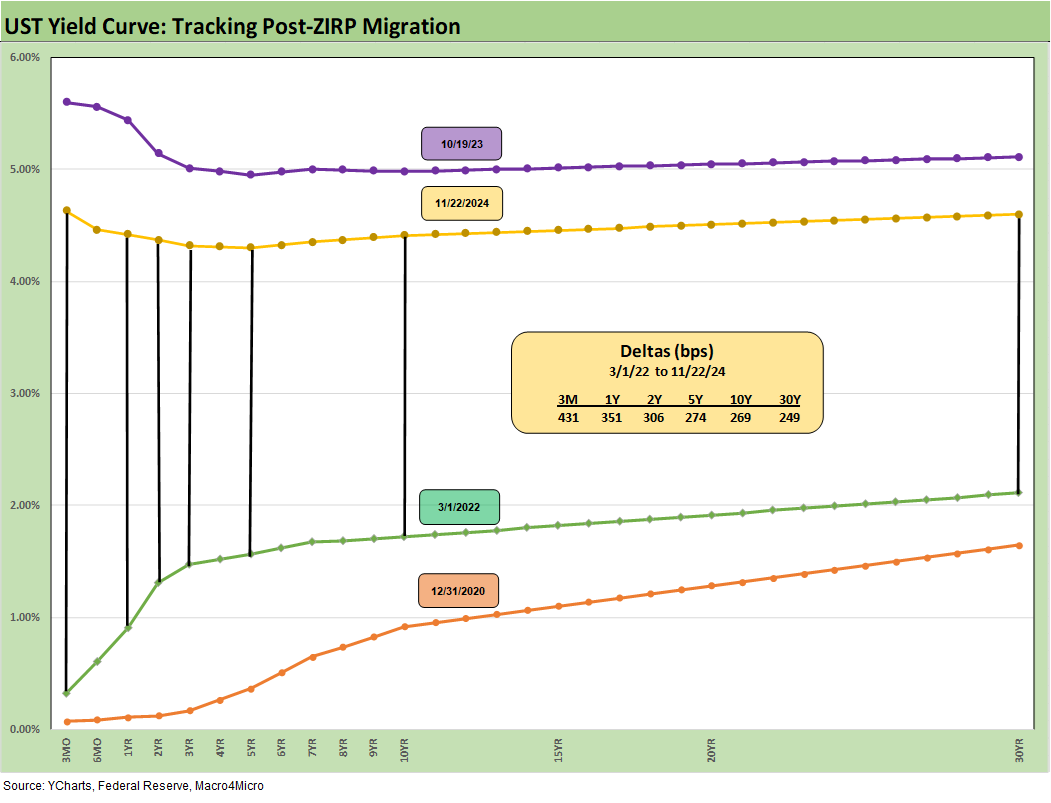
We wrap with the details on the UST curve deltas from the start of March 2022, which was the month ZIRP ended and the tightening cycle began (effective 3-17-22). We include the 10-19-23 curve when the 10Y UST peaked and the 12-31-20 curve when the vaccine was just getting rolled out.
See also:
Footnotes & Flashbacks: Asset Returns 11-24-24
Mini Market Lookback: Market Delinks from Appointment Chaos… For Now 11-23-24
Credit Crib Note: Ashtead Group 11-21-24
Existing Home Sales Oct 2024: Limited Broker Relief 11-21-24
Housing Starts Oct 2024: Economics Rule 11-19-24
Footnotes & Flashbacks: Credit Markets 11-18-24
Footnotes & Flashbacks: State of Yields 11-18-24
Footnotes & Flashbacks: Asset Returns 11-17-24
Mini Market Lookback: Reality Checks 11-16-24
Industrial Production: Capacity Utilization Circling Lower 11-15-24
Retail Sales Oct 2024: Durable Consumers 11-15-24
Credit Crib Note: United Rentals (URI) 11-14-24
CPI Oct 2024: Calm Before the Confusion 11-13-24
Footnotes & Flashbacks: Credit Markets 11-12-24
Footnotes & Flashbacks: State of Yields 11-11-24
Footnotes & Flashbacks: Asset Returns 11-10-24
Mini Market Lookback: Extrapolation Time? 11-9-24
The Inflation Explanation: The Easiest Answer 11-8-24
Fixed Investment in 3Q24: Into the Weeds 11-7-24
Morning After Lightning Round 11-6-24
Payroll Oct 2024: Noise vs. Notes 11-2-24
All the Presidents’ Stocks: Beware Jedi Mind Tricks 11-1-24
PCE Inflation Sept 2024: Personal Income and Outlays 10-31-24
Employment Cost Index Sept 2024: Positive Trend 10-31-24
3Q24 GDP Update: Bell Lap Is Here 10-30-24
The Politics of Objective GDP Numbers: “Flex Facts” on Growth 10-30-24
Tariffs: The EU Meets the New World…Again…Maybe 10-29-24
JOLTS Sept 2024: Solid but Lower, Signals for Payroll Day? 10-29-24
Trump, Trade, and Tariffs: Northern Exposure, Canada Risk 10-25-24
Durable Goods Sept 2024: Taking a Breather 10-25-24
New Home Sales: All About the Rates 10-25-24
PulteGroup 3Q24: Pushing through Rate Challenges 10-23-24
State Unemployment Rates: Reality Update 10-22-24
Trump at Economic Club of Chicago: Thoughts on Autos 10-17-24
Here are my PCE estimates:
https://open.substack.com/pub/arkominaresearch/p/oct-2024-pce-inflation-estimate?r=1r1n6n&utm_campaign=post&utm_medium=web