
Footnotes & Flashbacks: Asset Returns 11-24-24
We look at asset returns as the equity markets keep celebrating even while bonds stay uncertain on the UST curve and bullish on credit risk.


Team Trump working on their frictionless tariff and mass deportation plan...
The stock rally remains intact since handicapping “the good” is easier with the consumer sector and fixed asset investment very healthy, risk appetites bullish, credit markets strong, credit availability favorable, and overall earnings trends positive into 4Q24.
The challenge around “the bad” is how to factor in risky but uncertain tariffs and mass deportation fallout. A major question is “Are high tariffs really uncertain?” They are coming.
The healthy credit markets offer comfort for equity bulls relative to periods such as 2007 and 1999 when the credit markets sent strong signals that were often ignored (and people learned from that).
A vote of confidence in the major banks and regional banks is showing up in the stock markets with the impressive “breadth factor” rewarding Small Caps and Midcaps.

The above chart updates our high level benchmarks for debt and equity that we track. Equities put up another banner week while bond performance was relatively stalled but at least not negative. As we detail further below in the time horizon charts on benchmarks and ETF returns, this week saw equities roll on and lead the headlines as NVIDIA reported and retailers started weighing in with very different signals (Walmart vs. Target). The retailers will get a lot more focus in 2025 as the true cost of tariffs and strategies on inventory order books get more attention. Retailers know that they pay the cost of tariffs even if Trump and his new Treasury Secretary nominee refuse to use the phrase “buyer pays.”
For bond benchmarks detailed above, IG credit spreads were flat this past week while HY tightened as covered in our Mini Market Lookback published earlier. HY had a decent rolling 3 months and a very strong 6 months and has posted steady spread compression for the YTD period (-78 bps of tightening). HY has generated a healthy increment return above the 6.35% par weighted coupon return at +8.2% YTD with over 5 weeks still to be booked.
As we detail in the ETF and benchmark review further below, the diversity of the industry and subsector mix in the upper rankings for the past 1-month period is reassuring with Financials (XLF), Regional Banks (KRE), Small Caps (RUT), energy ETFs (XOP, AMLP, XLE), Consumer Discretionary (XLY, heavy on Tesla), and Transports (XTN) in the top quartile and Midcaps (MDY) at the top of the second quartile.
Bonds continue to struggle after a bear steepener since the Sept rally flamed out with 5 of the 7 bond ETFs we track in the red for the 1-month period. We see IG Corporates and UST benchmarks above in negative range for 1-month. The past week we see 7 of the 8 ETFs in the bottom quartile comprised of bond ETFs.
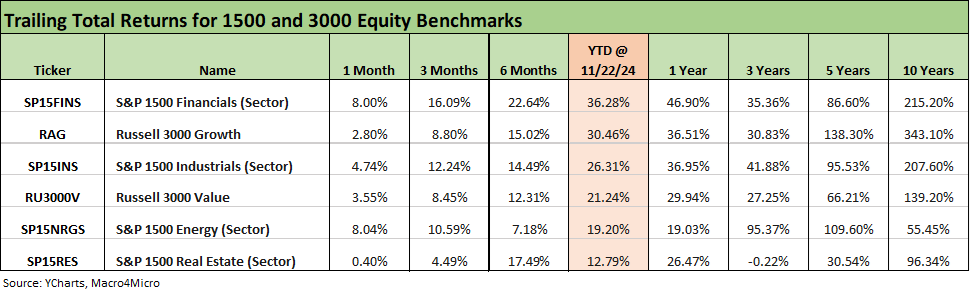
The 1500 and 3000 series highlights the recent strength of Financials and the rebound in Energy in the 1-month returns. We see Industrials and Value in the mid-range of the group for the 1-month and Real Estate back on the bottom. Growth has been a laggard also in the past month relative to its returns in the 3-month, 6-month, and YTD run rate.
The rolling return visual
In the next section, we get into the details of the 32 ETFs and benchmarks for a mix of the trailing periods. Below we offer a condensed 4-chart view for an easy visual on how the mix of positive vs. negative returns shape up. This is a useful exercise we do each week looking for signals across industry groups and asset classes. We also have a YTD version that we include in the broader commentary on the time horizons further below.

The visuals show a very good stretch for asset returns across the 3-month, YTD, and past year with the fall season showing the tailwinds of FOMC easing, strong PCE, solid Fixed Investment, and constructive GDP trends (see links at the bottom). These trends were capped off with an election that promised lower taxes, less regulation, and more M&A.
The 1-month time horizon shows the UST curve setbacks that flowed into bond ETFs and some subsector-specific setbacks in Emerging Markets equities (VWO) and China anxiety flowing into Base Metals (DBB). Health care will have more complicated performance attribution factors beyond the UST curve that are likely to fall under the broader risk heading of “RFK Jr risk.”
The election challenge brings no shortage of risks to play out later with tariffs and mass deportation. In our view, we could see a slow-motion train wreck in tariff risk in 2025. Trump’s emotional attachment to tariffs and his defensiveness around what has been highlighted as his factual and conceptual lack of understanding of the subject has left him determined to push ahead with an aggressive approach. It would be easier to have confidence in this area if Trump ever used the words “buyer pays.” That is a fact and not an opinion (see Trump at Economic Club of Chicago: Thoughts on Autos 10-17-24, Facts Matter: China Syndrome on Trade 9-10-24).
The opinions come into play on what the knock-on effects and risks are in the “buyer pays” tariff policies. The obvious ones are inflation and/or earnings dilution in some combination, trade clashes, retaliation, and/or defensive capex planning as seen in 2018-2019. That is a matter of history. The trade-off vs. the benefits from tariffs are more speculative and uncertain on the lag times such as reshoring, more manufacturing jobs, higher economic growth, etc.
For the private sector, the option to stand still and go defensive, buy back stock, opt for M&A, and downsize some operations are also options. The clock is ticking. We will find out soon enough how big and broad the tariffs will be. We also need to see the actual scale of resources needed for mass deportation, the use of the military in domestic policy execution, and what mass deportation does to the PCE lines and labor markets.
The Magnificent 7 heavy ETFs…
Some of the benchmarks and industry ETFs we include have issuer concentration elements that leave them wagged by a few names. When looking across some of the bellwether industry and subsector ETFs in the rankings, it is good to keep in mind which narrow ETFs (vs. broad market benchmarks) get wagged more by the “Magnificent 7” including Consumer Discretionary (XLY) with Amazon and Tesla, Tech (XLK) with Microsoft, Apple, and NVIDIA, and Communications Services (XLC) with Alphabet and Meta.
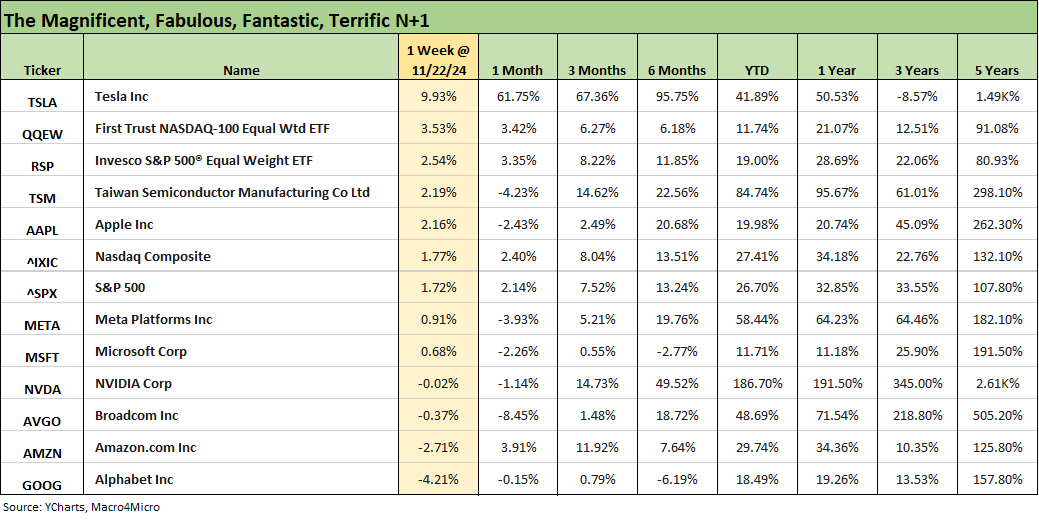
The performance of the tech bellwethers this week was mixed as we discussed already in Mini Market Lookback: Market Delinks from Appointment Chaos… For Now. As we detail below, the Tech ETF (XLK) was only in the third quartile for the 1-week, 1-month, and 3-month time horizons. For 1-month returns, only Consumer Discretionary (XLY) of the Mag 7 heavy ETFs cracked the top quartile on the back of the monster return numbers that Tesla was putting up on the board. We saw 3 of the Mag 7 in the red this past week in the above table.

We already addressed the 1-week numbers in our Mini Lookback, and the main pattern on the low end was that 7 of the 8 ETFs in the bottom quartile were bond ETFs. For the high end of the rankings, E&P is always a volatile line item and had some geopolitical support this past week that flowed into oil prices moving above $71 late in the week.
The week was another solid one with a median return over +2.1%. The fact that Small Caps at +4.5% and Midcaps at +4.2% were #2 and #3, respectively, is reassuring for the “breadth story.” Along with the other ETFs in the top tier mix, the Small Caps and Midcaps make a statement on investors having confidence in cyclical resilience in the rebound and looking to what could be perceived as a more US-centric economic story and less tied to the tech bubble. Small/Mid Caps also have a lot of financials (banks) exposure as well as nonbanks that overlap with the HY bond issuer base.
The top quartile mixed in Midstream Energy (AMLP), Homebuilders (XHB), the Equal Weight NASDAQ 100 (QQEW), Materials (XLB), and Regional Banks (KRE). The wide range of solid performers by subsectors and industries will be facing some major challenges in the face of radical top-down policy shifts.
Running a campaign on “everything is going wrong” when so many things were going right can be tricky if you start undoing programs that have been major positive factors for jobs (especially construction). The high rate of economic activity in 2H24 cuts across many industry groups. We get updated 3Q24 GDP numbers this week.

The 1-month returns were more mixed with 10 negative for a score of 22-10. Within those 10 in the red, we see 5 bond ETFs in negative range with HY (HYG) and EM Sovereign debt (EMB) able to generate minimal sub-1% positive returns. We see a low 1% handle median return in the 1-month mix as the returns dropped off quickly after the big winners in areas such as financials and the important wins for the Small Caps and Midcaps.
The top quartile numbers are impressive with Regional Banks (KRE) at +15.6% for the 1-month period with two more in double digits including Consumer Discretionary (XLY) at +10.6% and E&P (XOP) at +10.5%. The large cap benchmarks (NASDAQ, S&P 500) were in the lower end of the second quartile. The Tech ETF (XLK) was down in the third quartile along with the BDC ETF (BIZD). Homebuilders (XHB) faded to the bottom of the second quartile as mortgages soared after the initial dip in Sept down to near 6.0% ahead of the ensuing spike back close to 7.0%.

The 3-month scoresheet comes in at 27-5 with 4 of the 5 in the red zone comprised of bond ETFs and the long duration 20+Y UST ETF (TLT) in dead last at -6.6%. The bottom quartile has 6 of the 7 bond ETFs with only HYG (HY) across the line in the third quartile as coupons, tightening spreads, and shorter duration exposure helped HYG. The top quartile has a healthy diversified mix with Small Caps and Midcaps, Financials (XLF), Transports (XTN), Consumer Discretionary (XLY, heavy on Tesla), Communications Services (XLC), and Industrials (XLI).
We see 9 of the 32 posting double-digit returns with Regional Banks (KRE) at +24.2% ranked #1 and Financials at +15.6% ranked #4. It is worth remembering that the economic and credit cycles that went badly wrong on the equity side saw weak banks with very vulnerable asset quality. Those are periods we cover in other commentaries, but the booming NASDAQ of 1999 (+86% return) was a bubble running alongside the start of a HY bond default cycle. It ended badly in 2000-2002. The underwriting cycle was the worst in history with the late 1980s a close second. In 2000, credit was already imploding as TMT equities were still soaring into a 2001-2022 credit cycle swoon. Asia and EM debt was also brutal in that late 1990s stretch with highlights such as LTCM and Russia. Equities ran ahead regardless.
The more obvious example of financial system vulnerability was the credit crisis period after the structured credit binge and mortgage bubble years. We had a precarious bank system and vastly overleveraged securities market sector with life-threatening counterparty risk exposure in June 2007. Derivative counterparty risk was a house of cards, and the credit markets went into a coma in the summer of 2007 while the S&P 500 kept running to a record high in Oct 2007. We know how that all ended.
The best news as we head into a period of policy shock in 2025 is that the financial/credit markets and banking/securities backdrop is much healthier even if it is easy to debate private credit worries and what that all means. Those will be for other days. We do not see Private Credit as a “systemic threat” as that term gets bandied about.

The YTD returns post a score 31-1 with the long duration UST 20+Y (TLT) sitting on the bottom at -5.5% after a rough year overall for duration. Bond ETFs comprise 7 of the 8 in the bottom quartile with the Health Care ETF (XLV) the single equity ETF in the bottom quartile mix.
The median YTD return in the mix of 32 benchmarks was around 14.5% across what has been a banner YTD 2024 following a great finish to 2023 with the Nov-Dec 2023 rally. We see 4 ETFs north of the 30% line with Financials (XLF) at #1, Communications Services (XLC) at #2, Regional Banks (KRE) at #3, and Utilities at #4. The Mag 7 heavy NASDAQ and S&P 500 are in the top quartile along with the income-heavy Midstream Energy ETF (AMLP) and Industrials (XLI). With the recent setback in mortgage rates, the Homebuilder ETF (XHB) has fallen into the top tier of the second quartile but is still ahead of the Tech ETF (XLK).

The LTM returns remain the star of the time horizons with a 32-0 score. The LTM period still has some weeks left from the returns seen in the late 2023 rally (see Footnotes & Flashbacks: Asset Returns 1-1-24 , Footnotes & Flashbacks: State of Yields 1-1-24, Credit Performance: Excess Return Differentials in 20231-1-24). In the top 3 we see Regional Banks (KRE) at #1 with +57.7%, Homebuilders (+46.7%) at #2, and Financials (XLF) at +46.2%. The median return in the mix was almost 23%.
We see 6 of the 8 in the bottom quartile comprised of bond ETFs with only HY making it into the bottom of the third quartile. The long duration 20+Y UST ETF (TLT) is in last place. We see the E&P ETF (XOP) and Health Care ETF (XLV) as the only equity ETFs in the bottom quartile. RFK Jr is likely to hang over the Pharma names in XLV and there will be questions around the repeal of ACA that could also weigh on constituents until the legislative agenda gets sorted out.
See also:
Mini Market Lookback: Market Delinks from Appointment Chaos… For Now 11-23-24
Credit Crib Note: Ashtead Group 11-21-24
Existing Home Sales Oct 2024: Limited Broker Relief 11-21-24
Housing Starts Oct 2024: Economics Rule 11-19-24
Footnotes & Flashbacks: Credit Markets 11-18-24
Footnotes & Flashbacks: State of Yields 11-18-24
Footnotes & Flashbacks: Asset Returns 11-17-24
Mini Market Lookback: Reality Checks 11-16-24
Industrial Production: Capacity Utilization Circling Lower 11-15-24
Retail Sales Oct 2024: Durable Consumers 11-15-24
Credit Crib Note: United Rentals (URI) 11-14-24
CPI Oct 2024: Calm Before the Confusion 11-13-24
Footnotes & Flashbacks: Credit Markets 11-12-24
Footnotes & Flashbacks: State of Yields 11-11-24
Footnotes & Flashbacks: Asset Returns 11-10-24
Mini Market Lookback: Extrapolation Time? 11-9-24
The Inflation Explanation: The Easiest Answer 11-8-24
Fixed Investment in 3Q24: Into the Weeds 11-7-24
Morning After Lightning Round 11-6-24
Payroll Oct 2024: Noise vs. Notes 11-2-24
All the Presidents’ Stocks: Beware Jedi Mind Tricks 11-1-24
PCE Inflation Sept 2024: Personal Income and Outlays 10-31-24
Employment Cost Index Sept 2024: Positive Trend 10-31-24
3Q24 GDP Update: Bell Lap Is Here 10-30-24
The Politics of Objective GDP Numbers: “Flex Facts” on Growth 10-30-24
Tariffs: The EU Meets the New World…Again…Maybe 10-29-24
JOLTS Sept 2024: Solid but Lower, Signals for Payroll Day? 10-29-24
Trump, Trade, and Tariffs: Northern Exposure, Canada Risk 10-25-24
Durable Goods Sept 2024: Taking a Breather 10-25-24
New Home Sales: All About the Rates 10-25-24
PulteGroup 3Q24: Pushing through Rate Challenges 10-23-24
State Unemployment Rates: Reality Update 10-22-24
Trump at Economic Club of Chicago: Thoughts on Autos 10-17-24