
New Home Sales May 2025: Slip and Slide
The sharp sequential decline in new home sales reaffirms more of the same bad news heard from major builders


Another weak month for new home sales is joining the chorus of news flow on a softer homebuilding season.
The critical South region at over half the volume turned in a -21% sequential decline and -15.5% YoY.
Completed homes for sale are at a 1-year high with median prices climbing sequentially to $426.6 K or above 10 of the prior 12 months.

The above chart updates the new single family sales time series from 1963, and the current 623K is a big sequential move lower of -13.7% driven by -21.0% in the critical South region that accounts for 56% of total US sales.
The tariff noise is staying high after some headline domination by Iran news. Confusion continues around what final tariffs will look like as they roll out in a sea of disinformation, so the “economics of the consumer sector” remains highly uncertain.

The above two-sided chart shows the sales pattern for the new home sales line since 2000 vs. the median prices, which weighed in at over $426K for May. The fact that prices had trended materially higher across the post-COVID cycle is old news, but the sensitivity of monthly payments is married to mortgage rates and remains a critical variable and stubbornly high at the current 6.81%. Mortgage rates remain the primary driver of weaker volumes in the lower price tiers in both new and existing home sales (see Existing Homes Sales May 2025: Sequential Stronger, YoY Weaker 6-23-25).
For the sweet spot in the mid-price tiers, the combination of lower prices in some cases and sustained incentives is part of a pattern of gross margin erosion into 2025. Each builder has distinctive geographic mix shifts to consider when framing ASP trends. We looked at a number of those trends in our single name coverage (see links at the bottom).
The current $426.6K price ticked higher sequentially from a revised $411.4K. That is above the calendar 2024 median of $420.3 and below the 2023 median of $428.6. While prices always come with a very big asterisk of regional mix and product tier shifts, we are starting to get more color from builders on the mixed challenges of cost creep and the sustained need to discount prices or offer incentives. That means margin squeeze. We are seeing numerous major builders post declining orders and lower backlogs in earnings reports. The “pace vs. price” topic is hot again.
We also hear more often that the mortgage buydowns don’t work as well as they used to even when the market was seeing higher mortgage rates. Consumers are doing more than monthly payment math as sentiment weighs in.
The 200-bps range since the fall 2023 period had shifted the relative focus to increase “specs” inventory strategies during 2024 and into 2025, but some builders are gradually pulling back on that mix in a sign of cyclical defensiveness. That was discussed by Meritage in great detail as a spec player (see Credit Snapshot: Meritage Homes (MTH) 5-30-25) and also by KB Home as an operator with a built-to-order emphasis (see KB Home 2Q25: Negative Industry Trends Keep Coming 6-25-25).
The above chart updates the running median price trends. Builder fears of higher materials and supplier chain costs are not going to do much to relieve homebuilders in their pricing strategies with gross margins softening in 2025. That said, most are still above pre-COVID levels even if down from peaks in 2022. The word “normalization” shows up more lately, but there are also ample cyclical reasons for prices to react to weaker demand.
The builders need to frame how they can get into a gross margin zone that works, and they know that the expectation of costs can get wagged meaningfully by tariffs. The NAHB has put out some numbers for the average home cost from recent tariffs (over $9K per average home). We have commented on the NAHB view on tariff distortions in the past. They will be very busy in the coming months sorting out what is next subject to “the pause” and what comes out the other side. Canada is the big swing factor.
Lumber is in the Section 232 process with duties already quite high with brutal (and rising) tariffs on Canada imports. The same is true for Mexico on its tariffs and building-related supplies such as gypsum. The NAHB published an updated commentary on tariffs last month (see NAHB: How Tariffs Impact the Home Building Industry March 2025, NAHB Members Cite Impact of Tariff Uncertainty on Home Building 5-22-25). That news was not good.
The homebuilders downplay the problem on earnings calls and let the NAHB trade group do their talking for them. The bottom line is lumber, material, appliances, etc., will bring lower margins or higher prices or both.

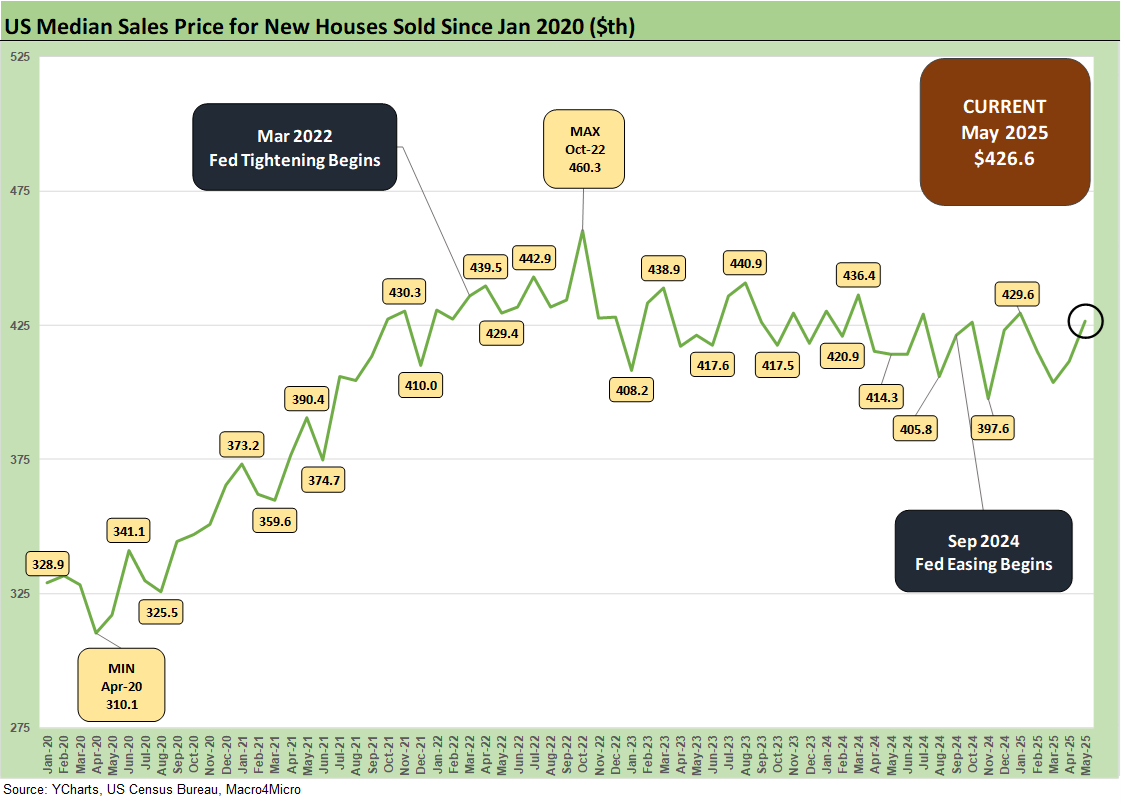
The above chart gives a different visual angle on the median home prices from early 2022. That is a lot of $400K handles with one sub-$400K outlier in Nov 2024. The current $426.6K is above 10 of the past 12 months.

The above chart updates the share of total home sales captured by new homes given the constraints on existing home sales. Existing totals always dominate the total home sales number but have been reeled in this cycle on the “golden handcuff” challenge with so many sub-3% and sub-4% mortgages in a market where high 6% and low 7% are on the other side of a home sale when the buyer looks to move up or downsize. That means monthly payment pressures. For May 2025, new home sales captured 13.4% of total home sales (down from a high of 15.5% in Sept 2024) vs. the long-term median of 11.5%.
The focus on mortgage rate headwinds has been a feature of the post-tightening cycle demand trend as volatility in long rates since later 2023 made home closing and delivery schedules tight and a factor in inventory planning. “Move-in ready” or “within 60 days of move-in ready” became a part of working capital management. Even a luxury player such as Toll gave that factor more consideration. The summer “inflation watch” and sustained focus on steepening risk will keep this topic alive.

The time series above updates the new single family home sales across the cycles since 1973 for the #1 and #2 regions of the South and the West. The 349K for the South is around 56% of the total of all single family new home sales (SAAR) and marks a sharp sequential drop of -21% from April and -15.5% YoY. The West at 159K is 26% of the total. The West was -5.4% sequentially and +8.1% YoY

.The timeline for new home sales for the smaller Midwest and much smaller Northeast market is detailed above. The Midwest (12% of total) was -7.1% sequentially and -3.7% YoY. The Northeast market (5% of total) was +32.1% sequentially and +48.0% YoY.
See also:
Footnotes & Flashbacks: Credit Markets 6-23-2025
Footnotes & Flashbacks: State of Yields 6-22-2025
Footnotes & Flashbacks: Asset Returns 6-22-2025
Mini Market Lookback: FOMC Spoke Clearly, Iran and Trump up next 6-21-25
Housing sector:
Existing Homes Sales May 2025: Sequential Stronger, YoY Weaker 6-23-25
Home Starts May 2025: The Fade Continues 6-18-25
New Home Sales April 2025: Waiting Game Does Not Help 5-23-25
Homebuilders:
KB Home 2Q25: Negative Industry Trends Keep Coming 6-25-25
Lennar 2Q25: Bellwether Blues 6-20-25
Credit Snapshot: Meritage Homes (MTH) 5-30-25
Homebuilder Rankings: Volumes, Market Caps, ASPs 5-28-25
Credit Snapshot: PulteGroup (PHM) 5-7-25
Credit Snapshot: Toll Brothers 5-5-25
Credit Snapshot: D.R. Horton (DHI) 4-28-25
Credit Snapshot: Lennar (LEN) 4-15-25
Credit Snapshot: Taylor Morrison Home Corp (TMHC) 4-2-25
Lennar: Cash Flow and Balance Sheet > Gross Margins 3-24-25
KB Home 1Q25: The Consumer Theme Piles On 3-25-25
Toll Brothers 1Q25: Performing with a Net 2-20-25
Credit Crib Note: Lennar Corp (LEN) 1-30-25
D.R. Horton: #1 Homebuilder as a Sector Proxy 1-28-25
KB Home 4Q24: Strong Finish Despite Mortgage Rates 1-14-25
Toll Brothers: Rich Get Richer 12-12-24