
Past-Prologue Perspective for 2025: Memory Lane 2018
We look back at a highly volatile 2018 with record equity markets by summer before tariff chatter and oil volatility upset the buzz.


Things happen…
In a frame-of-reference and memory jogger commentary, we look back at the transition from the record tax cuts in Dec 2017 into a very volatile 2018 that saw major late year swings in HY spreads as well as a plunge in large and small cap equities after initially hitting record highs in Aug 2018.
The year 2018 was the only time since fixed income indexes started that cash outperformed all the major US credit and equity benchmarks in what was a brutal set of annual return numbers (see Histories: Asset Return Journey from 2016 to 2023 1-21-24).
Oil also went on a wild ride in 2018 as the last gasp of the record energy credit default cycle was playing out after the late 2014/early 2016 oil market crash. Oil crashing can be the ultimate household tax cut and a useful inflation antacid, but weak oil and gas wags the securities of some major industry groups.
Following 2018, the asset return rebound saw a banner year for risk after a low starting point coming off what was a borderline crash in Dec 2018. The FOMC easing was a major catalyst in 2H19 on weaker economic fundamentals and lighter inflation also helped getting the FOMC to pull the trigger.
That FOMC support seen in 2019 will loom larger in current times of 2H25 once tariff impacts get a broad market test. Many more Section 232 tariffs are rolling into inventories and transaction prices across end markets (pharma, semis, aircraft/parts, copper, lumber), so there are more tests ahead. Meanwhile, Reciprocals and IEEPA get their day in court with SCOTUS.
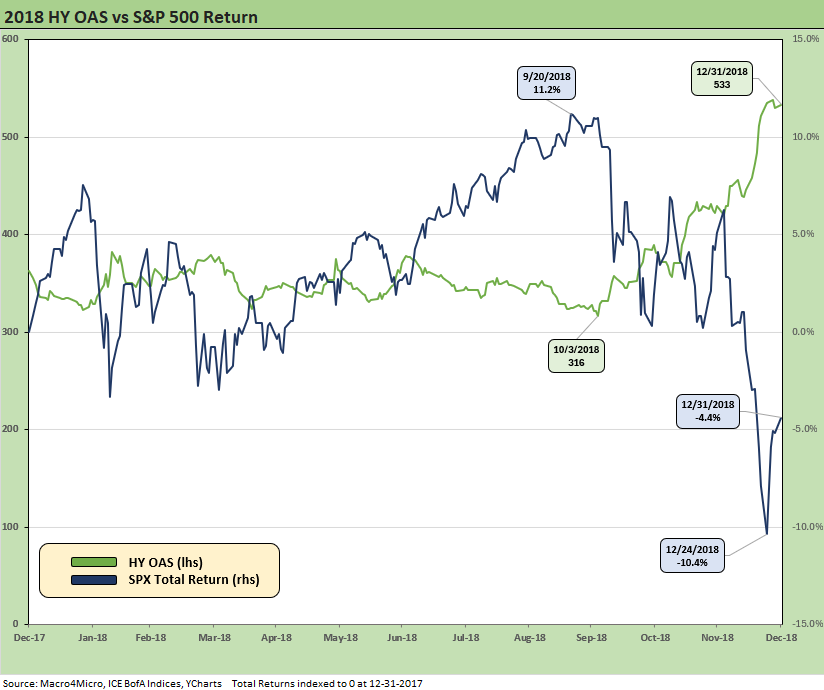
The above chart flashes back to the running returns on the S&P 500 during 2018 alongside HY OAS. HY spreads had hit a cyclical low in early Oct 2018 before a painful spread gap and major decompression wave from the bottom up that accelerated into December.
For more highlights and not-so-fun facts on 2018, see earlier commentaries (HY Pain: A 2018 Lookback to Ponder 8-3-24, Histories: Asset Return Journey from 2016 to 2023 1-21-24, HY Multicycle Spreads, Excess Returns, Total Returns 12-5-23). The reality of the objective metrics is that the capital markets had a very bad 2018 coming off the record tax cuts passed in Dec 2017. That bad year is seldom mentioned.
Overall, the market cratering in late 2018 after record highs in equities and cyclical lows in HY spreads is very hard to explain. It seemed strange then and remains a challenge in retrospect. The oil price fallout for low end HY issuers is easier to explain. Some observers looked at the trade policy noise and tariff saber rattling while others worried about “sugar high” flameouts of demand from the tax incentives after a brief spike in nonresidential investment in 2018.
As of 2018, the cycle in years (from the year June 2009 trough) was also aging (before it set a record ahead of COVID). It is hard to slap an age on the current cycle given a 2-month recession with COVID. It is either young or old with a COVID timeout that fueled a boom in new bond issues and heightened speculative growth risk hunger in equities (2021). ZIRP brought low coupons and saw corporate borrowers and households (mortgages) locking in a record low cost of debt in bond markets.
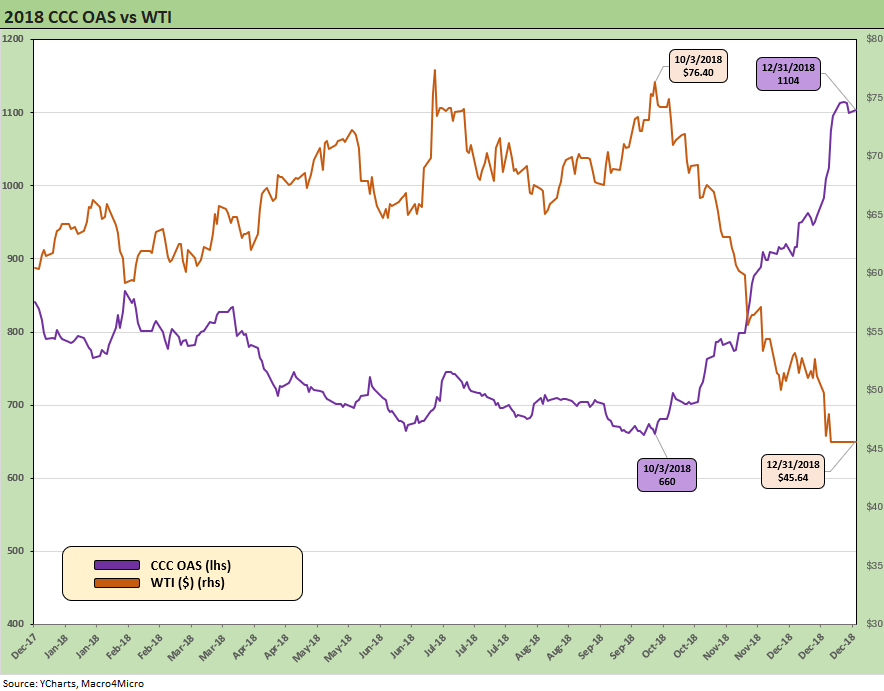
The above chart revisits how the CCC tier at the bottom of the credit food chain imploded at the end of 2018. The sell-off saw a spread decompression wave that reverberated up and across the credit tiers. The energy sector was still limping home and the oil & gas sector default rates of 2018 essentially halved in 2019.
Defaults are a lagging indicator, and it was hard to find a path in 2019 to a major HY bond default cycle just as it hard today to see a material rise in HY bond defaults (private credit is a separate topic). The 2019 risk rally comeback could have kept rolling on except for the near-death blow of COVID in March 2020 when HY OAS hit 1,087 bps and a composite dollar price of 78.6. Dec 2019 had ended at par plus for the HY index. COVID changed the rules for a while but then set off a fresh low coupon refi rally in critical risky asset classes from mortgages to corporate credit. During COVID, the Fed and fiscal support eased market worries in record time.
The good news for HY investors in the current markets in 2025 is that we see a very different HY issuer mix now (e.g. less E&P to get in trouble) than 2018 and materially higher new issue with current coupon in HY deals. The higher yield curve is very different than the post tightening cycle after the ZIRP/QE and slow normalization brought so many low coupons into the market. The new refinancing and extension cycle increases the cash component of total return with each new issue. The supports demand.
The industry mix risks and overall risk profile in the low end of HY is very different in 2025 than in past cycles given the rise of private credit, which is where the most aggressively leveraged transactions have found their home. The traditional late cycle excess that has unfolded every cycle since the infamous 1980s LBO boom (with the natural Glass Steagall conflicts in the capital structure between banks and bonds) is not the status quo in 2025. These days, the private equity players can keep the capitalization game plan in-house (more or less) and leverage their outside sources of funding for such deals. The HY bond market is not the targeted funding source for LBOs as it was in bygone credit cycles.
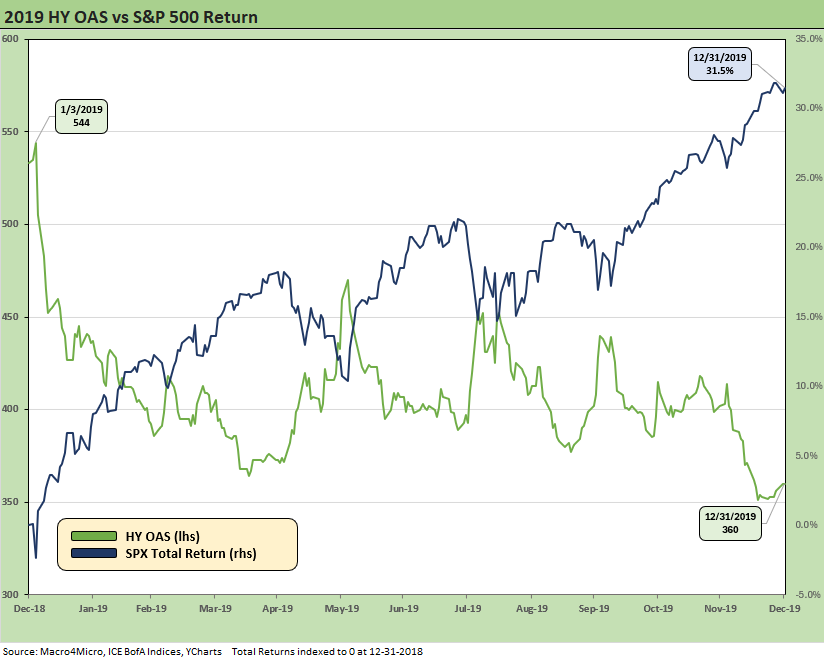
The above chart looks across how 2019 played out. It was a great year for risk and the numbers speak for themselves. The spread tightening and equity rebound masks some of the drama around the economic cycle and tariff battles that pressured some of the GDP lines. Relative value after 2018 risk repricing and FOMC support were the main events.
For all the talk of greatest economy and since the Big Bang, the 2017-2019 period was more mixed. The year 2017 posted an annual GDP of only +2.5%, 2018 at +3.0%, and 2019 at only +2.6% before the COVID pain of 2020 saw -2.2% (see Trump's “Greatest Economy in History”: Not Even Close 3-5-25). Such low growth markets continued a trend that started under GW Bush and continued with the Obama, Trump 1.0, and Biden terms.
The FOMC easing in 2019 included concerns around fixed investment trends and weak exports. A broader set of trade war in 2025 might prompt some FOMC support for one of those – weak exports – for a 2019 style easing, but the fears of the price (inflation) impact on Goods and Services from tariff transaction effects could then in turn shelve any such easing without payroll weakness sending the “employment” part of the Fed mandate into high gear.
As a memory jogger, the summer and fall 2019 FOMC statements raised some issues:
From FOMC Statement in July 2019: “Although growth of household spending has picked up from earlier in the year, growth of business fixed investment has been soft.”
From Sept 2019: “Although household spending has been rising at a strong pace, business fixed investment and exports have weakened.”
You can make a case that some of these same issues will be surfacing in 2H25. The question will be to what extent the tariff inflation fear will hold back the FOMC. There is also the swing factor of weaker payroll that could hand the FOMC an excuse. Weaker payrolls are not here in a meaningful way yet despite the ADP numbers this week, and we will get some fresh BLS numbers this Friday for May payroll. The big difference in 2019 was low inflation and low inflation fear. That is not the case with tariffs in 2025. Core inflation was quite low in 2019, so the FOMC could take action across the summer and fall of 2019.
For the current backdrop of 2025, Trump wants the FOMC to pull the trigger first before empirical evidence demonstrates what could be wrong with the foundation of his tariff game plan. He wants some blurring in the performance attribution analysis and a scapegoat if (when?) tariffs don’t bring the marketed benefits.
GDP growth assumptions as a swing factor…
The post-2000 low GDP growth rate of the US economy gets back into the “This Time is Different” theories on how high systemic sovereign debt leverage is a surefire way to assure low GDP growth and increase the risk of debt macro “events.” There is no quantified trigger point in systemic leverage that sets the curtains on fire (even if that was my own takeaway from the book), but the history of nondollar countries running mismatches on assets and liabilities have always been the most vulnerable to crisis (i.e. EM countries).
The US as the global reserve currency creates a lot of other macro debating points. When leaders such as Jamie Dimon are out talking about potential bond market events (a “crack”), then you need to put that risk on the front burner to monitor. The White House is viewed as heavily axed in denying any such risks (you cannot even get the spokesmodels to admit in clear language that the buyer/importer writes the check for the tariff), so the market needs some “story value” to lean on. Trade wars and potential trade wars with major holders UST bonds do not help the pep talk.
These are topics for other commentaries, but the headlines around the disconnect of the dollar and UST yields, de-dollarization, and old-fashioned supply and demand for UST in a world of severely deteriorating international relations with allies is not letting minds rest easy. We see notably bad relations between the US and its EU and Canada “allies” with a dash of Japan and South Korea who are all under tariff siege. Tense geopolitics are not helping the subjective story line either (Taiwan, Ukraine).
The current debates on GDP growth rate assumptions and how that flows in deficit estimates have been contentious issues the past few weeks, and the OECD notching down US GDP growth forecast to 1.6% in 2025 and 1.5% in 2026 (below the CBO assumptions of 1.8%) was not fortuitous timing. The White House and Congress advocates of the Big Beautiful Bill say a minimum of 3% GDP growth is required for the forecasts. Here is a credibility check:
How many annual calendar year GDP growth rates did Trump hit 3.0% or higher during Trump 1.0? Answer: 1 time. During 2018 at 3.0%
How many annual calendar year GDP growth rates did Biden hit 3.0% or higher during his single term? Answer: 1 time at +6.1% in 2021.
How many annual calendar year GDP growth rates did Obama hit 3.0% or higher during his two terms? Answer: zero times.
How many annual calendar year GDP growth rates did George W. Bush hit 3.0% or higher during his two terms? Answer: Twice. In 2004 (3.8%) and 2005 (3.5%).
Prior to the 2000 election, Clinton was above 3.0% for 6 of 8 years in his two terms and closed out his run with a balanced budget and stellar sovereign debt metrics (see US Debt % GDP: Raiders of the Lost Treasury 5-29-23). Clinton and Reagan were in a different zip code in GDP growth than the post-2000 administrations (see Presidential GDP Dance Off: Clinton vs. Trump 7-27-24, Presidential GDP Dance Off: Reagan vs. Trump 7-27-24).
While Reagan was the one who initially pushed deficits aggressively higher with his defense plans and tax programs, the sovereign debt profile was very different during those good old days. The bipartisan mix of Clinton and a GOP-heavy Congress “cleaned up Dodge” ahead of the new millennium. In the 1980s, Reagan even backtracked on corporate tax relief (primarily around deductions) and took action to support the revenue line while continuing his push to reduce personal income taxes in the 1980s from that of the 1970s (reminder: top tax rate went from 70% under Carter to 28% under Reagan). The current GOP resists revenue solutions of any type.
The usual reaction when arguing with the CBO is to do some quarterly run rate “forum shopping” for a GDP period with 3% numbers and looking at good recent quarters. It is important to remember that a small shift in inventory investment or trade deficit effects can have a material impact on headline numbers (see 1Q25 GDP 2nd Estimate: Tariff and Courthouse Waiting Game 5-29-25).
We were reading through the OECD report, and the tariff impact does not get favorable reviews for what tariffs mean for global growth or US growth (“reduce global growth prospects and fuel inflation” about covers it). Global GDP growth was reduced from 3.3% to +2.9%. The fallout from trade policies was cited as a likely cause of risk repricing in financial markets. That does not promote optimistic forecasts since the Fed has similar concerns as do many other constituents in the “real economy.”
See also:
1Q25 GDP 2nd Estimate: Tariff and Courthouse Waiting Game 5-29-25
Trump's “Greatest Economy in History”: Not Even Close 3-5-25
HY Pain: A 2018 Lookback to Ponder 8-3-24
Histories: Asset Return Journey from 2016 to 2023 1-21-24
US Debt % GDP: Raiders of the Lost Treasury 5-29-23
Expansion Checklist: Recoveries Lined Up by Height 10-10-22
Business Cycles: The Recession Dating Game 10-10-22
Inflation: Events ‘R’ Us Timeline 10-6-22