
Footnotes & Flashbacks: Credit Markets 6-30-25
A big rally week for equities, a modest UST curve shift lower, and tighter credit spreads made for a nice wrap to 1H25.


A mixed picture, some drama, lots of action, and too many targets.
The week saw IG remain in double digits below the 90 bps line while HY spreads at +302 bps look more like the end of June 2007 (Footnotes & Flashbacks: Credit Markets 2-17-25, HY Spreads: Celebrating Tumultuous Times at a Credit Peak 6-13-24)
The 2Q25 credit spreads swing down and back was still easier on credit volatility relative to numerous past periods of anxiety, but the 3Q25 range of outcomes ahead will involve processing a lot of uncertainty around the final tariff scoresheet, a record supply of UST ahead, a weaker dollar, and a widely divergent set of views on how the tariffs will flow into the pricing of goods vs. pain for the expense line.
The modestly positive excess returns YTD for credit and the favorable recent moves in the UST will still turn from here on the evolving inflation view and tangible metrics by product group and what it means for duration. That tariff fallout (or lack of) will matter more than whether the FOMC makes a small move to address the anomalous inversion on the front end. We see the recurring comparison to 2018-2019 by tariff advocates as a false premise given the sheer scale and breadth of the current tariff game plan which still needs a lot more detail.
The FOMC forecasts showed steady increases in PCE inflation while myriad GDP forecasts show materially weaker US GDP growth for 2025 and 2026. The payroll report in this holiday-shortened week will be one more step in framing how the Fed can find an excuse to ease as we move from the first inflation cycle since the early 1980s into the first aggressive tariff program since 1930.
Below we update our rolling weekly credit markets commentary and spread recap. We already addressed a range of moving parts in our earlier posts over the weekend:
Footnotes & Flashbacks: State of Yields 6-29-2025

The above chart updates the credit spread deltas for 1-week and 1-month and the trends remain positive for credit and IG and HY bonds. Spreads were tighter and quality spread differentials compressed on the HY rally after the painful spread wave that came with the Liberation Day shock (see Tariffs: Diminished Capacity…for Trade Volume that is… 4-3-25, Reciprocal Tariff Math: Hocus Pocus 4-3-25, Reciprocal Tariffs: Weird Science Blows up the Lab 4-2-25).
The rally back to +302 in HY is a vote of confidence in the balanced credit picture and the better positioning in higher income, shorter duration assets during a period of UST uncertainty. The BB heavy weighting of the HY index has been supportive of returns as noted in the next chart.

The above chart updates the YTD total return and excess return for IG and HY as well as the credit tiers. Overall excess returns are not impressive but IG and HY are at least positive. Total returns show the benefits of the modest bull steepener that has supported the short to intermediate UST curve segment (see Footnotes & Flashbacks: State of Yields 6-29-2025, Footnotes & Flashbacks: Asset Returns 6-29-2025 ).

The double-digit IG spreads are back to near cyclical lows of prior credit cycles but still above the 4Q24 lows of +77 bps. The long-term IG OAS median of +129 bps leaves a lot of room but drives home how this market is priced in a rarefied spread range. With a 5.1% yield offered by the IG index, current coupon new issues whether “new money” or refinancing low coupon bonds bring a very solid base of demand after years or ZIRP and normalization coupon level in portfolios. Income is back in the picture this credit cycle.

At +302 bps, the HY OAS looks more like Dec 2021 and inside credit cycle low points such as Jan 2020 ahead of COVID, the early Oct 2018 lows and the June 2014 lows. The recent 2024 lows of +259 bps in Jan 2025 will keep the uber-bulls in the game, but the tariff clock is ticking and the consumer is slowing down as noted in recent releases. That is a balancing act with the FOMC and the stagflation anxiety.

The “HY OAS minus IG OAS” quality spread differential at +214 bps remains wider to early 2025 but is back around Dec 2021 and early Oct 2018 levels. That allows little room for setbacks.

The “BB OAS minus BBB OAS” quality spread differential is back in the low 60 area and modestly above the +55 lows of summer 2024. That BB/BBB divide can swing around as we saw with the spike to +158 bps after Liberation Day. Autos and Energy will be important sectors to watch for potential volatility in those tiers.
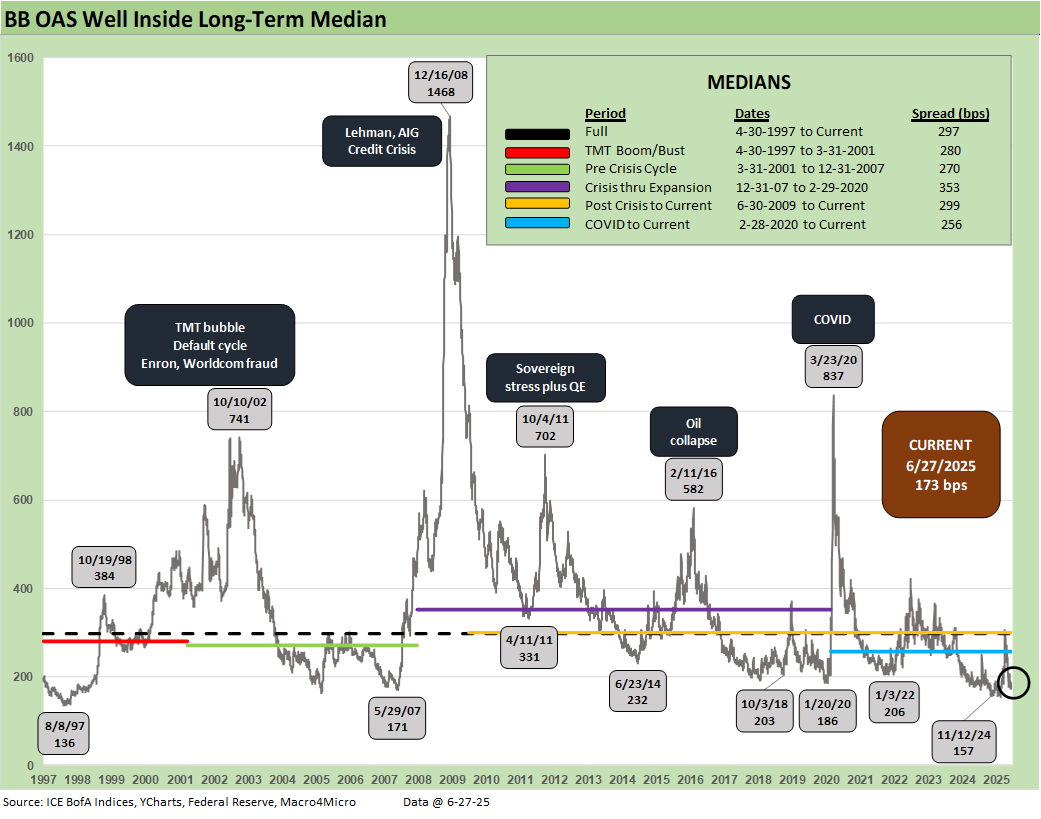
The sub-200 BB tier OAS line is a rare one to cross and the BB composite is back to +173 bps. That is above the dazzling +157 bps low of Nov 2024 but well inside the long-term median of +297 bps. Oct 2018 lows of +203 bps is a notable comp for a frame of reference. That was right before a fresh sell-off in energy into Dec 2018.

The B tier is the sweep spot of legacy HY fund investors and the current +311 bps is inside Oct 2018 and June 2014 lows and 154 bps below the long-term median.
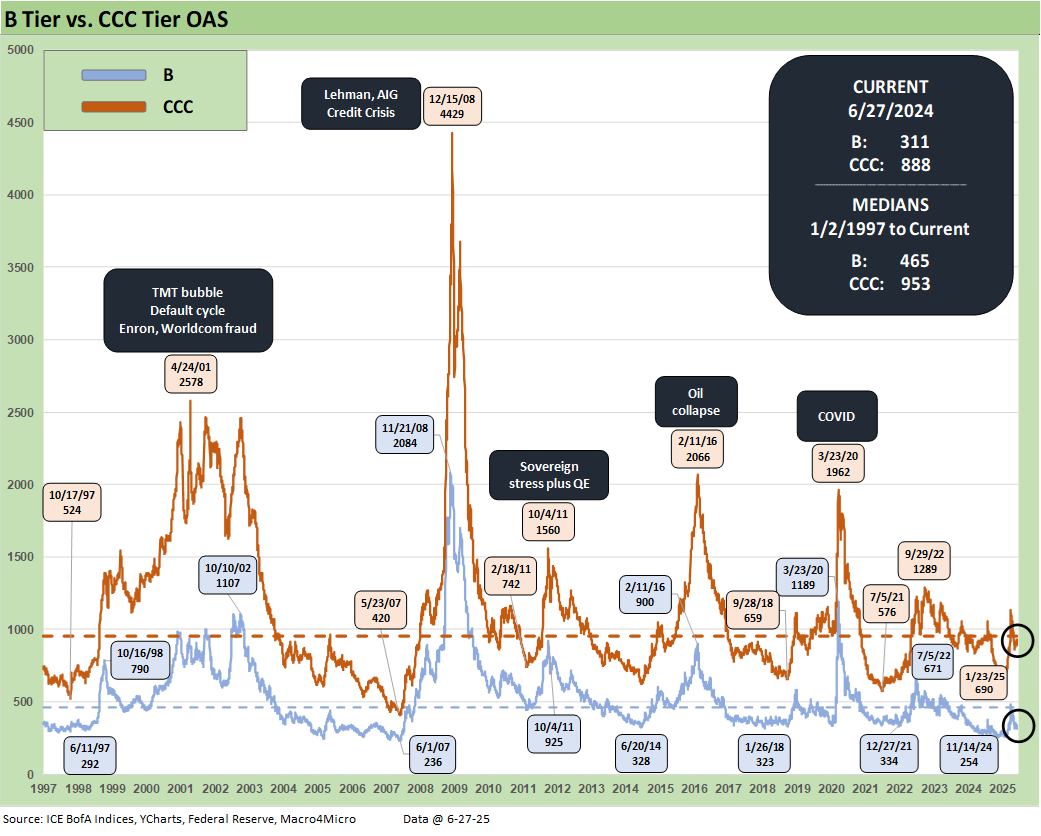
The B vs. CCC tier OAS time series is plotted above. The timeline for B and CCC spreads highlights the points of major divergence along the way (see The B vs. CCC Battle: Tough Neighborhood, Rough Players 7-7-24).
The current CCC tier OAS at +888 bps tightened by -26 bps the past week though remained under the long-term median of +953 bps. The CCC YTW dipped below 13% to 12.86% after being above 14% recently. The underlying constituents are widely dispersed across an 82.5 composite dollar price. The CCC tier is still in the pricing zone of equity risk-returns with such yields.
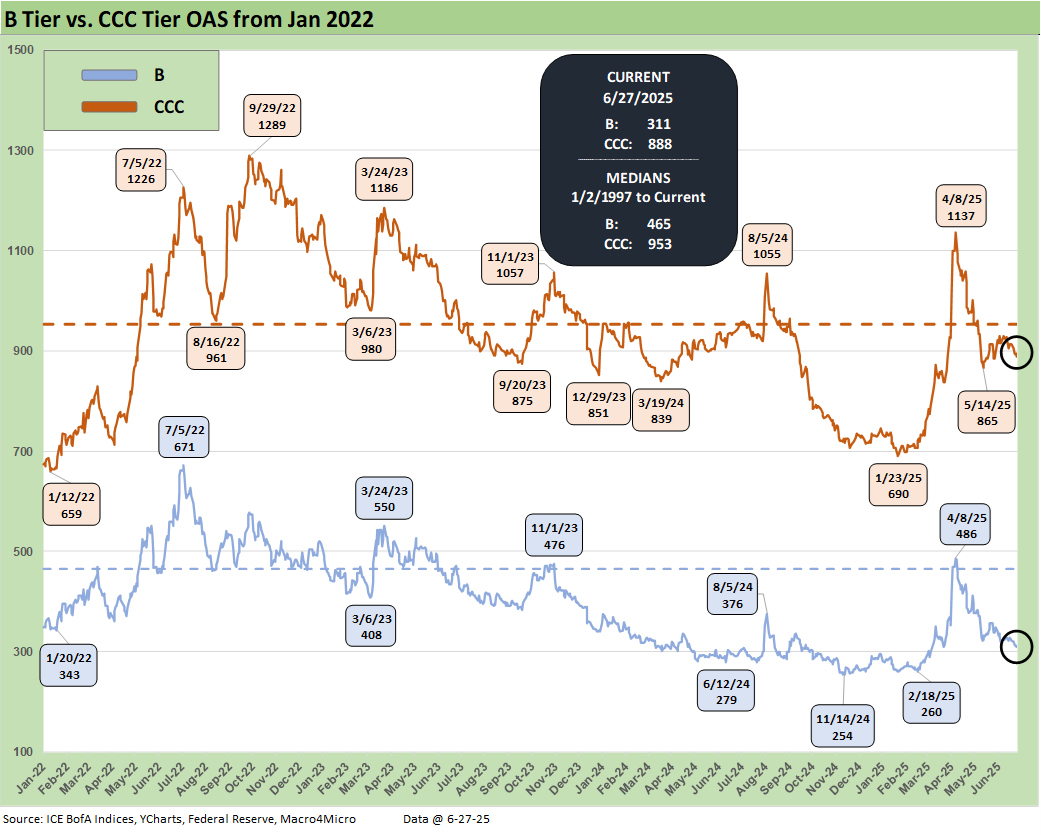
The shorter timeline from Jan 2022 just ahead of the end of ZIRP and start of the tightening cycle gives better granularity on the movements from a low for CCCs of +659 bps in Jan 2022 to a peak of +1226 bps in July 2022 and +1289 bps to end Sept 2022. Then spreads came down to the Jan 2025 tights of +690 bps ahead of the recent spike and whipsaw to current levels.

The B vs. CCC tier differential is broken out with the current +577 bps still higher than the long-term median of +485 bps and above the distinct market time horizons with the exception of the TMT HY credit cycle with its +702 bps median. The risks this year have seen CCC tier spreads remain wider by +142 bps YTD after the earlier whipsaw while the B tier is only +15 bps wider YTD and BB is -13 bps tighter YTD.
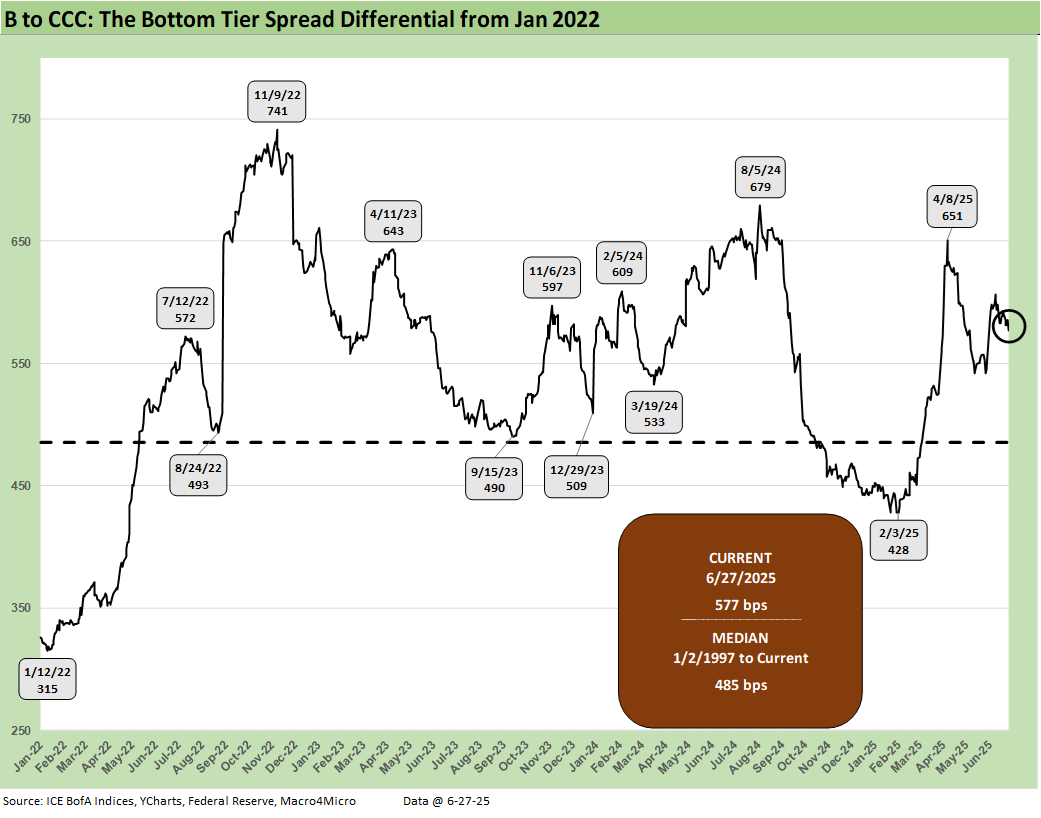
The above chart frames the “B vs. CCC tier” quality spread differential across the short timeline for better granularity. Quality spreads had widened with a vengeance since the low of Feb 2025 at +428 bps even if quality spreads recovered to +577 bps from the early April spike to +651 bps on April 8.
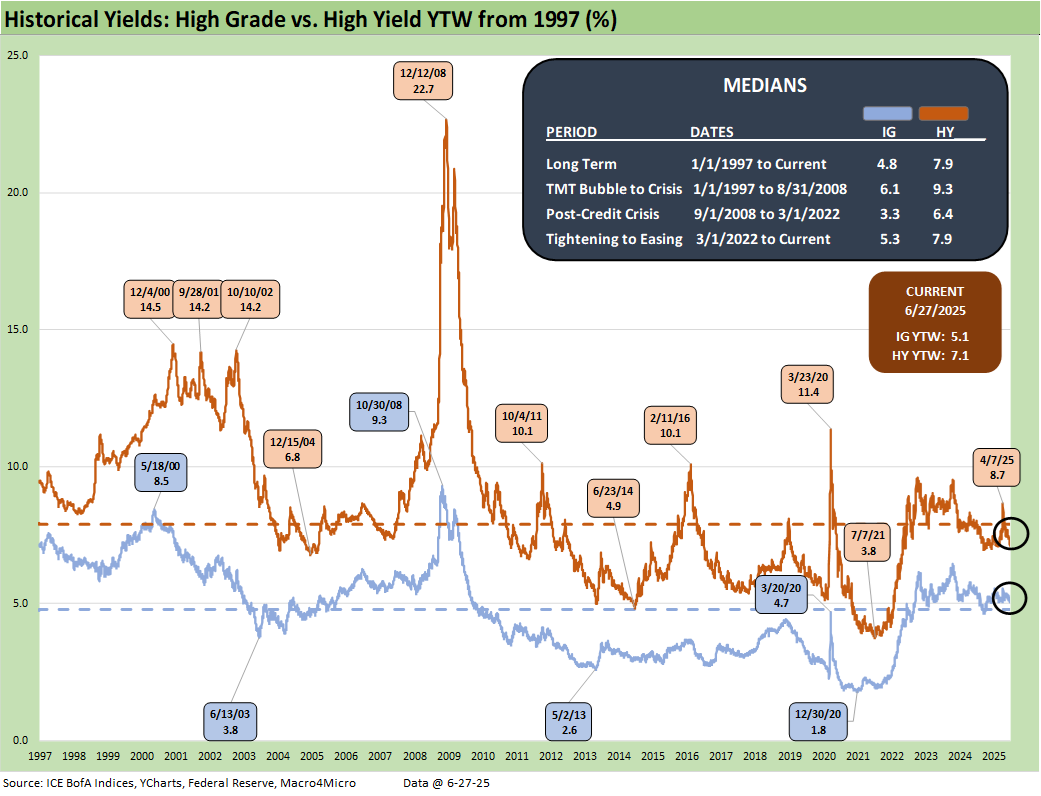
Moving away from spreads, which are well below long-term medians this week, yields for both IG and HY have a more complex story in historical context given the post-crisis distortions of ZIRP and “normalization.” The normalization period of Dec 2015 to Dec 2018 never really got on track with the economic weakness and Fed easing of 2019 followed by a COVID crisis and return to ZIRP in Mar 2020 (ZIRP ended March 2022). As a reminder, 2018-2019 was the “Greatest Economy in History” according to the current White House resident.
The current IG YTW at 5.06 % (vs. 5.18% last week) decreased as the lower UST pushed yields lower and remains below the 6.1% pre-ZIRP median on overall YTD UST curve moves.
The HY YTW decreased to 7.11% this week (from 7.33%) vs. a pre-ZIRP 9.3% median. We consider the pre-ZIRP years the most rational frame of reference in light of the post-crisis ZIRP and QE as well as the COVID Fed reactions.
Spreads will remain a key swing factor for reaching those yield medians of pre-ZIRP years, and we just saw material volatility in credit risk pricing in HY since early April. Then came a fresh rally after Iran and optimism on how the tariff pause will play out. UST yields are a tougher call with the tariff backdrop that still threatens stagflation as well as the potential for a further technically driven upward UST curve shift on the supply-demand fears.
Stagflation risk remains in the debate. Away from stagnation + inflation, old fashioned recession risk would pressure UST rates lower and credit spreads higher, but this is no ordinary cyclical turn. We cover the UST shapeshifting in our separate Footnotes publication on the State of Yields as the UST curve lowered this week again.
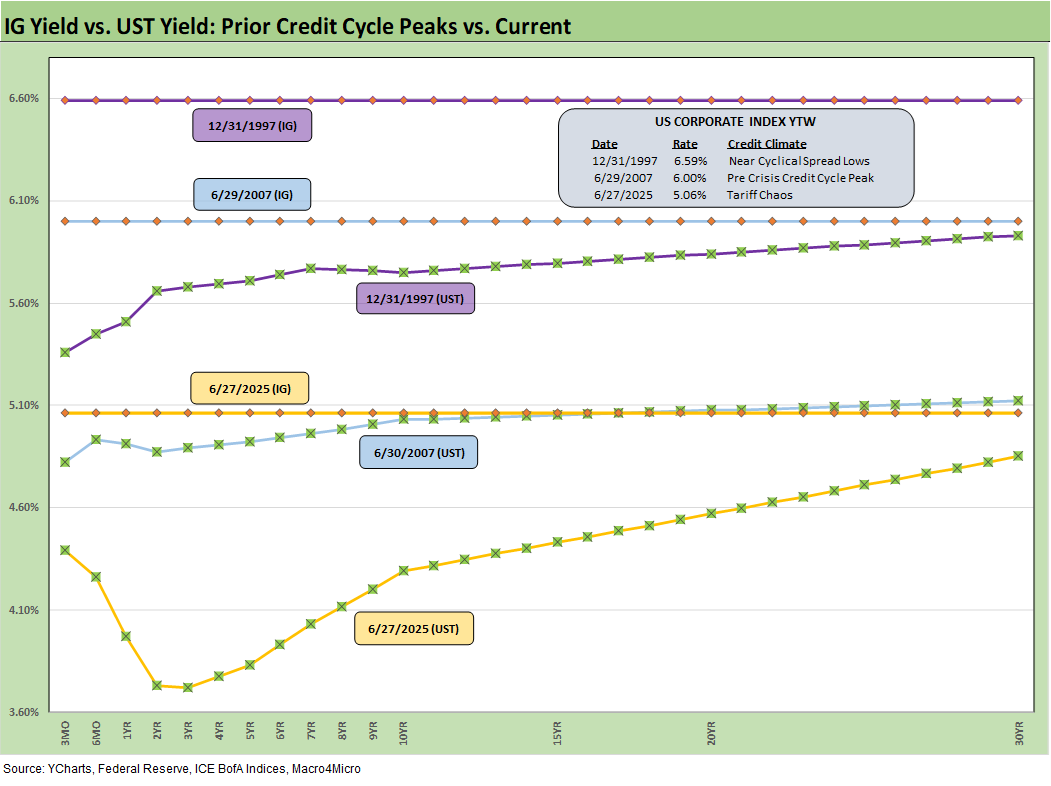
The above frames current IG index yields vs. previous credit peaks along with their respective UST curves. We include both prior credit peaks in June 2007 and Dec 1997 for context as prior peak credit cycles when high risk appetites saw investors chasing yields. Those 1997 and 2000 markets saw poor risk symmetry and low spreads.
Today’s UST curve is still low in the context of those historical credit peaks. We saw a recent glimpse of rising long yields along the timeline and the return pain that comes with it. The focus remains on the budget deficit and UST supply as the main driver for duration risk here as we get clarity on the size of the deficit increase and how the debt ceiling will be addressed. Stagflation risks stay in the mix with the current market beyond the credit cycle peak after the tariffs, and long dated yields still could go higher along with spreads widening again for another round of return pain.
The short to intermediate IG market is still the safest bond game for now. The funds that are asset class constrained to HY can take refuge in the higher quality layers. Overall corporate default risks in HY bonds remain in check (private credit is its own distinct story and mix).

The final chart does the same 1997 and 2007 drill but for HY index yields. This week’s UST move leaves HY index yields below prior peak credit cycles at 7.11% as of Friday vs. 7.96% in June 2007 and 8.60% in Dec 1997. The recent spread widening had moved HY index yields higher, but the recent reversal and rolling UST moves leave the current HY index YTW below both the 2007 peak and 1997 HY index levels.
The widening during April gave flashbacks to the volatility and major spread moves of the 1997-98 and 2007-08 periods that also posted triple-digit widening months. The sheer speed of risk repricing that has happened in earlier cycles offers reminders even if those moves were for very different reasons.
Below we roll forward some updated commentary on the credit cycle…
The challenge is identifying a fundamental transmission mechanism to more trouble for financial metrics and relative risks of default. Identifying a catalyst for pain in the current market would highlight tariffs or trade wars hitting the macro drivers (the consumer) and micro drivers of corporate profitability and cost mitigation actions to offset the tariff expense. The oft misrepresented “buyer pays” reality will hit margins or requires higher prices.
The recent tariff strategy is both unpredictable and unprecedented in modern capital markets, but at least the banks are much healthier. US-China trade talks calmed some troubling trade nerves and put out a fire, but the most recent Section 232 hike to 50% on steel and aluminum is still a fresh wound with a lot more to come in areas such as pharma and semis among others. Those are fighting words with key allies (see US Trade in Goods April 2025: Imports Be Damned 6-5-25, Tariffs: Testing Trade Partner Mettle 6-3-25).
The next trigger will be when reciprocals get handed down or discussions with the EU fail. Canada is walking a tightrope while Mexico is somewhat MIA. There is always a risk that one trade partner taking on the bully will lead to more. Japan and South Korea had not struck a deal and are likely to be assigned tariffs at this pace.
The overall uncertainty in getting trade deals over the line remains a threat to inflation, the cycle and corporate profitability. Reciprocal tariffs are teed up to be “assigned” again rather than negotiated. The “90 days, 90 deals” mantra is gone. The clock is ticking.
We also see higher quality levels in the HY bond index as a starting point vs. 2007 and the late 1990s TMT bubble years. The reality is the tariff impacts and supply-side disruptions are only now just beginning in substance. It is hard to reflect forward-looking risks when so few know (including the White House) what those risks will be. China was a rough lesson for the markets. As we saw with Nike this past week ($1 bn tariff costs), we should see more quantified tariff cost estimates from more companies in June and July quarter earnings reports (Nike was a May fiscal 4Q).
EU is on the pause clock that can be terminated or extended with ease, but Mexico and Canada have outstanding trade war risk as the effects of the tariffs roll in and domestic political pressure picks up for leaders to defend home front interests. It is useful for Trump to play his hand with pauses as the mood moves him in his own murky game theory plan, but corporate investment, big ticket purchase decisions by consumers, and FOMC policy setting can also take a protracted break beyond the pause.
The bad old days…
Looking back even more, the turn in the credit cycle always comes at some point and often with an external trigger or “assist” that can set it off. During 1990, securities firms started to collapse including Drexel’s Chapter 11 in Feb 1990 and bridge loan related bailouts of Shearson Lehman, First Boston, and Kidder Peabody. We do not face that type of financial intermediary meltdown risk here (at least not yet!). In a protracted stagflation bout, eyes will return to the regional banks.
The summer of 2007 was the start of major problems in the credit markets with asset risk and leveraged counterparty exposure and bank/broker interconnectedness risk soaring. Despite that backdrop that worsened in August 2007, the equity markets and S&P 500 and NASDAQ kept on rallying into Oct 2007. Later in the turmoil and well after the fact, the start of the recession was tagged as Dec 2007 (see Business Cycles: The Recession Dating Game 10-10-22).
The 2007 experience reminded the market that credit leads the cycle and equity lags. The same was true in 1999 with the HY default cycle underway and NASDAQ at +86% that year. This time around, the credit markets did not expect the tariff insanity. The initial spread wave in April quickly reversed but there could be fresh rounds. The China downside scenario was the worst and is now a lower risk. What is shocking was the poor White House grasp on the risks. China had a lot more tricks up its sleeve in supply strategies (e.g. pharma).
Buyer “writes the check” on tariffs. Facts matter.
The real economic effects are more geared to the periods ahead when tariffs will be rolling in at the transaction level. That will be the reality point. We expect HY to be unhappy again into the fall and spreads to average wider as the tariffs roll into actual corporate fundamentals.
There are no frictionless wheels in high tariffs. The buyer pays the tariff at customs (literally “writes the check”). How that gets spread around the economic chain from the seller to buyer to wholesale and end customer has a lot of moving parts. The “seller pays” and “selling country pays” has been a clear falsehood from the Trump camp, and he admitted as much when he demanded that Walmart “eat” the tariff cost. Why would there be anything to eat if the seller pays?
Shady and misleading discourse is never new to Washington. Substitute the question “who writes the check to customs” for the “who pays the tariff” and it is easier to corral those who play semantics and tweak key words. The reality is that Trump never “collected hundreds of billions” from selling countries.
Trump recently highlighted his mega collection process yet again, reiterating the hundreds of billions he “collected” from selling countries. He even cited a hard number in one live session ($600 billion). We cannot tell what Trump remembers as a fact and what he made up. Until the tariff deals are put to bed, outsized “surprise risk” in tariffs remains high on the list. Since Trump breached the USMCA, even a deal is not a reliable deal.
See also:
Footnotes & Flashbacks: State of Yields 6-29-2025
Footnotes & Flashbacks: Asset Returns 6-29-2025
Mini Market Lookback: Eye of the Beholder 6-28-25
PCE May 2025: Personal Income and Outlays 6-27-25
Durable Goods May25: Aircraft Surge, Core Orders Modest Positive 6-26-25
1Q25 GDP: Final Estimate, Consumer Fade 6-26-25
New Home Sales May 2025: Slip and Slide 6-25-25
KB Home 2Q25: Negative Industry Trends Keep Coming 6-25-25
Existing Homes Sales May 2025: Sequential Stronger, YoY Weaker 6-23-25
Footnotes & Flashbacks: Credit Markets 6-23-2025
Footnotes & Flashbacks: State of Yields 6-22-2025
Mini Market Lookback: FOMC Spoke Clearly, Iran and Trump up next 6-21-25
Lennar 2Q25: Bellwether Blues 6-20-25
FOMC Day: PCE Outlook Negative, GDP Expectations Grim 6-18-25
Home Starts May 2025: The Fade Continues 6-18-25
May 2025 Industrial Production: Motor Vehicle Cushion? 6-17-25
Retail Sales May 25: Demand Sugar Crash 6-17-25
Mini Market Lookback: Deus Vult or Deus Nobis Auxilium 6-14-25
Credit Snapshot: Hertz Global Holdings 6-12-23
CPI May 2025: The Slow Tariff Policy Grind 6-11-25
Mini Market Lookback: Clash of the Titans 6-7-25
Payrolls May 2025: Into the Weeds 6-6-25
Employment May 2025: We’re Not There Yet 6-6-25
US Trade in Goods April 2025: Imports Be Damned 6-5-25
Past-Prologue Perspective for 2025: Memory Lane 2018 6-5-25
 |
|