
Mini Market Lookback: Clash of the Titans 6-7-25
A solid week at the macro and micro level still managed to come with new variations of ultra strange.


Back in the cave Elon! I am the only Titan in this show.
The week had plenty of theatrics even by Trumpian standards, but jobs were solid, major equity benchmarks were all positive (including 8 of 11 S&P 500 sectors), and there is forward progress on China trade talks being scheduled after some very ugly headlines of late.
Tesla valuations tanked as Trump and Musk had a metaphorical slap fight and pulled each other’s hair, but that should (in theory) pass. Musk should go back to being a genius rather than turbocharging the “idio” in idiosyncratic risk and the valuation parameters of his expansive asset pool.
After the improved JOLTS numbers and steady payroll report, the FOMC will await the many new data points that will be forthcoming as tariffs gradually roll into the transaction level of working capital cycles. The pricing strategies and expense management of those who are impacted will get more visibility. There will be many more tariffs rolling into the market in Section 232 (pharma, semis/electronics, aircraft/parts, copper, lumber…for now).
The pro-tariff rhetoric that favors carpet bombing trade partners with tariffs will keep saying “no reaction” even as they duck discussions of “who writes the check” (the buyer). They basically pretend double-entry accounting does not exist (the old “debits by the window, credits by the door” saying). The frictionless wheel does not exist, and the sea level commentary in trade literature (autos, cap goods, retail, small business trade groups, etc.) are clear on what is unfolding, and it is a problem. Sales pitches and political spin will morph, but expenses will get booked and price decisions and cost cutting actions will be evident even if not tied up with a bow this early.
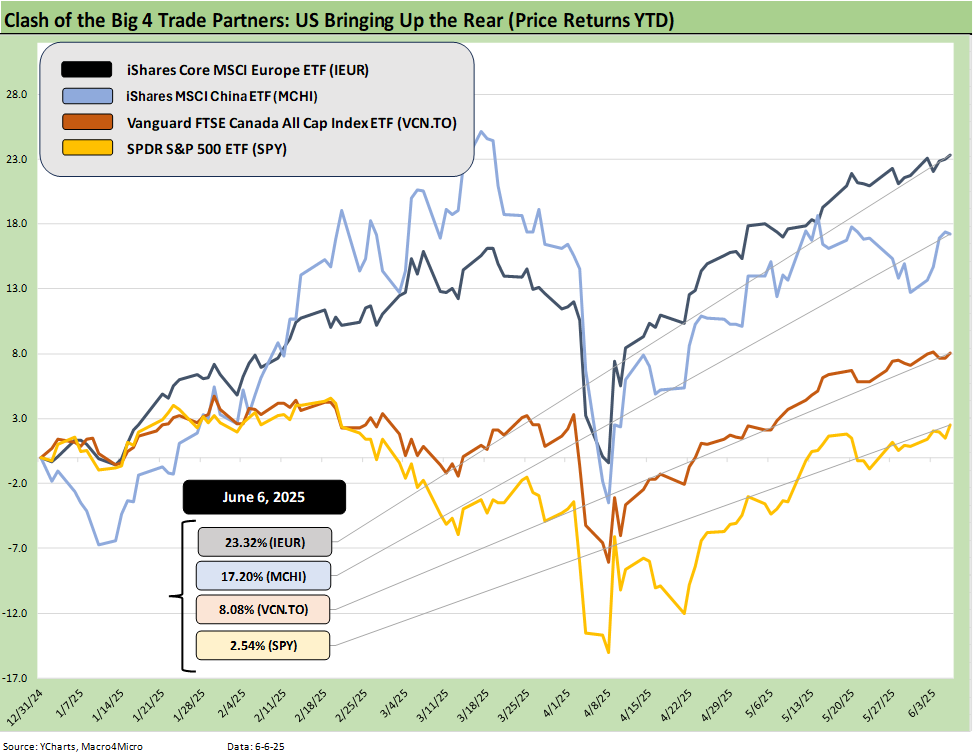
We update the Battle of the Trade Partners above. As a reminder, we use a cross-section of benchmark equity ETFs for the 4 major clashing trade partners – US vs. Europe vs. China vs. Canada. We use what we consider to be useful ETFs that frame those markets across a diversified mix of industries and market caps. We let the US off easily by using the S&P 500 ETF (SPY) since generally small caps and midcaps have lagged YTD. The US had moved back into positive range but remains well behind the pack and notably Europe and China. As Golden Ages go, this one needs some work or some more precious metals on the list. Trump will blame Powell.
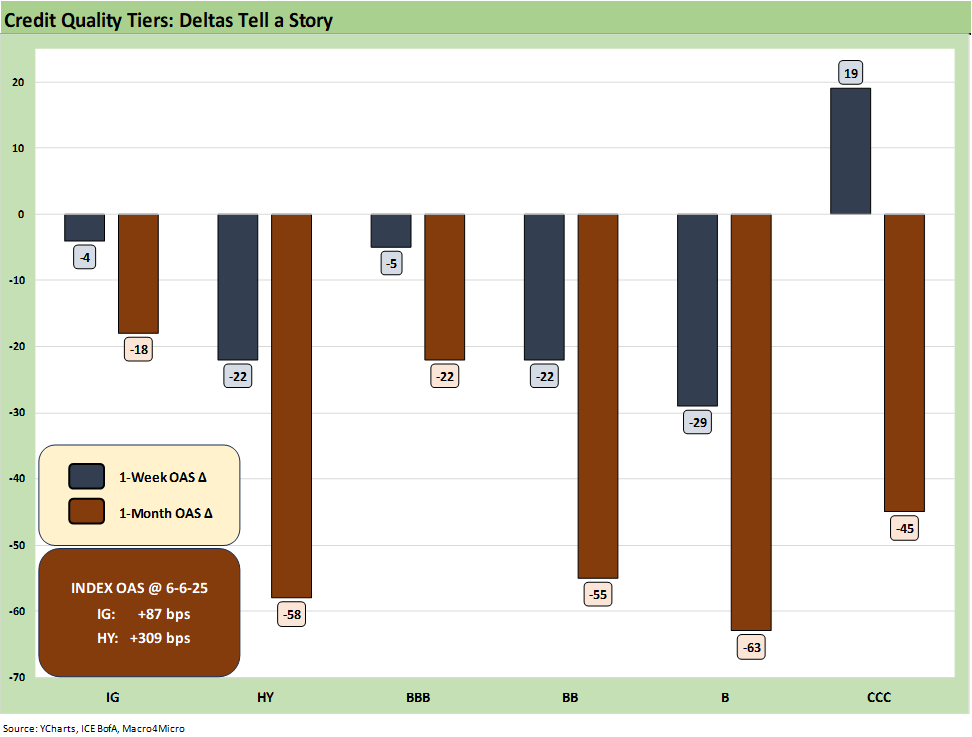
The above chart updates the 1-week and 1-month OAS deltas. The good news followed Trump pulling back from many of his more extreme tariff actions, but he dropped in a doubling of steel and aluminum to 50% to remind trade partners he is not going soft. Unfortunately, that latest move appeared to be part of his economic coercion program against Canada that could elicit a more aggressive response given the domestic pressure on Carney from many sources (see Tariffs: Testing Trade Partner Mettle 6-3-25).
If you believe that credit markets set the tone around when “serious trouble” will arrive, then the +87 bps IG index OAS and the +309 bps OAS for HY index are not flagging major warning signs. That is, unless Trump decides to shock the world again as he did on Liberation Day. Then spreads will follow equities as it gets sorted out. While it would not make sense to go down that path again, Trump was especially annoyed by the whole “TACO thing.” A trade war with China and the EU is not off the table. The EU is the #1 trade partner and China is the most diverse supplier across so many product groups from high to low value-added.
The main event near term that could roil markets would be a collapse of the Big Beautiful Bill process in the Senate or in getting any Senate revisions past the House. That still is a small risk compared to the reciprocal tariff excess that the world was slammed with in early April (see Tariffs: Diminished Capacity…for Trade Volume that is…4-3-25, Reciprocal Tariff Math: Hocus Pocus 4-3-25,Reciprocal Tariffs: Weird Science Blows up the Lab 4-2-25). There is a lot going on in this massive bill beyond the deficit aspects. There is both a macro threat and political governance/legal system threat. That is for another day. There is certainly a major household finance risk aspect given some of the healthcare policy changes that would flow into consumer credit quality and PCE growth.
The main macro drivers so far are that CPI and PCE prices have remained under control even if not at target for PCE inflation of 2.0%. Payrolls (including JOLTS data) were constructive and earnings season was by and large solid at the median. Guidance offered relief overall even if the retailers and some of the more intrepid industrials admit price increases are coming (Trump social media wrath lurked in the background).
We get a fresh CPI print this week and there will be another round of product line scrutiny. The awareness that the buyer pays the tariff (“writes the check” to customs) is becoming more widely embraced by anyone that pays attention to facts. Sellers and seller countries do not pay. US buyers/importers pay despite what the White House insists.
There are a lot of Section 232 tariffs ahead in high volume critical sectors, and Trump has a date with SCOTUS at some point to see if the IEEPA powers he believes he possesses allow him to swing tariffs around as a weapon based on “emergencies” that he alone decides the US is facing. Such action is unprecedented outside of events such as declared wars.
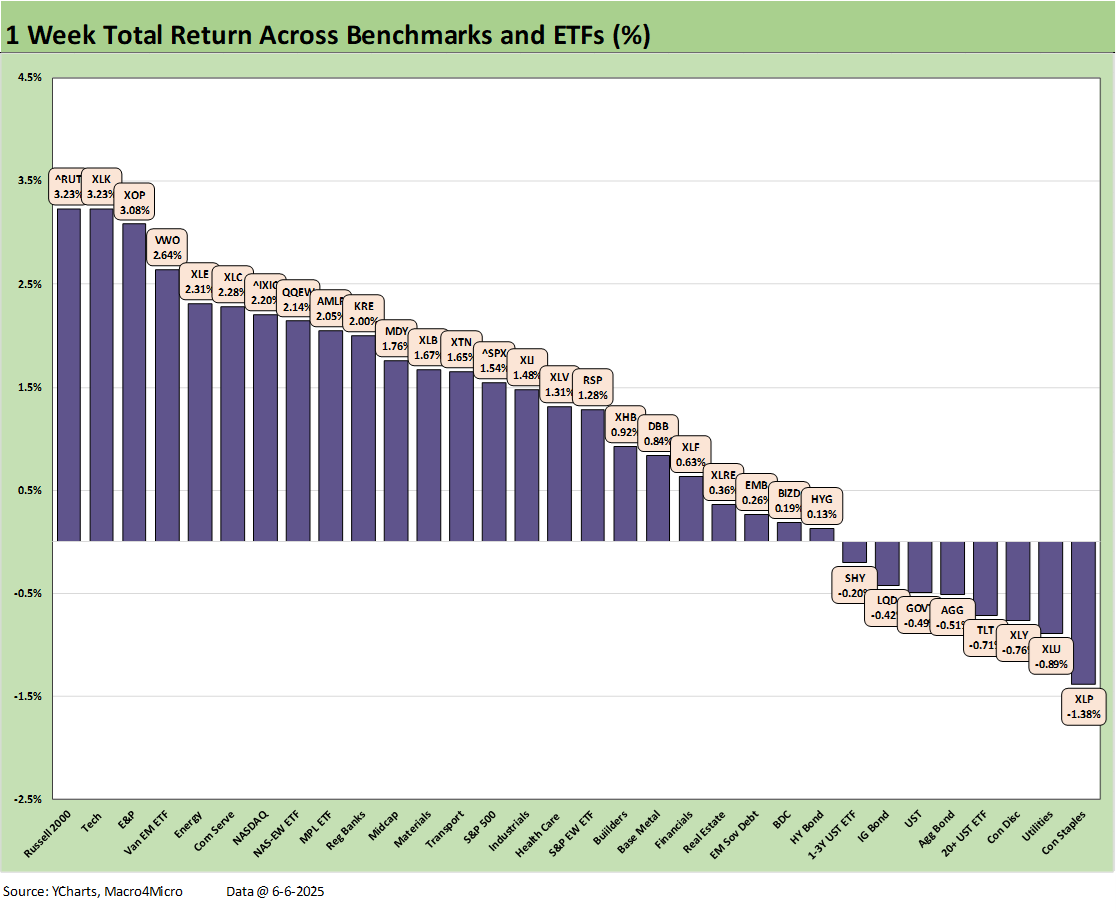
The scoresheet for the 32 asset lines we track was 24-8 with 5 of the 8 in red being bond ETFs. The only bond ETFs of the 7 we track that posted positive numbers on the week included the HY ETF (HYG) and EM Sovereign ETF (EMB). The 3 equity-based ETFs on the bottom of the 1-week return rankings included two defensive ETFs in Consumer Staples (XLP) and Utilities (XLU). Consumer Discretionary (XLY) was negative on the back of the post-Trump-snit Tesla beat-down.
The Russell 2000 small caps ran to #1 on the week after lagging the markets for many periods. The Tech ETF (XLK) came in at #2 while NASDAQ and Communications Services ETF (XLC) made the top quartile. The E&P ETF (XOP) and broad Energy ETF (XLE) defied the bears as oil (WTI) rallied to over $64 per bbl from around $60 to end May. Russian setbacks in Ukraine and the occasional threats around Iran nuclear facilities will always keep oil supply in the speculative picture as a wild card. Rounding out the list in the top quartile was EM equities with its heavy China influence.
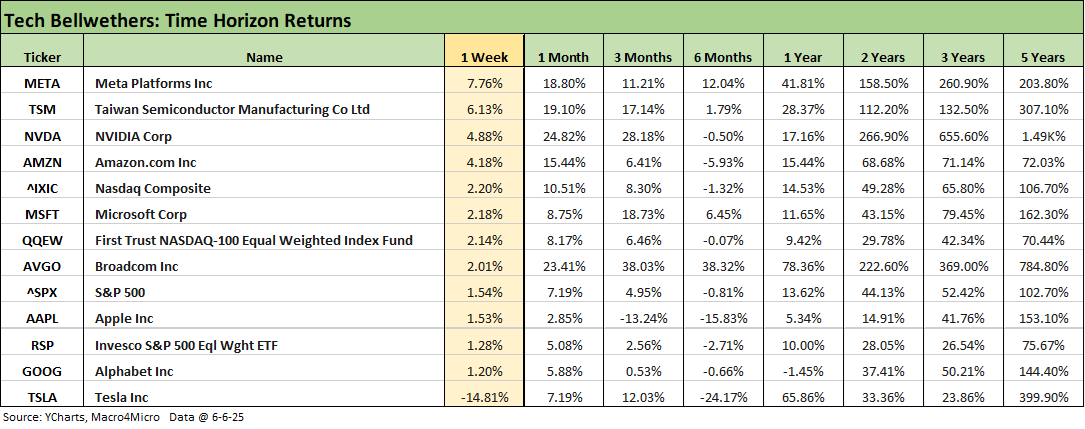
The tech bellwether returns are broken out above in descending order of 1-week returns. We see 3 of the Mag 7 (META, NVDA, AMZN) beat the NASDAQ. Tesla clearly had a rough week after the Trump headlines at -14.8% and was the only line in negative range. The Musk-Trump clash effects might last for more than a week with weekend headlines in the Washington Post that NASA and the Pentagon are searching for SpaceX alternatives.
Musk seems to have tried on some wax wings (should have gone autonomous on the wax wings) and is paying a bitter price for his tantrum. Trump is supposed to rise above it in the interest of the nation and calm it down, but that is not a high odds proposition. It begs escalation and a “war” (Elon ending the launch program would be extreme). Trump reverts to a war footing against “enemies” (except in 1968).
That headline on SpaceX may end up being denied, but such an action would offer a reminder of the increasingly Putinesque conduct of Trump. It is easy to remember how many oligarchs ended up in court in cages (literally) in Russia with their billions seized and distributed to “others.” Such revenge action against Musk would not be a great signal to send to global investors who are supposed to build and invest in the US.
Such retaliatory behavior has been in evidence in trade policy, with law firms, and in higher education as well as against states, cities and individuals. Removing security from government officials was also in the low-rent, petty bucket. It all goes hand in hand with the increasingly infamous Section 899 (aka “revenge tax”) in the Big Beautiful Bill that offers more tax weapons to deploy against trade partner nations. Either way, the GOP Senate and House will roll over.
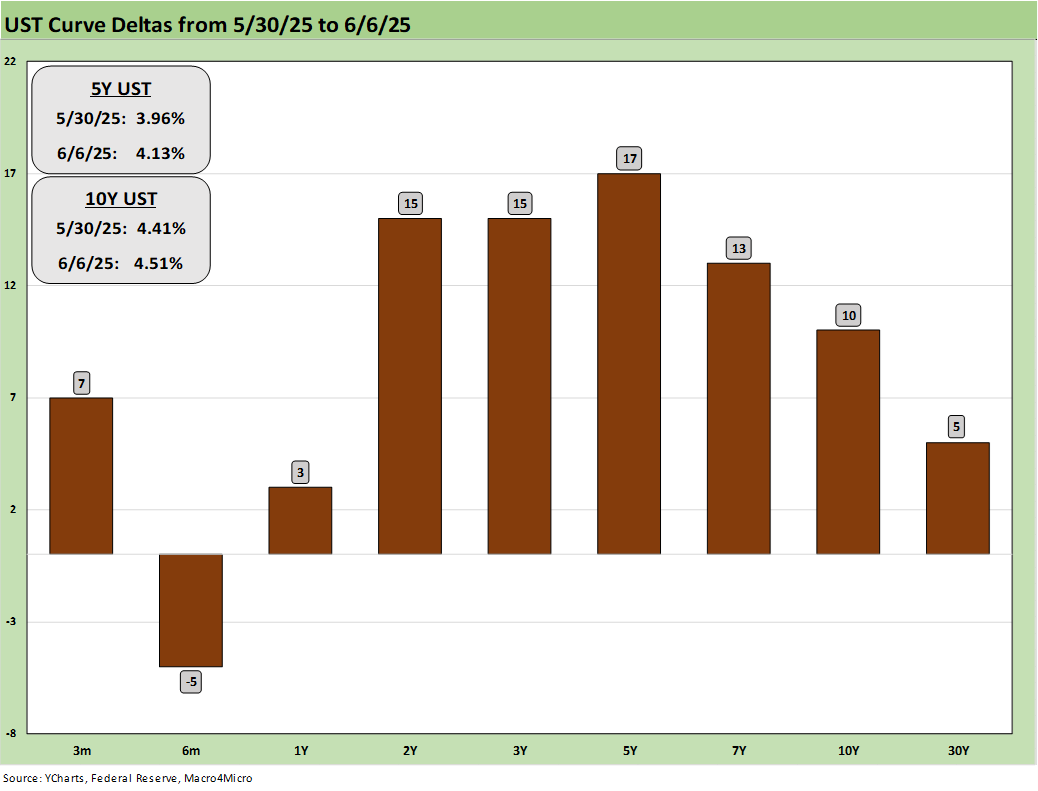
The 1-week UST deltas are updated above and show an upward shift from 2Y to 10Y with the 5Y UST moving the most. The ebb and flow of headlines around US sovereign debt metrics and sustained massive budget deficits will be a fact of life. The request by Trump to eliminate the debt ceiling is not the greatest systemic risk marketing pitch for those worried about UST debt levels creeping up on some BBB tier sovereign issuers (Italy) and we noticed some articles citing US CDS in the zone of where Greece trades.
The Senate debates will not bring a lot of favorable talking points that would help the US sovereign risk story. The waves of headlines picked up pace in early April around the dollar vs. UST yields and the risks of more de-dollarization and UST derisking globally. Those risk variables will ebb and flow as we get a cleaner read on inflation and more tariffs find their way into working capital decisions and “cost sharing” realities from the seller to the buyers to extended supply chains to the end customer.
Fear of erosion of bond value tied to a UST curve steepening and currency risks alike do not need the recently heightened headlines. A blank check to give record tax breaks and risking inflation with higher and broader tariffs is not the way they wrote up the playbook in Macroeconomics class for systemic debt management (or Microeconomics class either). Since that is usually second-year level, you probably already flunked Econ 101 as a prerequisite and changed majors to finger painting.
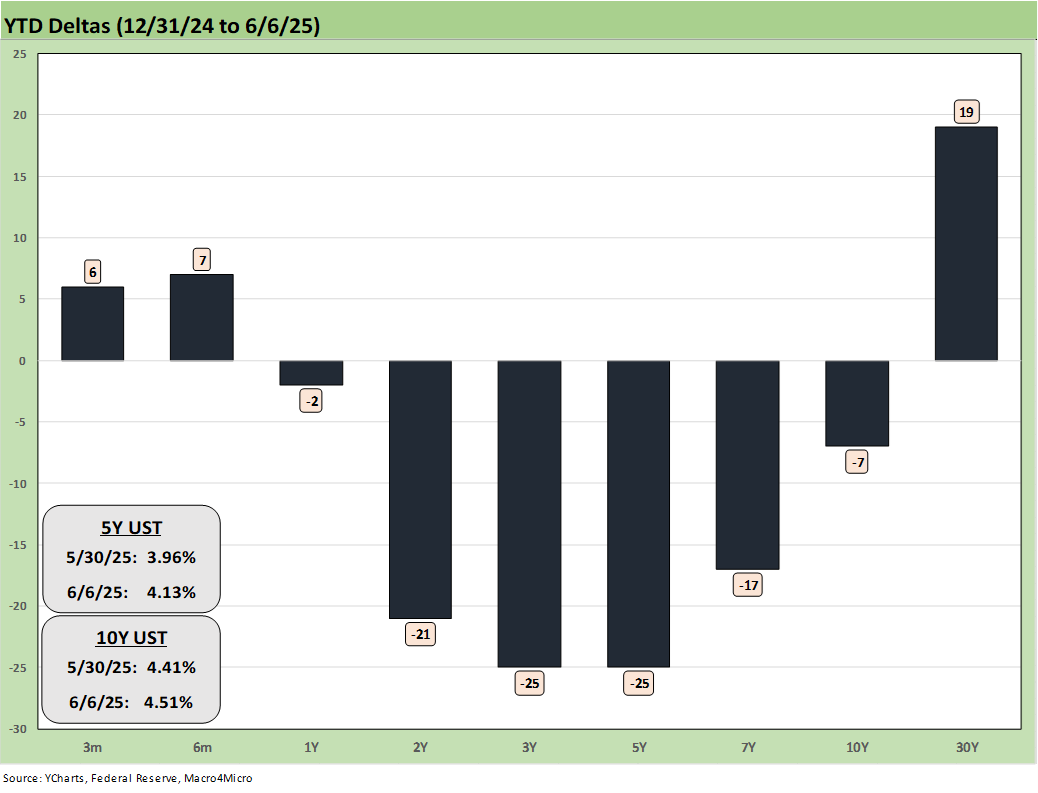
The YTD UST deltas are still showing a variation of a bull steepener with the 2Y to 7Y as the main decliners.
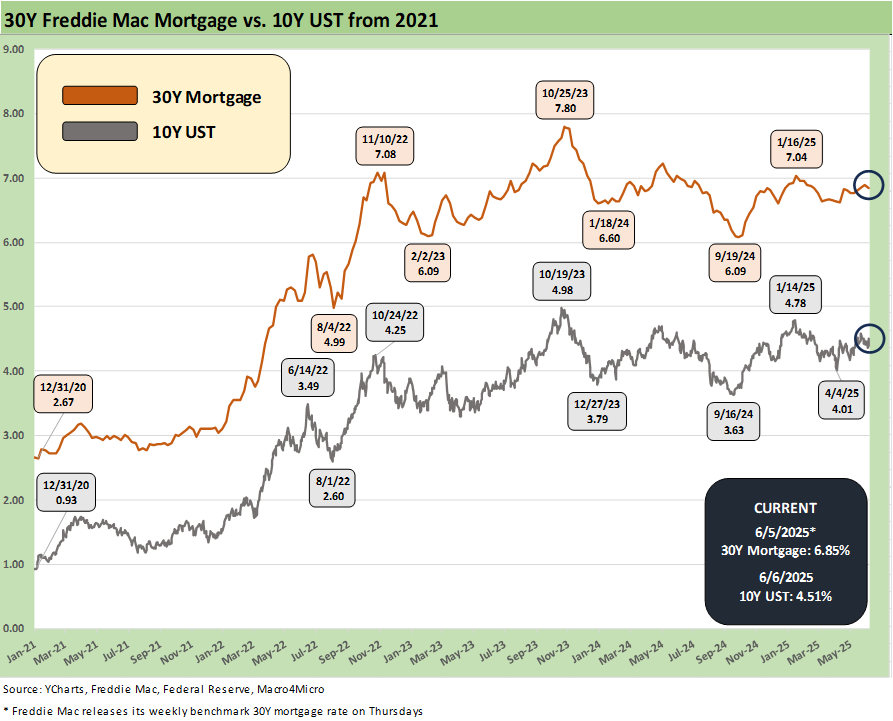
The above chart updates the running time series for the Freddie Mac 30Y mortgage vs. the 10Y UST. The Mortgage News Daily 30Y survey closed Friday at 6.97%.
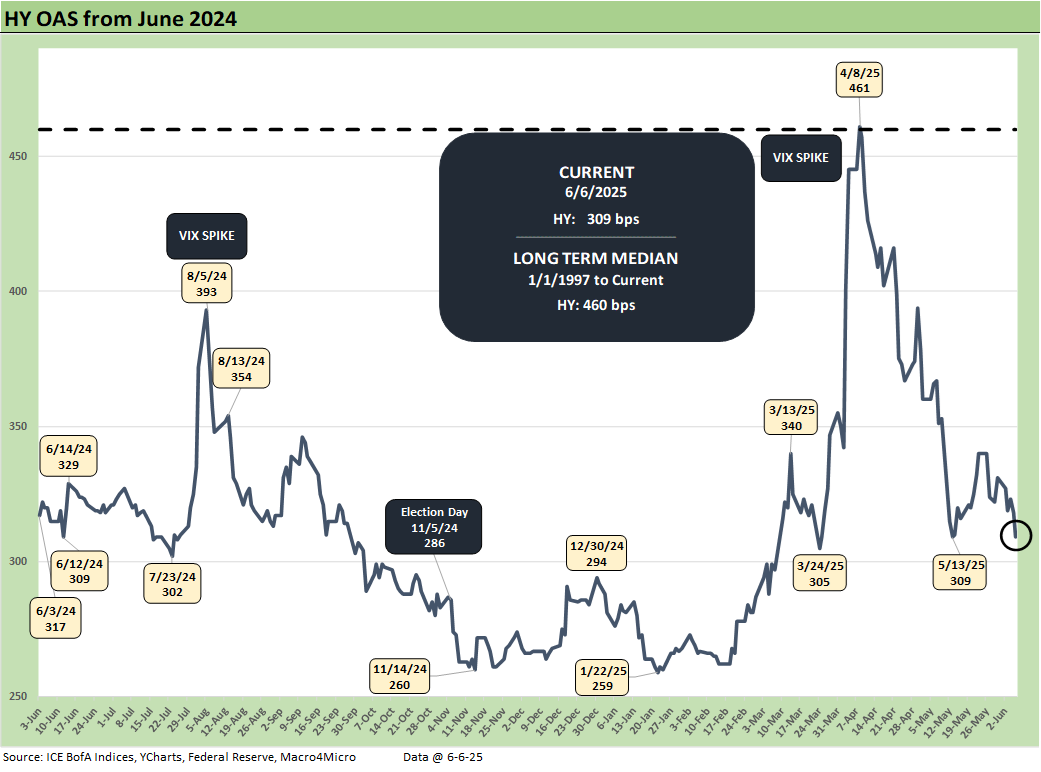
The above chart updated the wild ride in recent HY OAS as the past week saw another -22 bps tightening on the week to +309 bps. That is below the Oct 2018 lows and June 2014 lows and dramatically inside the April 8 highs of +461 bps.
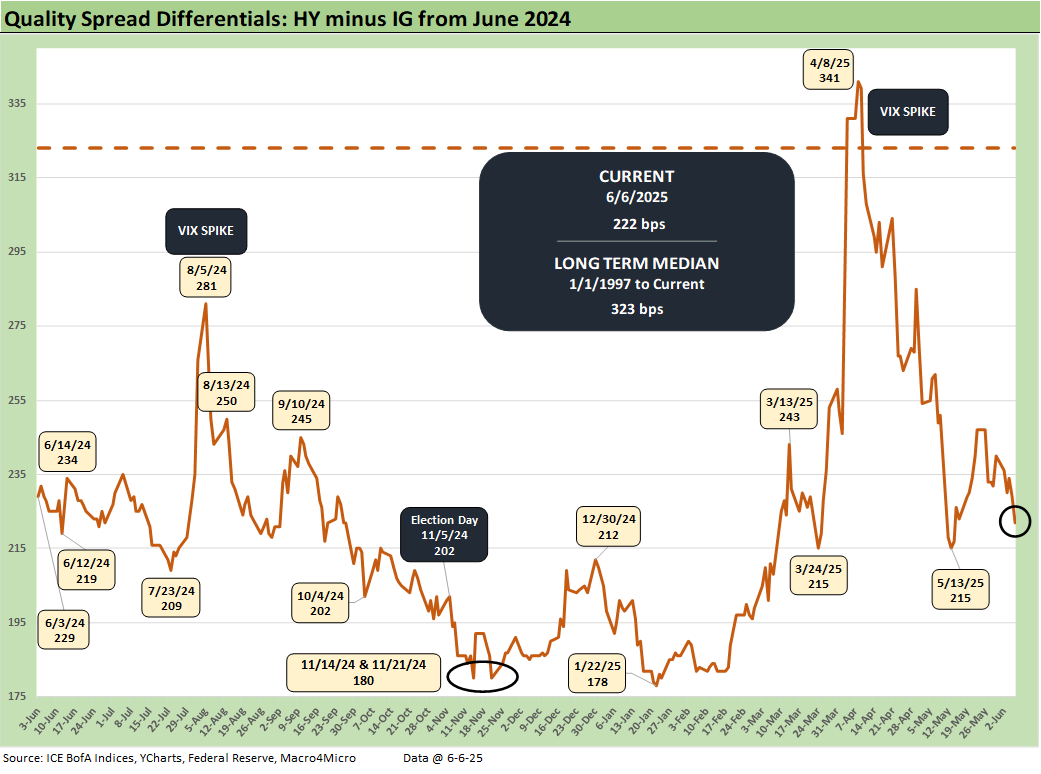
The above chart shows another round of quality spread differential compression between HY and IG with the OAS differential at +222 bps vs. +240 bps last week.
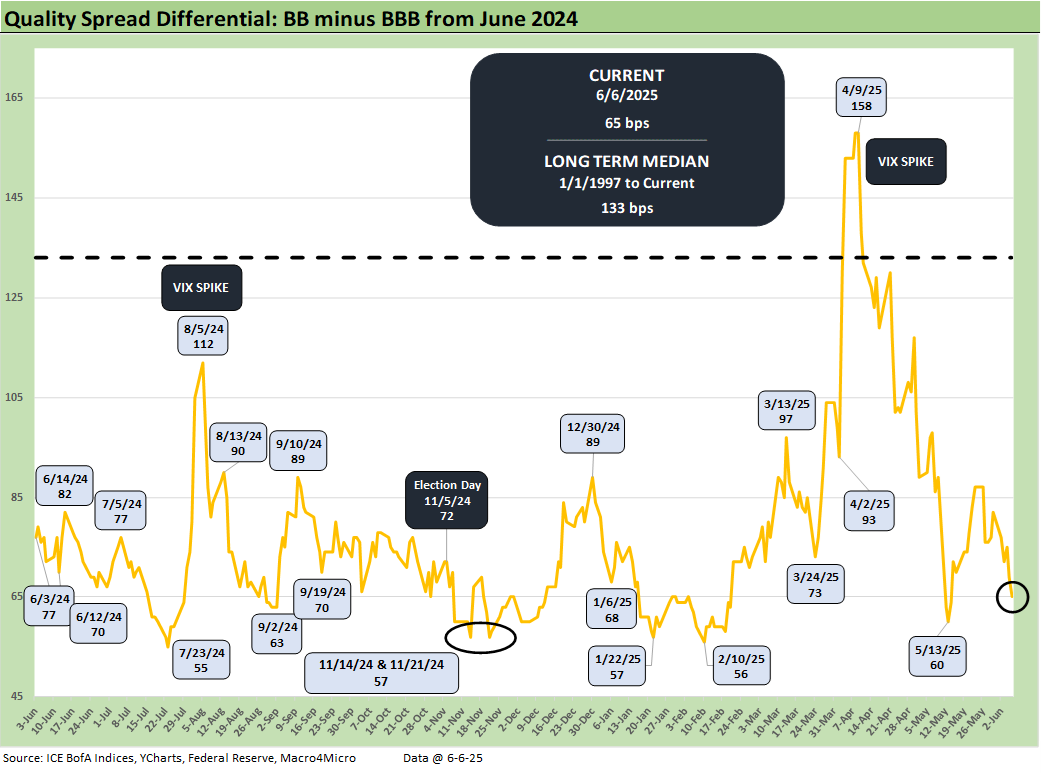
The “BB OAS minus BBB OAS” quality spread differential tightened to +65 bps this week from +82 bps last week. The -22 bps on the BB tier was the main driver vs. -5 bps on the BBB tier.
See also:
Payrolls May 2025: Into the Weeds 6-6-25
Employment May 2025: We’re Not There Yet 6-6-25
US Trade in Goods April 2025: Imports Be Damned 6-5-25
Past-Prologue Perspective for 2025: Memory Lane 2018 6-5-25
JOLTS April 2025: Slow Burn or Steady State? 6-3-25
Tariffs: Testing Trade Partner Mettle 6-3-25
Footnotes & Flashbacks: Credit Markets 6-2-25
Footnotes & Flashbacks: State of Yields 6-1-25
Footnotes & Flashbacks: Asset Returns 6-1-25
Mini Market Lookback: Out of Tacos, Tariff Man Returns 5-31-25
PCE April 2025: Personal Income and Outlays 5-30-25
Credit Snapshot: Meritage Homes (MTH) 5-30-24
1Q25 GDP 2nd Estimate: Tariff and Courthouse Waiting Game 5-29-25
Homebuilder Rankings: Volumes, Market Caps, ASPs 5-28-25
Durable Goods Apr25: Hitting an Air Pocket 5-27-25
Mini Market Lookback: Tariff Excess N+1 5-24-25
New Home Sales April 2025: Waiting Game Does Not Help 5-23-25
Existing Home Sales April 2025: Soft but Steady 5-22-25
Credit Snapshot: Lithia Motors (LAD) 5-20-25
Home Starts April 2025: Metrics Show Wear and Tear 5-19-25
Industrial Production April 2025: CapUte Mixed but Time Will Tell 5-15-25