
Mini Market Lookback: Eye of the Beholder
A banner week for equities saw positive duration effects with mixed PCE data, weak housing, and soft final 1Q25 GDP numbers.


I am feeling Big and Beautiful and await my pageant crown.
The record highs on the S&P 500 and NASDAQ saw 9 of 11 S&P 500 sectors positive even as trade storms are gathering for a final home stretch with bad headlines on US-Canada trade to wrap the week. This past week “obliterated” the fantasy world that selling countries pay the tariff with a $1billion tariff cost headline from Nike, who promised phased-in “surgical price increases” in the US. Surgery is known to cause bleeding (producer, consumer, or both?).
The “consumer watch” had a rough week with sharp revisions down for PCE in the final estimate for 1Q25 GDP, and that news had company with negative PCE release numbers for both personal income and consumption in May. Even if noisy at the headline level, 1Q25 GDP and monthly releases show the economy slowing and notably at the consumer level (see PCE May 2025: Personal Income and Outlays 6-27-25, 1Q25 GDP: Final Estimate, Consumer Fade 6-26-25).
The stakes on how tariffs get finalized and flow into demand and jobs could raise the specter of stagflation unless the second and third worst outcomes (economic contraction, weak corporate profitability) take more of the pain and not inflation. The company-level strategic reactions to tariffs influence those outcomes.
The Big Beautiful Bill has been a food fight around Medicaid, debt ceiling and budget deficit horrors, and what it means for election risk in 2026. Rural hospitals, health care for seniors and sick children, and the tax bracket winners make for a perilous vote calculus even before the UST supply dynamics. Bad politics and bad economics in the interest of Trumpian obedience keeps pressure high on the center right.
Overall, the rosy short term equity market view is supported by the lack of any new immediate crisis underway such as the April reciprocal tariff shock. The main tailwind for now is an “absence of disaster” (current or imminent) in the credit markets. The credit backdrop is unlike the lagging record stock market highs of Oct 2007 and across late 1999 in equities. Tariffs will play out by the fall with higher prices or lower earnings, economic reverberations, and repriced valuation multiples.
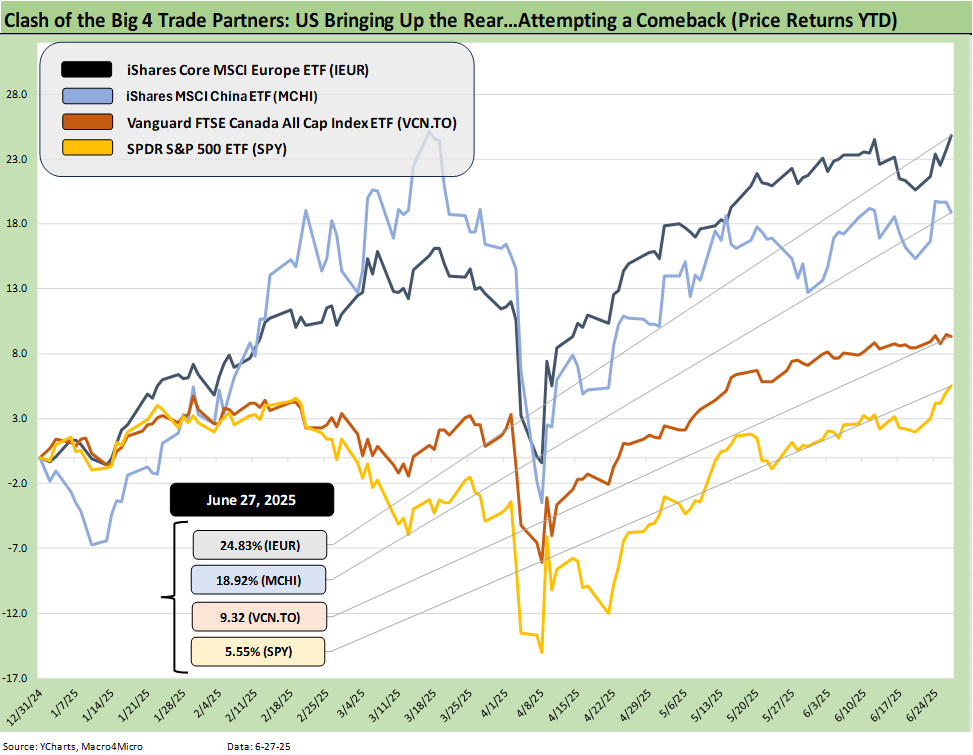
The above chart updates our weekly clash of the big 4 trade partners. The US turned in a great week but it still mired in last place YTD.
The above chart updates our weekly clash of the big 4 trade partners. The US turned in a great week but it still mired in last place YTD.
Nike as a microcosm of the tariff challenge…
The wild rally in Nike (NKE) equity this week came despite the company quantifying a $1 billion tariff cost in its 4Q25 earnings call (May fiscal year). NKE has been a consumer bellwether and problem child in equities for a while, materially underperforming the S&P 500 and Consumer Discretionary ETF (XLY) for 1-year and 3-years.
Our main point for raising Nike here is for what their news signals about the coming tariff demands and how the most exposed companies will need to respond. In this case, the Nike game plan is broad but includes price increases and actions around mix and costs. Tariffs that seek to erase the value of the labor arb bring trouble for prices, earnings, and cost mitigation actions that often mean cuts to outlays (someone else’s revenue, or rental income) and labor (headcount and wages).
We do not follow Nike (but I do remember my first pair of Cortez in the early 1970s) but it is a household name that all economic tiers pay attention to. With this latest set of announcements, Nike offers something to extrapolate from in considering what lies ahead when the final trade deals get wrapped.
A few quick takeaways:
Buyer pays/Buyer writes the check: Nike is just the latest in so many announcements reaffirming that tariffs are a major cost to the buyer that they need to plan for. The tariffs are not collected from the seller in sharp contrast to what Trump once again stated in detail this week about how he “collected” hundreds of billions in tariffs from selling countries. The collection is from the buyer/importer. The Nike brand name gives more people something to focus on. Nike quantified the $1 bn tariff costs and discussed qualitatively the measures it needed to take. The real world impact allows for a lot of extrapolation for less visible companies and small and medium sized companies. The walls will be closing in on the lies from pro tariff advocates and Trump on “seller pays” as more companies gear up for rolling tariffs. This is why the FOMC is worried and raised PCE inflation forecasts.
How to change the major supplier nations: The Nike call focused on China exposure, but that is because China is every tariff advocate’s boogeyman. With massive reciprocal tariffs aimed at Vietnam (by far Nike’s biggest supplier) and Indonesia there is still plenty more for Nike to talk about as the year goes on. Vietnam has been a major trade partner focus for Trump as one of the largest trade deficits and they were slammed by the initial reciprocal news (see Reciprocal Tariff Math: Hocus Pocus 4-3-25, Reciprocal Tariffs: Weird Science Blows up the Lab 4-2-25). Team Trump’s suspicions of Vietnam as a China “weigh station” with captive China-owned operations also made it a target. Indonesia has always been a major supplier of Nike.
Pricing vs. costs: The comments on the Nike supplier and pricing plan was summed up as follows: “…partnering with our suppliers and our retail partners to mitigate this structural cost increase in order to minimize the overall impact to the consumer. These partner arrangements will come into effect at different times throughout fiscal '26…we have implemented a surgical price increase in the United States with phased implementation beginning in fall '25.” That color from Nike offers a reminder that the economic risk sharing is complicated from seller to end customer. That said, anyone who says they “collected tariffs from sellers” is not being honest (or is ignorant of the facts).
Apparel in the crosshairs: Trump’s reciprocals targeted numerous low-cost producers across Asia broadly, and this will be a major threat ahead to apparel (see Tariffs: Some Asian Bystanders Hit in the Crossfire 4-8-25). There is always a lot more to the challenge in areas such as footwear and apparel. The Nike stock rally was based on a sweeping range of strategic steps the company addressed on the call.
Trump ended the week by renewing his attack on Canada, so tariffs will get back on the front burner very quickly and especially with the pause period ending (in theory). Team Trump has locked in on Canada since Day 1 and the most recent aggression in steel and aluminum was harsh (see Tariffs: Testing Trade Partner Mettle 6-3-25). We have looked at Canadian issues in detail in past commentaries (see Trade Exposure: US-Canada Import/Export Mix 2024 2-7-25).
In the end, Canada can do a lot of damage to the US even if Canada faces even more damage. There comes a time when a nation needs to draw a line. Canada has a lot of provincial “relationship issues,” but the time might be coming when Canada needs to decide whether it is a unified nation or more like the Balkans (except with much better hockey). Or the 51st state with a Senate total equal to Wyoming.
In theory, the most potent forces to counter the US are the resource rich provinces (Alberta and Saskatchewan). They also tend to be the ones who are most alienated from the “East” and the federal leaders. Meanwhile, Quebec has always marched to its own beat (and language). That is a topic for another day.
Readers of the Globe and Mail and Financial Post would be familiar with the reality that the leading export to Canada from the US is political dysfunction. Canadian citizens will be getting a gut check quickly on real action and a test of their resilience. Trump would like nothing better than to fracture Canada (and the EU) by promoting the same divisive tactics he uses so effectively in the US. Tariffs are the next big test based on Trump’s “MO” for tariff excess to beat down trade partners.
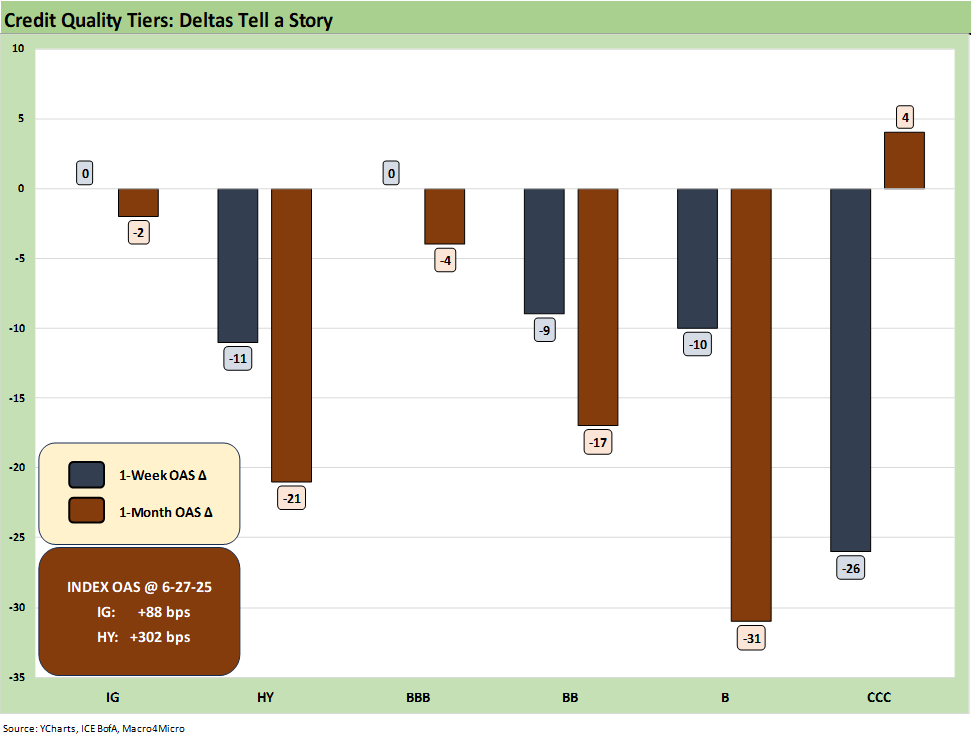
The above chart updates the running 1-week OAS deltas for IG and HY and from the BBB tier down. The IG OAS level is holding in an impressive double-digit range while HY OAS is now well through the cyclical lows of early Oct 2018 and prior lows of June 2014. Memories of what unfolded by Dec 2018 and late 2014 should keep investors on guard with so much room ahead for trade pressures, uncertain stagflation risk, and a softening consumer cycle.
That potential for a trade war with Canada and the EU still lurks while Mexico has been a passive and quiet enigma to this point. Those three (EU, Mexico, Canada) are the top 3 trade partners with China at #4 (disproportionately imports). The macro indicators have been softening and notably on the consumer side.
The June quarter earnings season is nearing the doorstep and sorting through guidance and tariff issues will be critical. As noted above, the Nike example opens up some topics to explore. The auto sector and capital goods subsectors will be very interesting for how the tariff-heavy material costs and components might shake out for cost structures and pricing. Before that, the first earnings wave will be around loan loss provisioning at the banks (major and regional) as well as the bellwether consumer lenders.
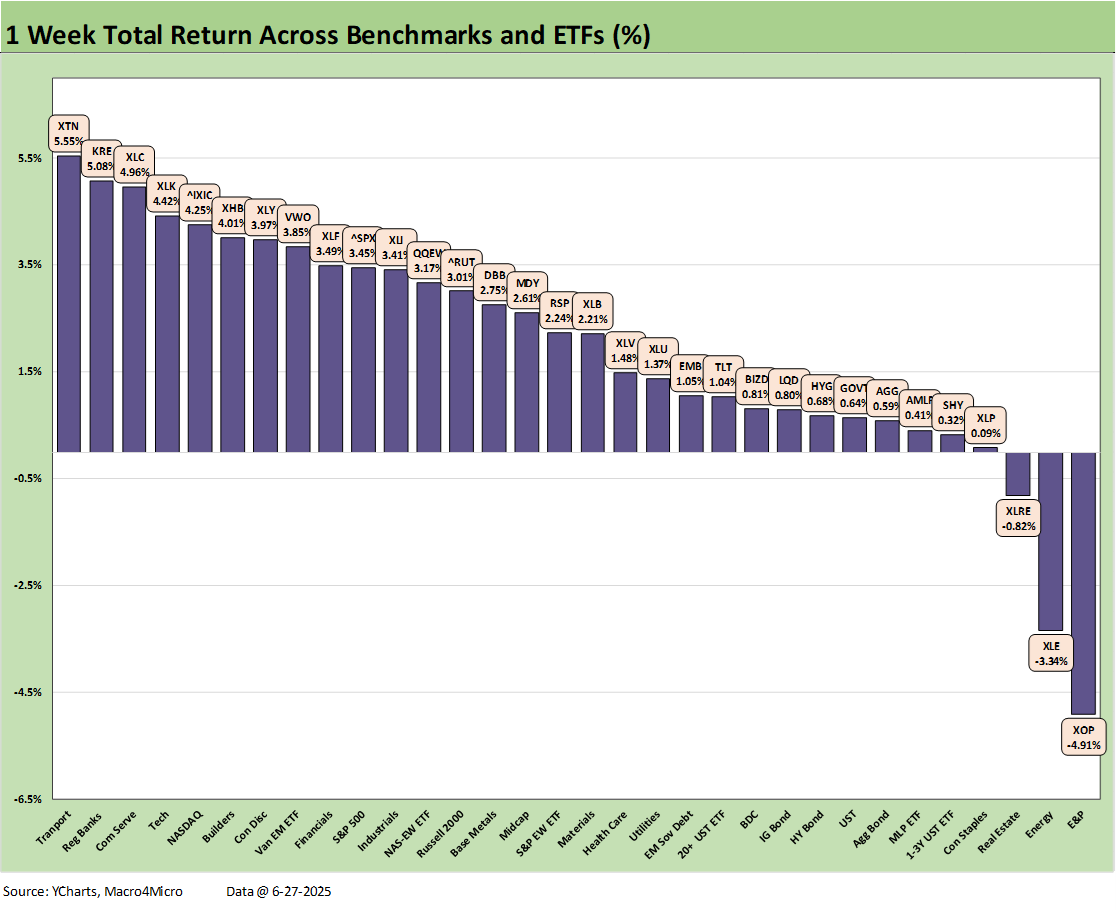
The 1-week return profile on the 32 benchmarks and ETFs shows a very good week at a score of 29-3. The only 3 in the red were E&P (XOP), Energy (XLE), and Real Estate (XLRE). All bond ETFs were positive in a mediocre macro week, but the post-Iran relief rally saw strong performance from tech, financials and transports. Even Homebuilders (XHB) mounted an out-of-favor rally.
The top quartile was led by Transports (XTN) at #1 just ahead of Regional Banks (KRE) at #2 followed by Communications Services (XLC) and Tech (XLK) followed by NASDAQ to round out the top 5. Oil quickly moved away from the Strait of Hormuz worries and stood out as two negative outliers for E&P (XOP) and Energy (XLE). Oil (WTI) still closed Friday $5 above where it was at the end of May.
The news on Friday that Trump broke off talks with Canada will likely roil Transports (XTN) again, but we await Trump’s target list and tariffs for Canadian imports within the week. Trump has many targets, but so does Canada. On reactions, it will be interesting to see if Canada takes a page out of the China playbook by targeting critical supplies. The most natural and damaging targets would be the US farm belt and fertilizer costs and inputs. The US also has a significant trade surplus in dairy (despite all the whining) for tariff targeting.
The likely death of the USMCA in 2026 (or sooner in a termination action) is something the market has not priced in, but the game theory could go awry for the US with Canada as it did with China. Trump’s vocal desire to annex Canada has not sat well with the Canadian public, so his reaction on tariffs could tip the scales in favor of being more assertive in Canadian retaliation. The theory is that retaliation is the only way to get Trump to respond.
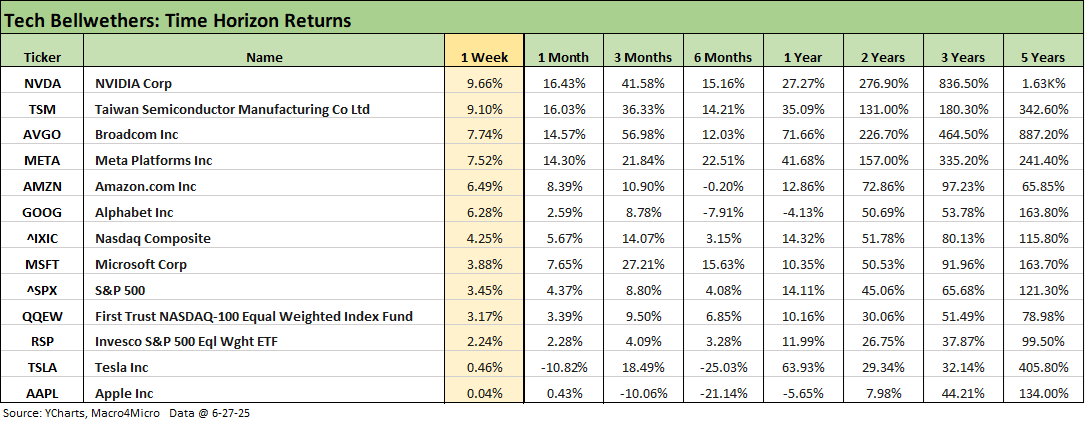
The above chart updates the tech bellwethers with an all-positive week with chips leading the pack. Tesla and Apple are the weakest and most volatile during 2025.
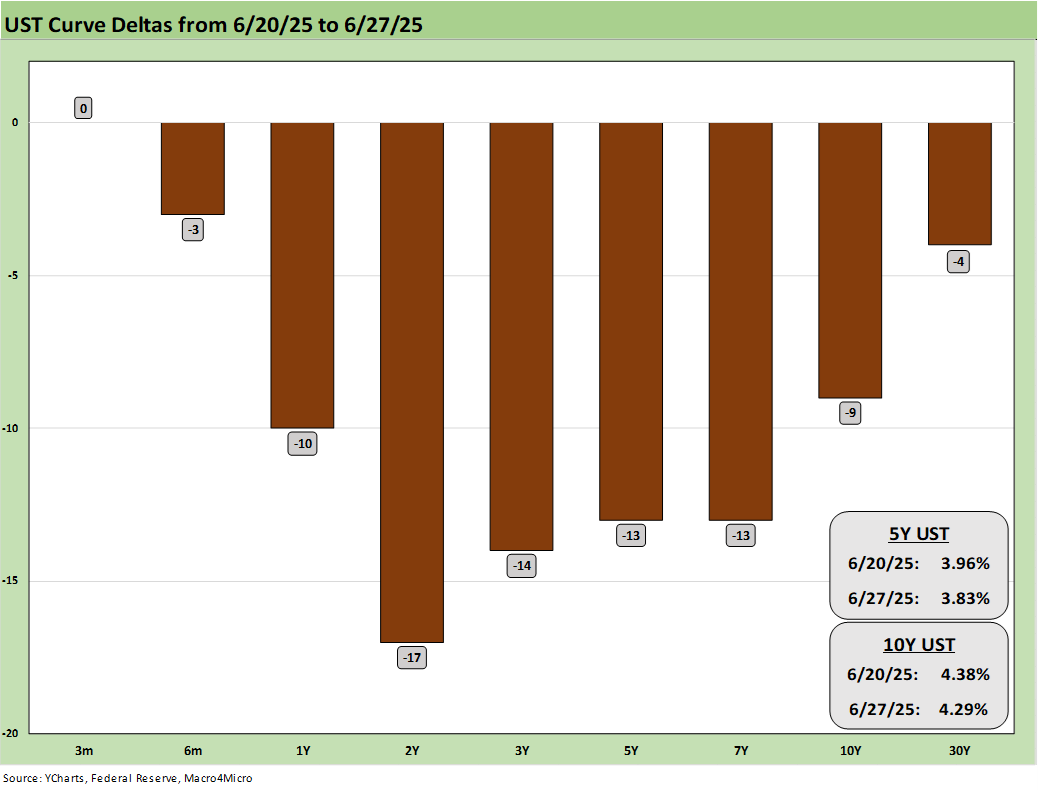
The above chart updates the 1-week UST deltas, and much of the focus has been on removing oil as an inflationary factor after the brief Iran bombing “interlude” as the Iran-Israel clash came to an end. That was after Iran’s air defenses were crushed by Israel ahead of the US bombing raid. Iran went back in retaliation hibernation as that threat awaits another time.
As we covered in the Friday PCE commentary and earlier note on the FOMC meeting, inflation remains a threat as we approach the fall, but the PCE and CPI data this month were not decisive signals (see PCE May 2025: Personal Income and Outlays 6-27-25. FOMC Day: PCE Outlook Negative, GDP Expectations Grim 6-18-25).
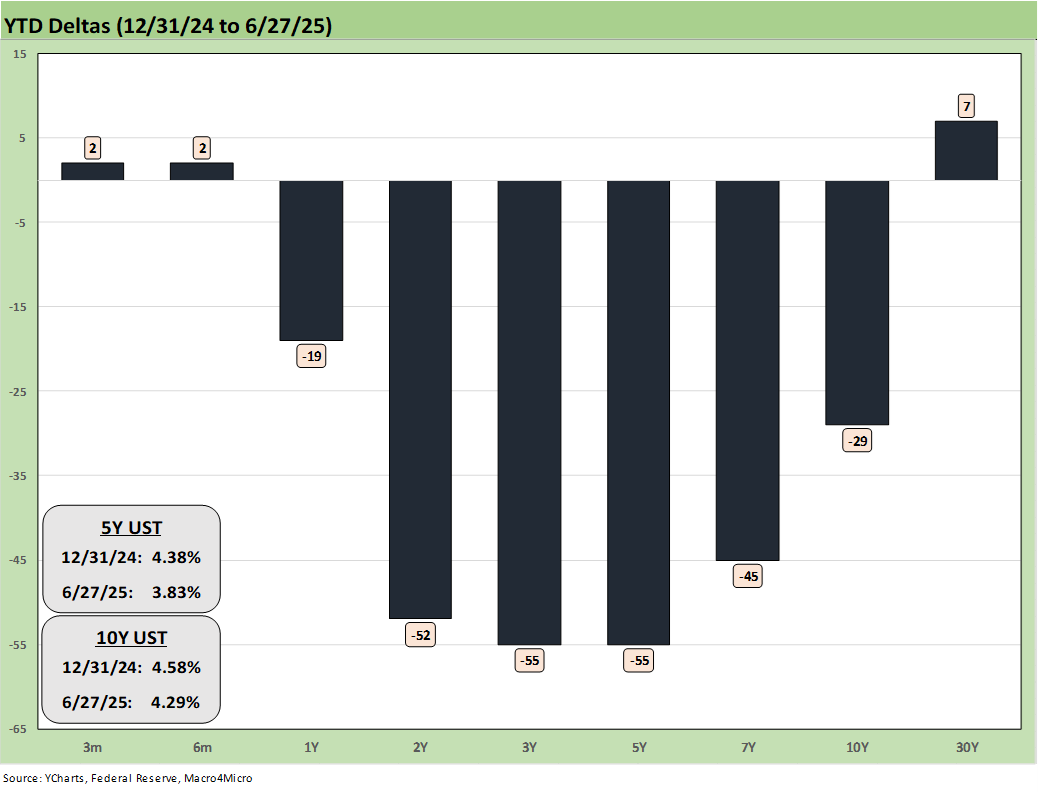
The above chart updates the running YTD UST deltas showing the bull steepener remains the order of the day YTD. The summer will be the deciding swing vote for how the UST curve responds to inflation risk tacked onto a Big Beautiful Bill that is moving closer to reality and the massive increase in longer term UST supply needs. The bill appears to be creeping forward in the Senate as we go to print with political pressure and accounting gimmicks getting pulled out of the red hats.
A slowing economy, higher goods prices, and weaker demand look to be the rolling 3-month forecast ahead. The June quarter earnings season and guidance will be a replay of the “most important quarter ever.” We seem to have that every quarter, but everyone really means it this time. Until next time.
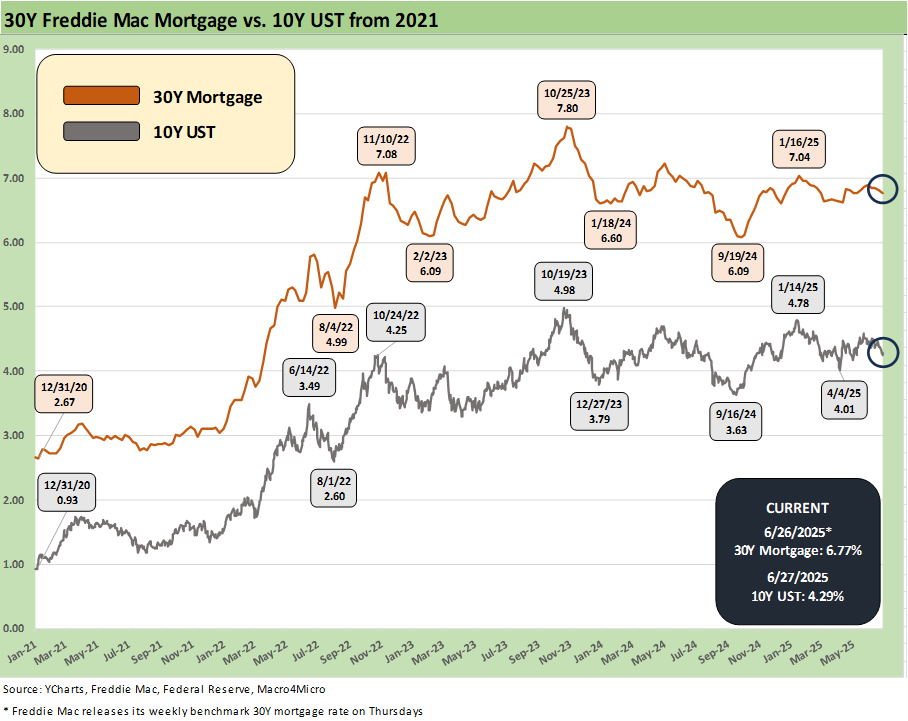
The above chart updates the Freddie Mac 30Y mortgage rate vs. the 10Y UST. Mortgages saw some relief this week and at least moved under the 6.8% handle range where it had been mired for a while. The Mortgage News Daily Survey was at 6.72%.
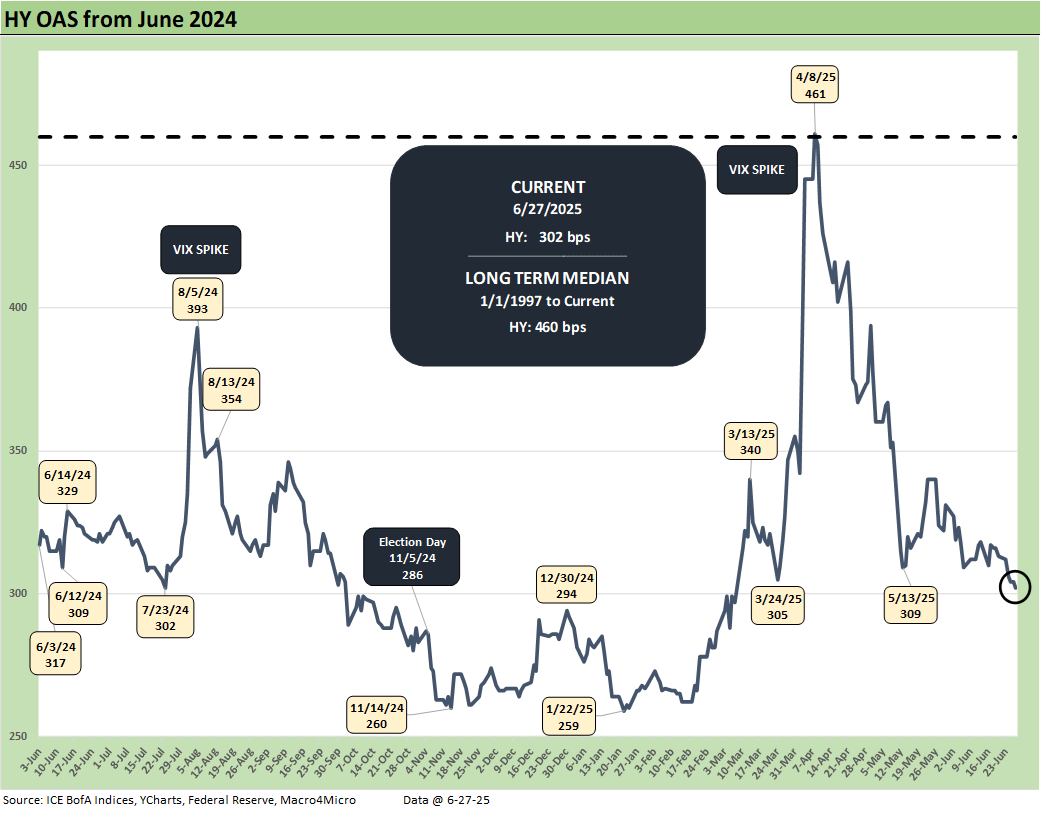
The above chart updates another round of compression in HY OAS by -11 bps on the week to +302. That is back in the neighborhood of the end of June 2007 when that month saw widening from a record low to start June 2007.
For some flashbacks to other tight HY periods, HY OAS hit lows of +244 bps in Oct 1997 (IG had hit +53 bps) and closed that year at +296 bps in Dec 1997. For June 2007, the HY OAS low was +241 bps on June 1, 2007 (and June 5) and then closed June 2007 at +298 bps. The +300 bps handles of Dec 2021, Jan 2020, Oct 2018, and June 2014 offer other reminders of how tight this market remains.
For Jan 2025, we had revisited +259 bps for HY OAS as noted above. Less duration risk in HY than IG and a BB heavy index with gradually rising coupons in new issue is keeping HY bond investors in the game. The credit cycle will soften, but the path to a default cycle in HY bonds (as distinct from private credit) is hard to see.
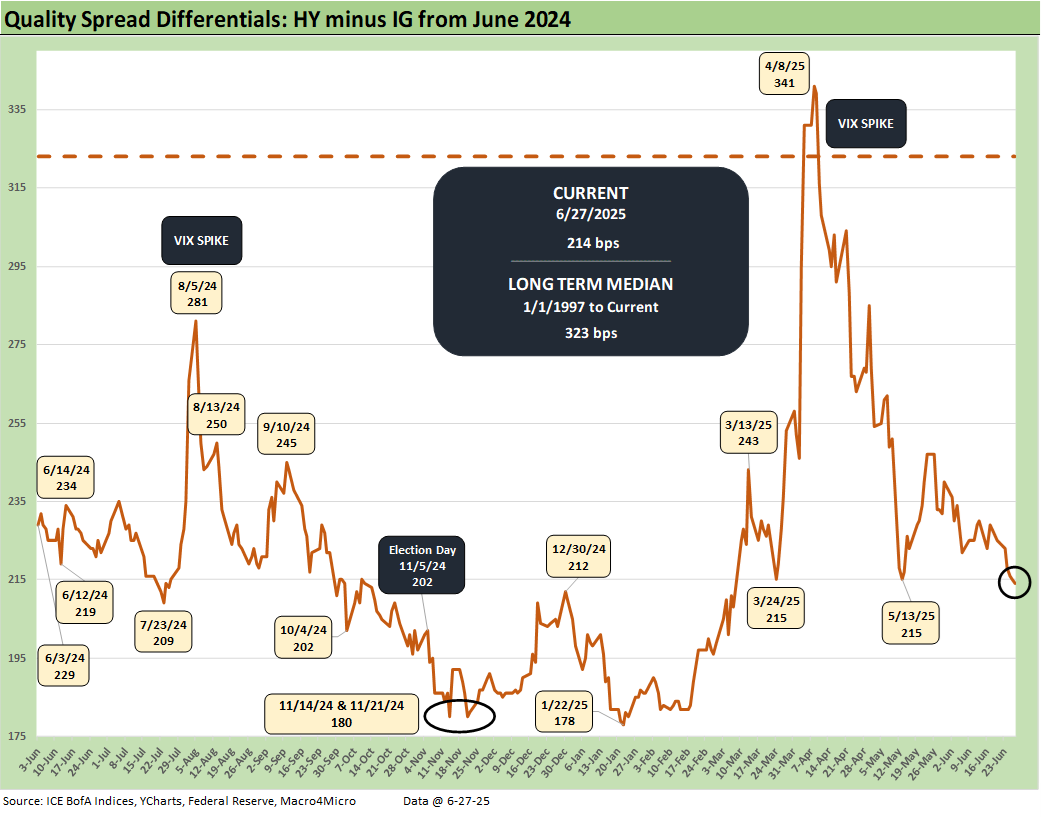
The above chart updates the “HY OAS minus IG OAS” quality spread differential, and the HY compression accounted for all of the -11 bps in quality spread compression with IG not moving for the 1-week delta.
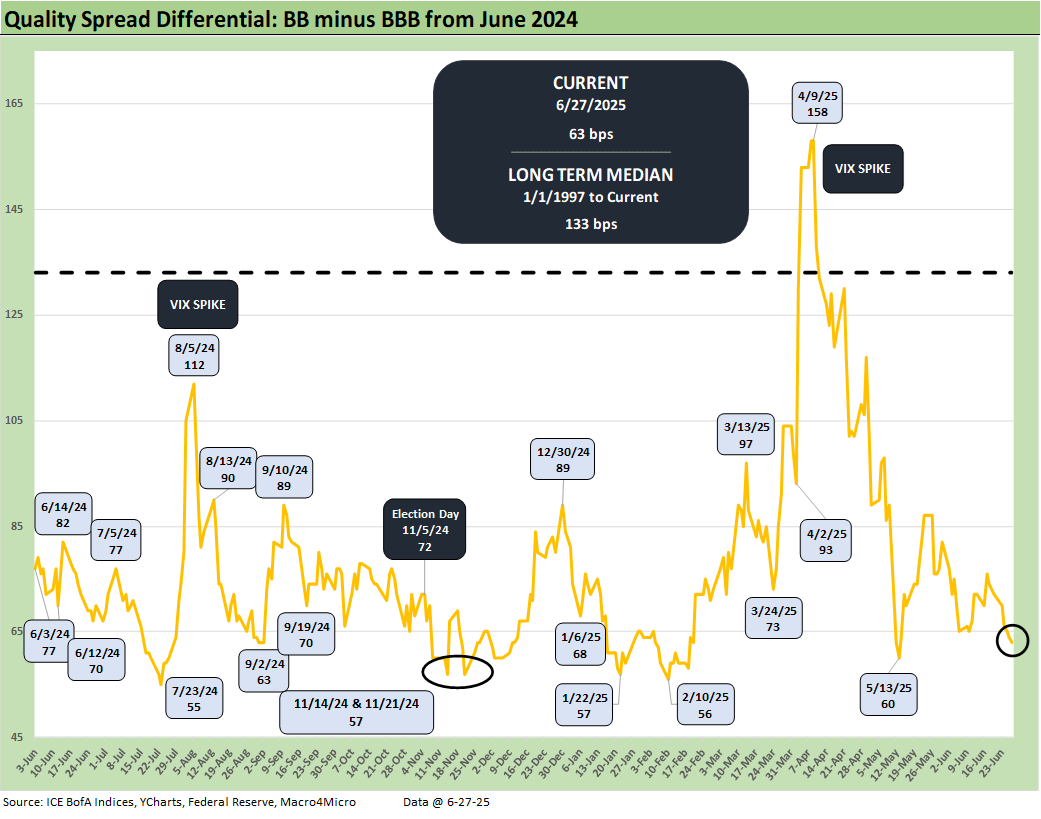
The above chart updates the “BB OAS minus BBB OAS” quality spread differential. We see a -9 bps compression on the -9 bps move tighter in the BB tier and no action in the BBB tier. The +63 bps is within shouting distance of the +55 bps low of July 2024.
See also:
PCE May 2025: Personal Income and Outlays 6-27-25
Durable Goods May25: Aircraft Surge, Core Orders Modest Positive 6-26-25
1Q25 GDP: Final Estimate, Consumer Fade 6-26-25
New Home Sales May 2025: Slip and Slide 6-25-25
KB Home 2Q25: Negative Industry Trends Keep Coming 6-25-25
Existing Homes Sales May 2025: Sequential Stronger, YoY Weaker 6-23-25
Footnotes & Flashbacks: Credit Markets 6-23-2025
Footnotes & Flashbacks: State of Yields 6-22-2025
Footnotes & Flashbacks: Asset Returns 6-22-2025
Mini Market Lookback: FOMC Spoke Clearly, Iran and Trump up next 6-21-25
Lennar 2Q25: Bellwether Blues 6-20-25
FOMC Day: PCE Outlook Negative, GDP Expectations Grim 6-18-25
Home Starts May 2025: The Fade Continues 6-18-25
May 2025 Industrial Production: Motor Vehicle Cushion? 6-17-25
Retail Sales May 25: Demand Sugar Crash 6-17-25
Mini Market Lookback: Deus Vult or Deus Nobis Auxilium 6-14-25
Credit Snapshot: Hertz Global Holdings 6-12-23
CPI May 2025: The Slow Tariff Policy Grind 6-11-25
Mini Market Lookback: Clash of the Titans 6-7-25
Payrolls May 2025: Into the Weeds 6-6-25
Employment May 2025: We’re Not There Yet 6-6-25
US Trade in Goods April 2025: Imports Be Damned 6-5-25
Past-Prologue Perspective for 2025: Memory Lane 2018 6-5-25
JOLTS April 2025: Slow Burn or Steady State? 6-3-25
Tariffs: Testing Trade Partner Mettle 6-3-25