
Footnotes & Flashbacks: State of Yields 6-29-2025
The market got one of those rare weeks of late where bonds were good performers and stocks great performers.


Dive in for your reciprocal tariff prize…
Crosscurrents continue to swirl with this week’s releases showing weaker income and consumption in the May PCE release and another round of material PCE downward revisions in the final 1Q25 GDP numbers (see PCE May 2025: Personal Income and Outlays 6-27-25, 1Q25 GDP: Final Estimate, Consumer Fade 6-26-25).
A fresh tariff fuse was lit to end the week as Trump terminated discussions with Canada with a “threat” while he also stated on the weekend that the reciprocal (and unilateral) tariff “letters” would be going out soon. There is very little that is certain at this point for companies such as Nike with its estimated $1 billion tariff costs that still need the numbers for Vietnam and Indonesia as the company phases in price increases (see Mini Market Lookback: Eye of the Beholder 6-28-25).
This week brings JOLTS Tuesday and payroll numbers on Thursday with the Friday holiday pulling it forward. The drift of news has been negative for the consumer and especially from the housing sector, so payroll looms large with the FOMC under siege given Trump’s desire to muddy the factual impact of his tariff strategy (i.e. higher prices, lower margins) as summer proceeds.
This week, Trump reiterated “seller pays” and tariff collections are from non-US countries, but we should hear more details in tariff issues in the 2Q25 earnings season dead ahead.
The following updates our rolling weekly State of Yields commentary.

The above chart plots some key cyclical transition periods from the Carter inversion of 1978 across the Volcker years, the1980s credit cycle peak in 1989 (note the 9.2% 3M UST), the TMT cycle faltering in 2000 (on the way to a massive Greenspan easing in 2001), and the housing bubble in 2006. During the 2004 to 2007 period, leveraged derivative exposure and structured credit was out of control and counterparty risk was soaring.
The chart then jumps from 2006 to 2023 beyond the crisis period and the ZIRP years and COVID after the Fed went wild to save the capital markets and support the banks. That brought plenty of QE and normalization distortions of the curve shape.
The market saw a massive move lower and bull flattener to end 2023 after the 10Y UST peaked in late 2023 as we review below. Steeper and higher was not the forecast to start 2024 as the market expected flatter and lower. During 2024, the curve moved in an adverse direction with a bear steepener until a UST rally alongside the Sept 2024 easing. That soon brought us a fresh steepening as noted in the above chart with some rallies and sell-offs along the way.
The current market is facing quite a balancing act as we head into a few months of current tariffs finally rolling into the working capital cycles and thus raising inflation risk. At the same time, we see a backlog of Section 232 plans in such areas as Pharma, Semis, Aircraft/Parts, Lumber and Copper teed up. The market will also see the reciprocal pause end in early July and a fresh wave of tariffs to be determined by Team Trump. At some point, fresh retaliation cycles could kick into gear, and then the FOMC will have even more to think about on goods pricing uncertainty.
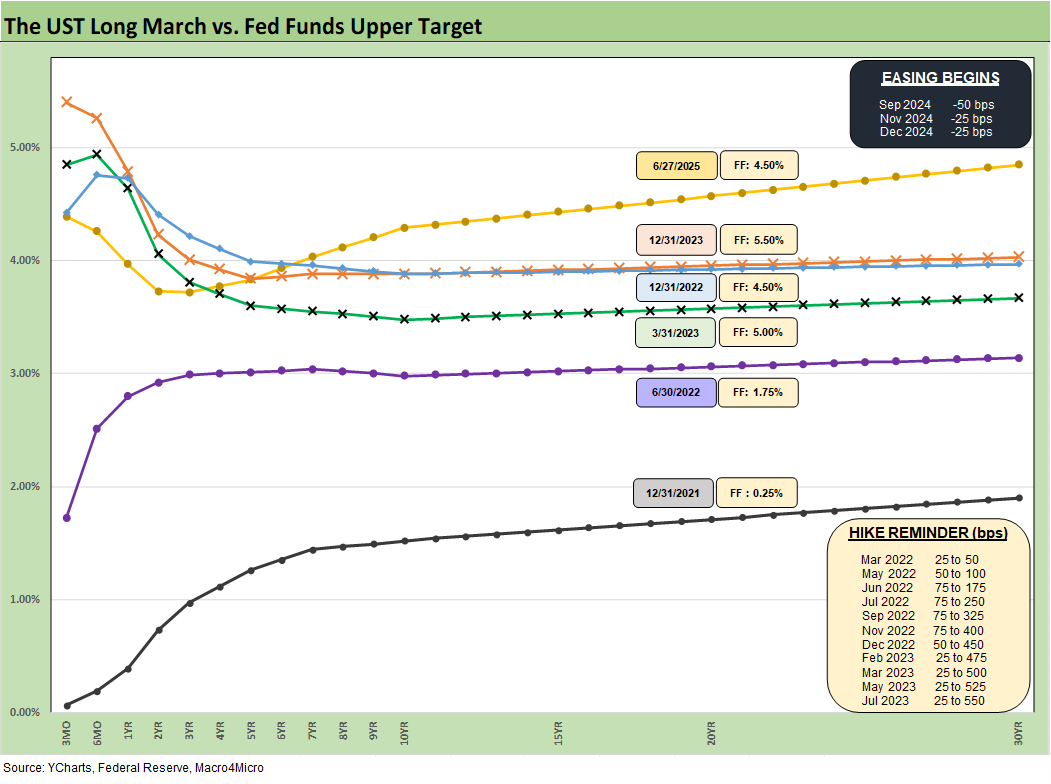
The above replays our weekly chart detailing the migration of the UST curve from 12-31-21 with memory boxes detailing the tightening dates and magnitude and more recently the easing. The UST curve seems to intermittently mix bear steepening patterns and flattening rallies since the Sept 2024 lows, but market fear was creeping into the shapeshifting after Liberation Day before calming down with the pause.
We shifted back into a bear steepening along the way while mixing in some mini rallies. The UST curve will not be helped by record supply and shrinking demand, fears around the dollar, and diminished confidence in US governance. Trade hostility will not help and could even be motive to avoid UST. We are looking at the highest risk of stagflation since the1980-1982 double dip, and tariffs will certainly not help.
The recent FOMC meeting saw another round of no action by the Fed with an increase in the number of votes for no change in 2025 to 7 from 4 in the “Gang of 19” dot plot (see FOMC Day: PCE Outlook Negative, GDP Expectations Grim 6-18-25).

The above chart details the material move from the peak UST curve of 10-19-23 down into the UST bull rally of Nov-Dec 2023 and then eventually into the lows of Sept 2024. The Sept 2024 low tick only came after a bear steepener hit the curve through the summer of 2024. We then moved back into the bear steepener mode until the tariffs roiled the UST markets and initially sent 2Y to 30Y lower on cyclical fears.
The shift higher from Sept 2024 lows and the steepening from the low point at the end of 2023 is in the chart. We see the 10Y and 30Y notably higher than Sept 2024 with a more normal shape from 2Y out to 30Y, which we update near the end of this commentary.
The challenge is still that front end inversion from 3M. The inversion anomaly on the front end during a protracted expansion has been hard to shake with the FOMC holding the line over tariff-related inflation questions. The stubborn 10Y UST has been a headwind for the housing markets (see New Home Sales May 2025: Slip and Slide 6-25-25, Existing Homes Sales May 2025: Sequential Stronger, YoY Weaker 6-23-25, Home Starts May 2025: The Fade Continues 6-18-25, Lennar 2Q25: Bellwether Blues 6-20-25).

The above chart updates the weekly UST deltas and we see a mild bull steepener with the solid move lower on 2Y UST. The PCE release was not supportive of easing, but the signs of economic weakness developing in the consumer sector will be one to watch. The JOLTS and payroll numbers this coming week could bring some good news for easing advocates if the other side of the dual mandate – employment – gives them some ammo. There have been few signs of that so far.
Powell has been very apolitical and measured in his commentary including in his Washington testimony. We are still waiting for Powell to suddenly blurt out: “Trump won’t even admit the buyers write the check for the tariff. In fact, he keeps claiming he collected billions in tariff revenue from selling countries. That is false. He is stupid and low IQ.” That would at least be symmetrical in their relationship.

The above chart updates the YTD UST delta. This is why all the bond ETFs have generated positive returns.

The above chart updates the UST deltas since the 9-16-24 lows that came alongside the easing. That has not worked as many market watchers predicted on the shape of the UST curve and number and pace of easing that was supposed to follow. Trump continues to rail at the Fed and Powell, lately demanding 200 bps of easing, up from 100 bps.
The FOMC would likely be easing if it was not for Trump’s over-the-top and unprecedented tariff game plan. Powell said as much in his testimony. The head of the House Ways and Means Committee (R-MO) has stated on CNBC that “the seller pays the tariff”, so we are talking about a House “think tank” when it comes to economic reality. Meanwhile, Bessent talks around the subject by changing the questions and answering different questions instead.
Easing would appear to need a jobs setback that has not appeared in recent releases. The summer period should answer some questions on the initial price vs. cost impacts of tariffs. The latest wildcard in macro risk was the military clash with Iran, but that faded quickly. Oil prices are usually tagged as transitory across the years, so tariffs will remain the main event for the summer.

The above chart updates the UST deltas from the end of 2023 after a massive rally in rates and risk in Nov-Dec 2023. The follow-on in 2024 expected by the consensus mildly disappointed the UST bulls in the number of FOMC cuts (the market got 4 x 25 but not the number of 5 to 6 FOMC 25 bps cuts expected). The expectation of a pronounced bull flattening during 2024 also did not play out when a bear steepener prevailed by the end of the year. As detailed in the earlier chart, the 2025 period has fared better for bonds on a modest bull steepener.

The above chart updates the running UST deltas from the 10-19-23 peak date of the UST 10Y when it barely missed the 5.0% line. For those looking for a frame of reference on what a bad move in inflation metrics might mean, these deltas at least offer a recent set of data points during an inflation fighting year such as late 2023 and into 2024 (until Sept 2024 began the easing process). That is why we keep revisiting this timeline. It reminds us what reversion could mean.
These rally deltas could reverse in part or in whole with the wrong inflation outcomes. We don’t need to see 2022 again, but the old saying “It happened before, it can happen again” resonates for many.
Losing a rally of -69 bps in the 10Y UST above would hurt the mortgage market and would lead to a material valuation headache in equities, M&A economics, and capital project planning. Mortgages have been a drag on housing (new and existing home sales). The risk of inflation heading the wrong way would do more damage. Stubborn rates or higher rates in the short end to 5Y would damage consumer durables financing and related volumes.
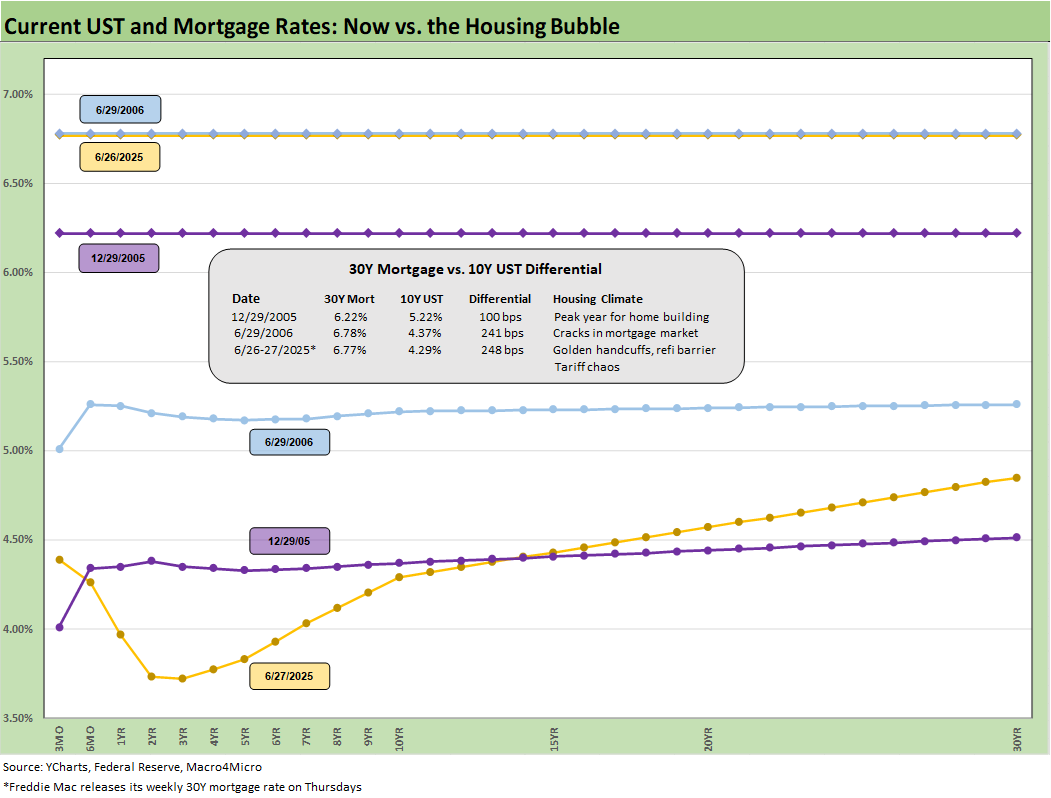
The above chart is one of those replay slides we update each week. This one posts the UST curve for this past Friday and the Freddie Mac 30Y Mortgage benchmark rate (noon Thursday release). We include two useful historical periods including the peak homebuilder year end of 2005 and mid-2006 when RMBS quality concerns were catching headlines as the housing bubble was peaking.
We post UST curves for each period in the chart. The past week saw rates move lower to 6.77% from 6.81% and from 6.84% the prior week. We have seen minor moves recently but that was after a 200 bps range since fall 2023. The Mortgage News Daily survey ended Friday at +6.72%.
We include a column above detailing the differential between the Freddie Mac 30Y and the 10Y UST. That differential moved higher this week to +248 bps. The year 2005 posted a differential of only +100 bps and makes a statement on what the mortgage market was like in 2005. The mortgage market was very hot back then in the housing bubble as mortgage volumes soared during that peak homebuilding year and a very busy period of refinancing was running alongside as a source of funds for homeowners.

We update the 2Y to 30Y UST curve slope above since 1984 with the current upward slope of +112 bps running modestly below the long-term median of +122 bps. We also include the slopes and long-term medians of the other curve segments we watch.
The front end inversion remains an anomaly, and that heightens pressure on the FOMC to ease given that history. That said, the market is also coming off the first inflation spike since the early 1980s. That has in turn promoted caution.
Another anomaly is the phase-in of widespread steep tariffs with many more to come. The economic trade policy in process has never happened in the modern capital markets era. That also feeds the FOMC’s sense of caution to deal with such a threat to goods pricing. The tariff effects will play out over the summer alongside the usual data priorities.
The 2Q25 earnings season could offer more color from companies on the tariff challenge. The commentary from Nike in its 4Q25 quarterly release quantifying the tariff impact at $1 billion to the company got very little attention. Even CNBC seems more worried about getting a high volume of GOP guests and avoids calling out the “seller pays the tariff” falsehood. Final decisions on the reciprocals have been very slow to reach final determinations, but the window appears to be sometime in the next 2 weeks. That promotes even more uncertainty with many more tariffs in the queue.

The above chart shortens up the timeline on the 2Y to 30Y slope to ZIRP in early 2021. We see the steepening to +229 bps in March 2021 and then down to an inversion of -117 bps in March 2023 on the way back up to the current +112 bps.

We wrap this week’s State of Yields with an update of the running UST deltas since March 1, 2022 just ahead of the end of ZIRP (effective 3-17-22). We include the 12-31-20 UST curve and 10-19-23 peak UST curve as frames of reference.
See also:
Mini Market Lookback: Eye of the Beholder 6-28-25
PCE May 2025: Personal Income and Outlays 6-27-25
Durable Goods May25: Aircraft Surge, Core Orders Modest Positive 6-26-25
1Q25 GDP: Final Estimate, Consumer Fade 6-26-25
New Home Sales May 2025: Slip and Slide 6-25-25
KB Home 2Q25: Negative Industry Trends Keep Coming 6-25-25
Existing Homes Sales May 2025: Sequential Stronger, YoY Weaker 6-23-25
Footnotes & Flashbacks: Credit Markets 6-23-2025
Footnotes & Flashbacks: State of Yields 6-22-2025
Mini Market Lookback: FOMC Spoke Clearly, Iran and Trump up next 6-21-25
Lennar 2Q25: Bellwether Blues 6-20-25
FOMC Day: PCE Outlook Negative, GDP Expectations Grim 6-18-25
Home Starts May 2025: The Fade Continues 6-18-25
May 2025 Industrial Production: Motor Vehicle Cushion? 6-17-25
Retail Sales May 25: Demand Sugar Crash 6-17-25
Mini Market Lookback: Deus Vult or Deus Nobis Auxilium 6-14-25
Credit Snapshot: Hertz Global Holdings 6-12-23
CPI May 2025: The Slow Tariff Policy Grind 6-11-25
Mini Market Lookback: Clash of the Titans 6-7-25
Payrolls May 2025: Into the Weeds 6-6-25
Employment May 2025: We’re Not There Yet 6-6-25
US Trade in Goods April 2025: Imports Be Damned 6-5-25
Past-Prologue Perspective for 2025: Memory Lane 2018 6-5-25