
May 2025 Industrial Production: Motor Vehicle Cushion?
Industrial production ticked lower while manufacturing capacity utilization was flat on a rebound in Motor Vehicles/Parts and Aerospace.


Keep those tariff free vehicles coming, but global supply chains remain uncertain.
May Industrial Production and Capacity Utilization (“cap ute”) show a steady but mixed set of trends for now as the market hunkers down for summer tariff actions and better visibility on the “expense vs. price/volume tradeoff” as the end of the pause period approaches and threats of higher auto tariffs and reciprocals loom.
For May, Total Industry Cap Ute ticked slightly lower with Durables slightly higher and Nondurables slightly lower. For major industry groups, Motor Vehicles/Parts and Aerospace showed sequential strength with Section 232 in place for autos and Section 232 “on deck” for commercial aircraft, engines, and parts.
From here the erosion of economic competitiveness for tariffed goods should sustain US-based industrial production in some key sectors (in theory). That is not reshoring and waves of new US capacity near term, but higher utilization helps unit costs in high fixed cost industries. The wildcard for profitability, however, is tied to the supplier chain tariffs and related cost increases from materials (steel, aluminum, strategic metals) to parts (components, tires etc.) to tech (semis, systems).
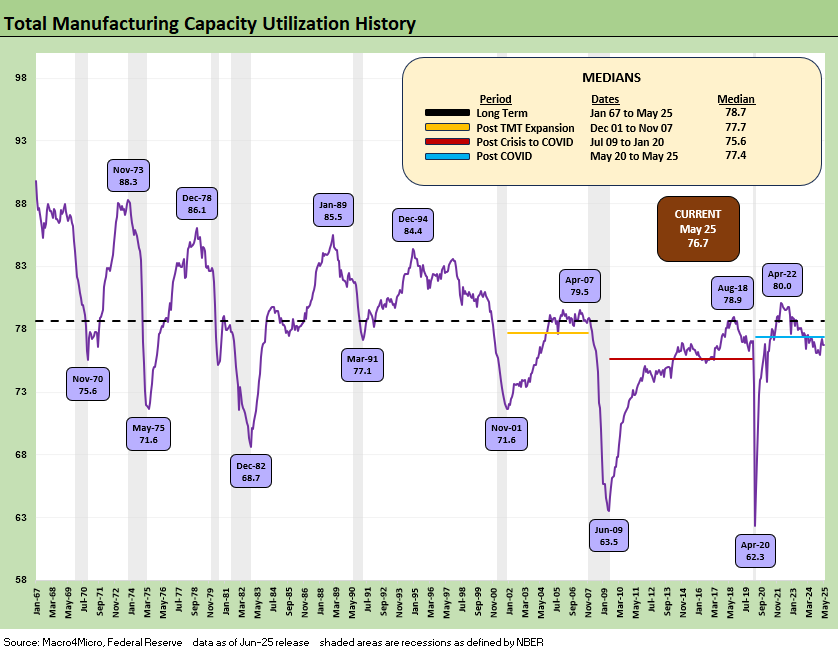
The above chart updates the time series for total manufacturing capacity utilization. We see total manufacturing flat sequentially at 76.7%, which is still below the long-term average of 78.2%. The 76.7% rate is in line with 2H24 numbers and is flat to 3Q24 and 1Q25 but above 4Q24’s 76.2%. The peak utilization was seen in April 2022 at 80.0% ahead of the tightening cycle impacts.
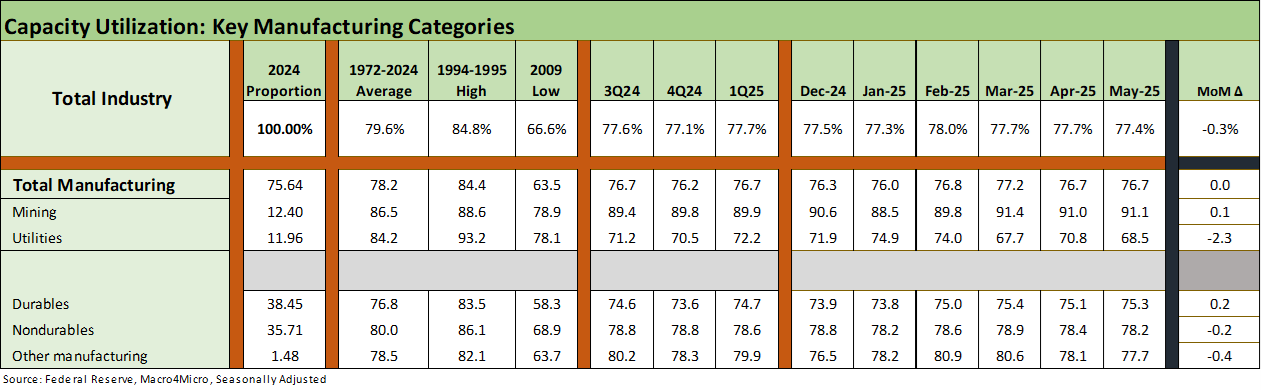
The above chart updates the high-level categories for capacity utilization. We include a delta column on the right side. The news is mixed but weighted toward declining capacity utilization. The critical Manufacturing category was flat overall.
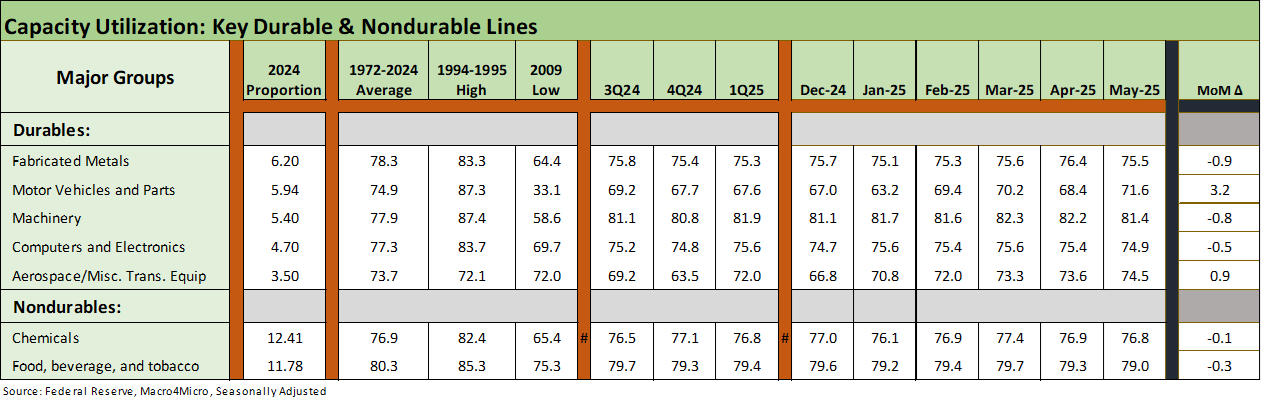
The above chart breaks out the cap ute results for some of the largest industry buckets. Motor vehicles and Aerospace rose, but the remainder were negative. The Section 232 process is underway for Commercial Aircraft/Engines/Parts and auto tariffs were flagged by Trump this past week as possibly going higher. There is no EU deal, no Japan deal, and no South Korea deal. That is a lot of cars.
Add to all that Trump’s declaration of war on Mexico and Canada autos, and US assembly plants will be busy. Supplier chain costs will be the setback that leads to higher prices. How much gets eaten along the chain and by the OEMs remains to be seen.
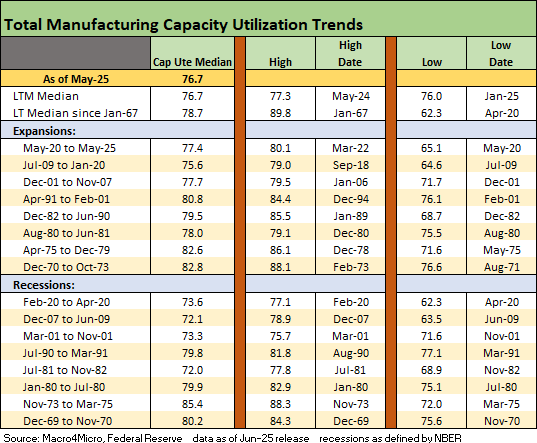
The above table updates the capacity utilization history for expansions and recessions. The ability of more companies to generate solid profits at lower capacity utilization in today’s markets is tied in part to automation and in part to the development of low-cost supplier chains. Low-cost supplier chains are now fatally threatened by tariffs.
Those supply chains were risk mitigating structural advantages of global sourcing that are about to be shredded by Trump tariffs. The new tariff policies are based on a highly speculative concept of how tariffs will translate into mass investment in the US to reshore and expand as companies scrap their offshore asset base. That will unfold with the risk of what the policy architects have described as “mild disruptions” and a “little pain” with some backpedaling on recession probabilities (that was not the campaign story line).
The topic of low-cost supplier chains in global trade has been rejected by Trump. His tariff policies will serve to raise breakeven volumes again on higher unit costs. Of course, the swing factors in breakeven rates are price and mix. “Price” vs. expense” is the commonsense core of the economic impact debate. Tariffs mean the buyer of the supplies (or finished goods) will see the cost of sales rise, which in turn requires that “buyer” (who “writes the check” to customs for the tariffs) will need to raise prices or take out other costs to preserve margins.
We have covered these topics in detail (see The Trade Picture: Facts to Respect, Topics to Ponder 2-6-25) in a wide range of tariff commentaries in the archive.
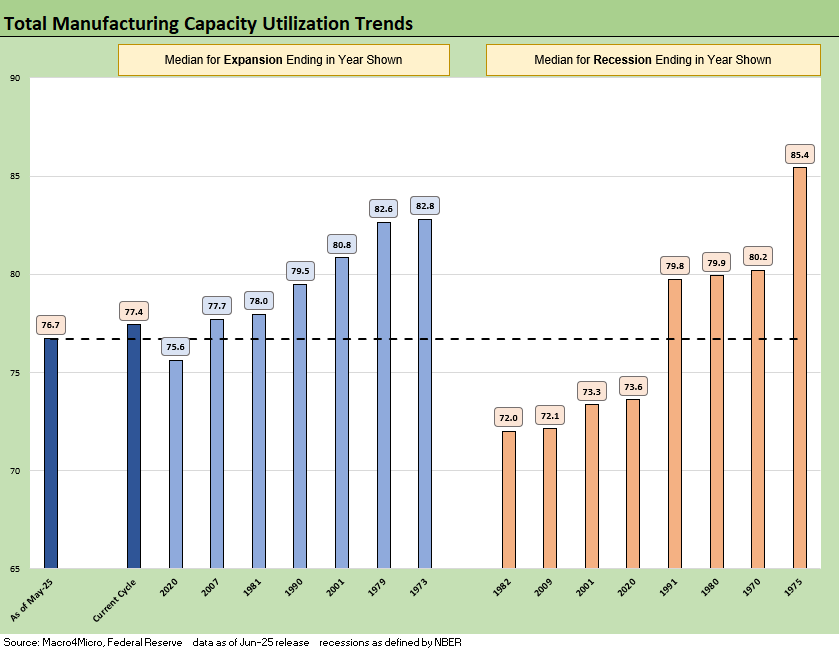
The above chart details expansion and recession averages and lines them up by height as a frame of reference. We see the current level on the left.
See also:
Footnotes & Flashbacks: Credit Markets 6-16-25
Footnotes & Flashbacks: State of Yields 6-15-25
Footnotes & Flashbacks: Asset Returns 6-15-25
Mini Market Lookback: Deus Vult or Deus Nobis Auxilium 6-14-25
Credit Snapshot: Hertz Global Holdings 6-12-23
CPI May 2025: The Slow Tariff Policy Grind 6-11-25
Footnotes & Flashbacks: Credit Markets 6-9-25
Mini Market Lookback: Clash of the Titans 6-7-25
Payrolls May 2025: Into the Weeds 6-6-25
Employment May 2025: We’re Not There Yet 6-6-25
US Trade in Goods April 2025: Imports Be Damned 6-5-25
Past-Prologue Perspective for 2025: Memory Lane 2018 6-5-25
JOLTS April 2025: Slow Burn or Steady State? 6-3-25
Tariffs: Testing Trade Partner Mettle 6-3-25
Mini Market Lookback: Out of Tacos, Tariff Man Returns 5-31-25
PCE April 2025: Personal Income and Outlays 5-30-25
Credit Snapshot: Meritage Homes (MTH) 5-30-24
1Q25 GDP 2nd Estimate: Tariff and Courthouse Waiting Game 5-29-25
Homebuilder Rankings: Volumes, Market Caps, ASPs 5-28-25
Durable Goods Apr25: Hitting an Air Pocket 5-27-25
Mini Market Lookback: Tariff Excess N+1 5-24-25
New Home Sales April 2025: Waiting Game Does Not Help 5-23-25
Existing Home Sales April 2025: Soft but Steady 5-22-25
Credit Snapshot: Lithia Motors (LAD) 5-20-25
Home Starts April 2025: Metrics Show Wear and Tear 5-19-25
Industrial Production April 2025: CapUte Mixed but Time Will Tell 5-15-25