
Mini Market Lookback: Deus Vult or Deus Nobis Auxilium
An extraordinary week for the country and the world brought a muted response for the trailing 1-week.

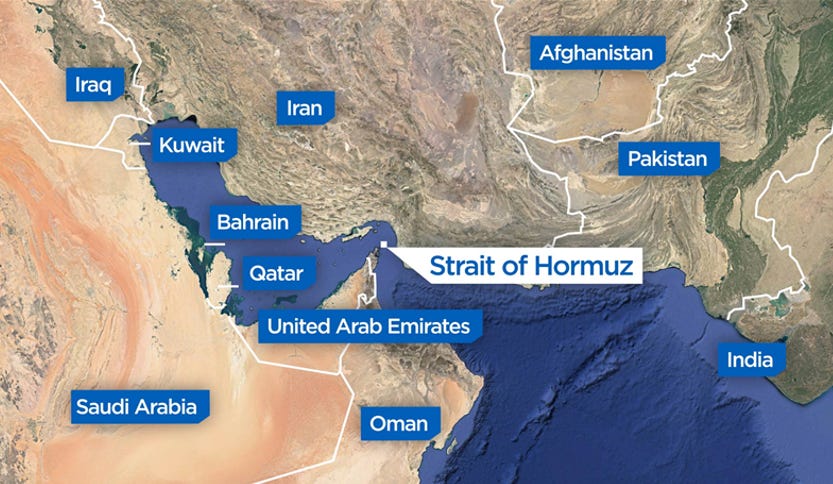
Risky waters to navigate for global oil supply.
The good news for the week was that the dollar and UST can still operate as flight-to-quality assets and that CPI remains very much in check for now. The market awaits a better read on tariffs, what the final rates will be for reciprocals, and how those will flow into the pricing of goods or operating expenses. There are no magic frictionless wheels.
Constructive trade news out of London was helpful even if the solidity of the framework was grossly overstated in the aftermath. Chinese students can attend school here and China will free up supply of rare earths and strategic metals (for at least 6 months). Trump briefly rattled the markets by saying he would unilaterally assign the paused reciprocal tariffs very soon even as he indicated he would raise auto tariffs again. The crowded pipeline of Section 232 tariffs still are on the way (pharma, semis, aircraft/parts, copper, lumber).
The credit markets have proven resilient recently, but equities lagged this past week with the 11 S&P 500 sectors posting a mix of 7 negative and 4 positive. Our group of 32 benchmarks and ETFs posted a score of 15-17 but with all 4 index benchmarks in the red across the S&P 500, NASDAQ, Midcaps, and Russell 2000. Bond ETFs comprised half of the top quartile in the group of 32.
The latest headline tumult includes an escalating war between Israel and Iran with its potential for an oil shock given the profile of the current clash. A lot of scenarios can be drawn up including closing a major chokepoint for oil in the Strait of Hormuz. Unlike past clashes, this current one is more existential for Iran and its leadership.
A major constitutional conflict is unfolding in the US over the usurping of state’s rights after the deployment of military resources on the ground by Trump without state consultation with many more such episodes ahead targeting urban blue cities. The budget bill includes curbs on judicial checks on the President’s ability to operate unilaterally (Section 70302) while the weekend saw the political targeting and shooting of two Democratic Midwest lawmakers (MN) and their spouses (2 dead, 2 wounded). The US is doing its best imitation of a 1970s emerging market. Such legislative actions to undermine checks and balances feed authoritarian fears and could cast a pall over consumers and capital budgeting planning.
This coming week will bring Retail Sales and Industrial Production on Tuesday, Housing Starts and the FOMC meeting and dot plot on Wednesday, and the Juneteenth national holiday on Thursday (brace for MAGA overuse of the word “woke”).
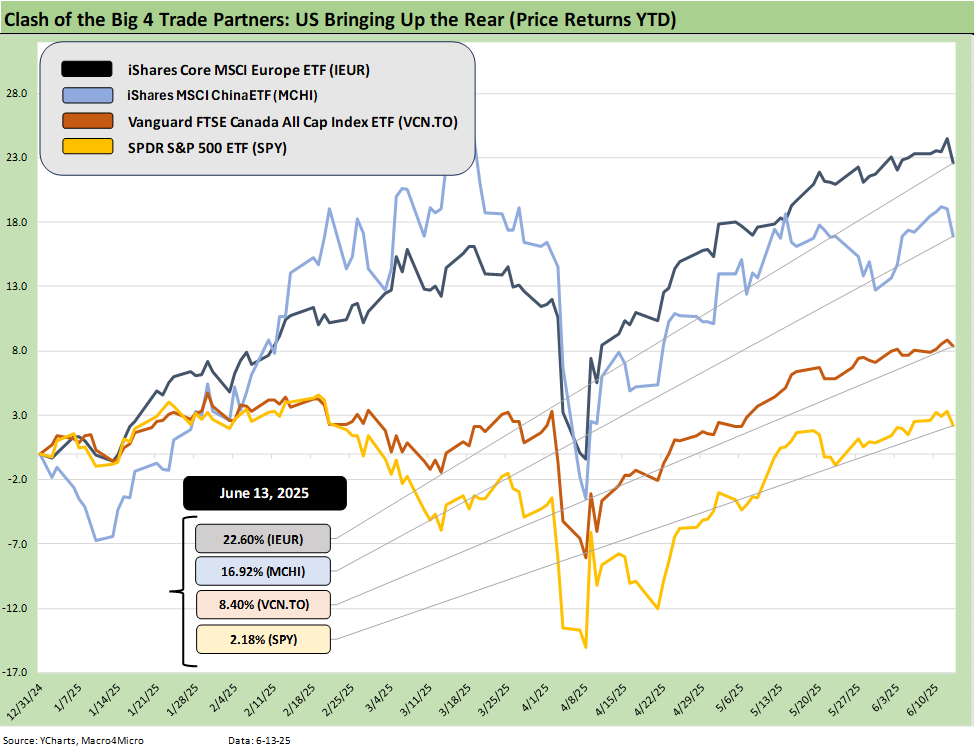
We update the Battle of the Trade Partners above. As a reminder, we use a cross-section of benchmark equity ETFs for the 4 major clashing trade partners – US vs. Europe vs. China vs. Canada. We use what we consider to be useful ETFs that frame those markets across a diversified mix of industries and market caps. We cut the US a break by using the S&P 500 ETF (SPY) since generally small caps and midcaps have lagged YTD.
There has been little change in the order with Europe at #1 and China at #2 with double-digit YTD returns. Canada is #3 in single digits but well ahead of the US returns by a multiple. This coming week will be sorting out some of the winners and losers on oil price scenarios, but that would favor Canada in theory. If Canada can get its domestic house in order, the current backdrop would be opportune for them to seek investment capital and alliances for energy infrastructure.
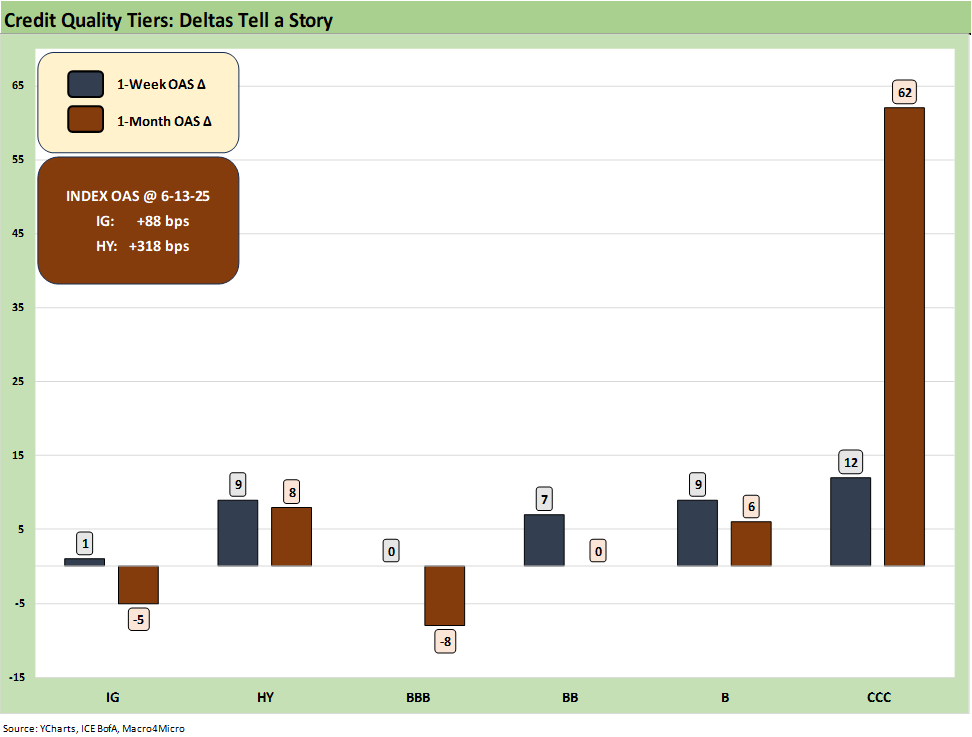
Credit markets have moved into a quiet stretch over 1-week and 1-month in relative terms after a wild April spike and rally into May as we detail in other charts below. We were surprised not to see more of a reaction in HY spreads at the end of the week to the Israel-Iran escalation and forecast for much more military action ahead.
Oil prices can flow into earnings trends very quickly and notably into the expense structure of energy intensive operations. Consumer discretionary cash flow can also take a hit during peak driving season. Headline CPI has been riding deflation in energy (notably gasoline) but that could change materially in coming weeks (see CPI May 2025: The Slow Tariff Policy Grind 6-11-25).
The oil crisis scenarios are easy enough to spin since the market has been there more than a few times across the decades. The tempering influence could be that the credit markets are in relatively good shape vs. such periods as 2008 (record summer oil spike) and fall 1990 when both markets had already seen the credit markets sliding (crashing) in dramatic fashion. The US has also been posting record oil production levels in recent years and Canada’s production capacity has soared since those prior cycles.
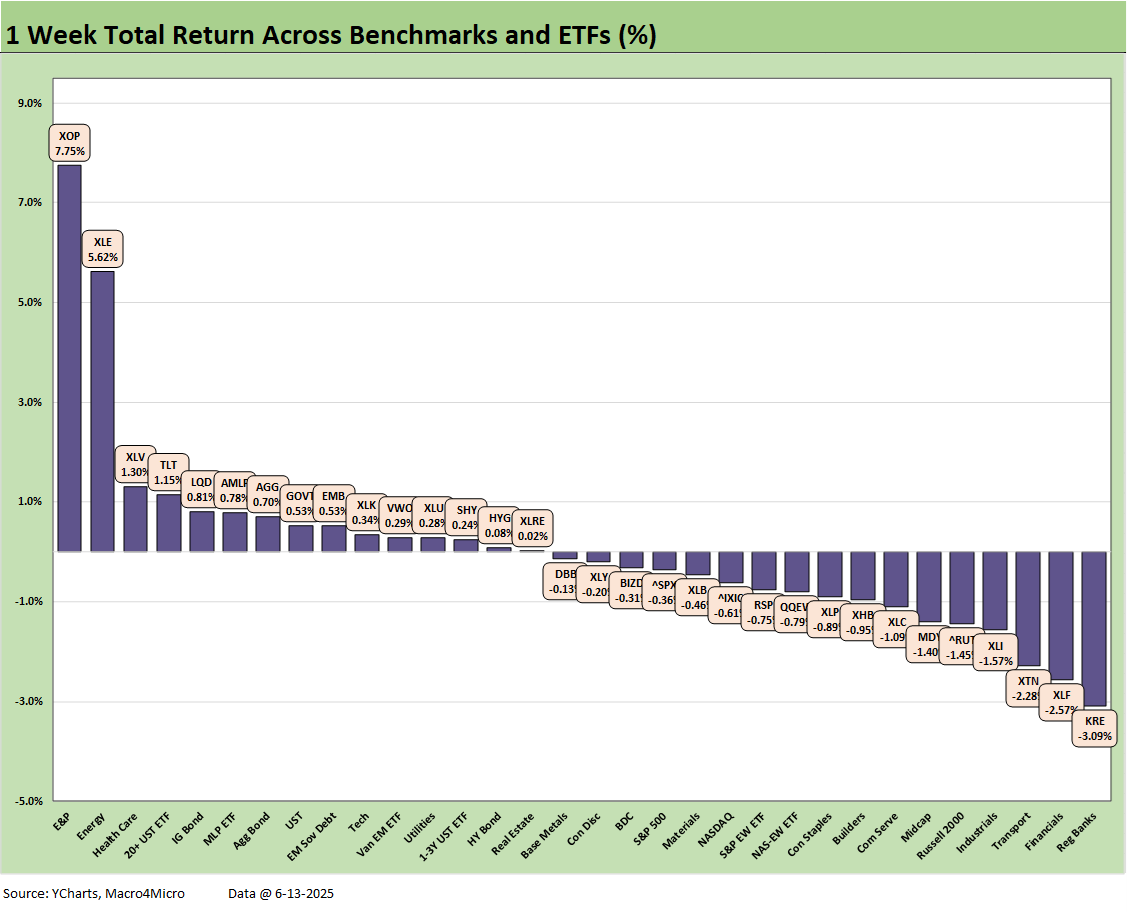
The weekly returns weighed in at 15-17 with the E&P ETF (XOP) soaring and the broader Energy ETF (XLE) right behind it. It will be a debate over the inflationary impact of higher oil vs. what the cyclical headwinds that such an oil spike will bring. Oil could cut into consumer budgets and raise demand questions. We will see if Powell gets any inquiry on the topic in his coming press conference (besides “transitory”). We will look at asset returns in more detail in our separate footnotes publication to be posted later this weekend.
Regardless of what noise is made by tariff advocates, the buyers of the goods “write the check to customs” for tariffs and there will be either an expense or a price impact – or both. More signals will be rolling out in tariff economics during the summer. A material move higher in oil back to the $100 range would be hard to absorb, and then the demand vs. price trade-offs will be getting scrutinized for Fed policy handicapping. Energy use, raw materials, rising freight and logistics costs (fuel surcharges, etc.) all play some role.
Oil prices rising sharply will feed inflation scenarios. Trump will blame Iran for oil prices if his CPI and PCE numbers go the wrong way, but he will forget that he never blamed Putin for the 2022 inflation spike after the late Feb 2022 invasion of Ukraine that helped send CPI to 9.1% by June. That was all Biden’s fault. Obviously.
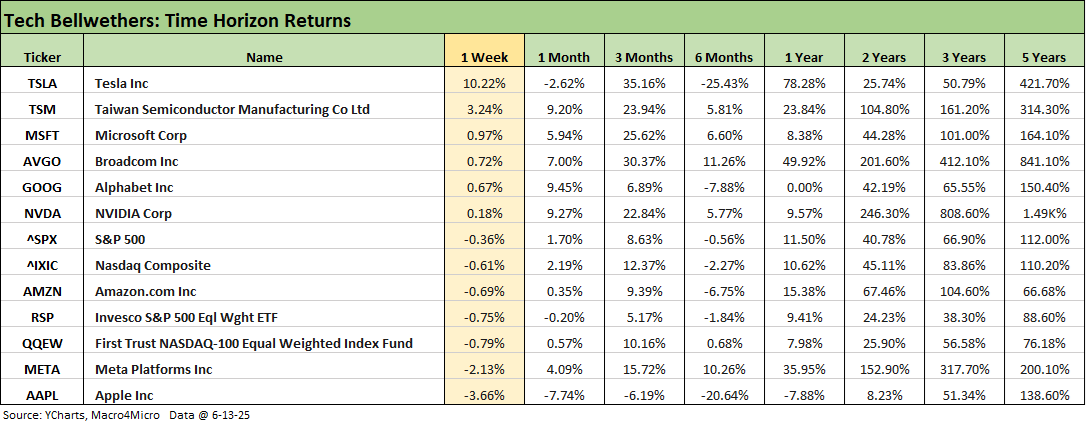
The tech bellwethers above were mixed with 4 of the Mag 7 positive on the week, 5 of 7 positive for 1-month, and 6 of 7 positive for the 3-month period as tech makes a comeback. The 6-month period saw 4 of 7 in negative range, so it had not been an easy ride with more differentiation across the group.
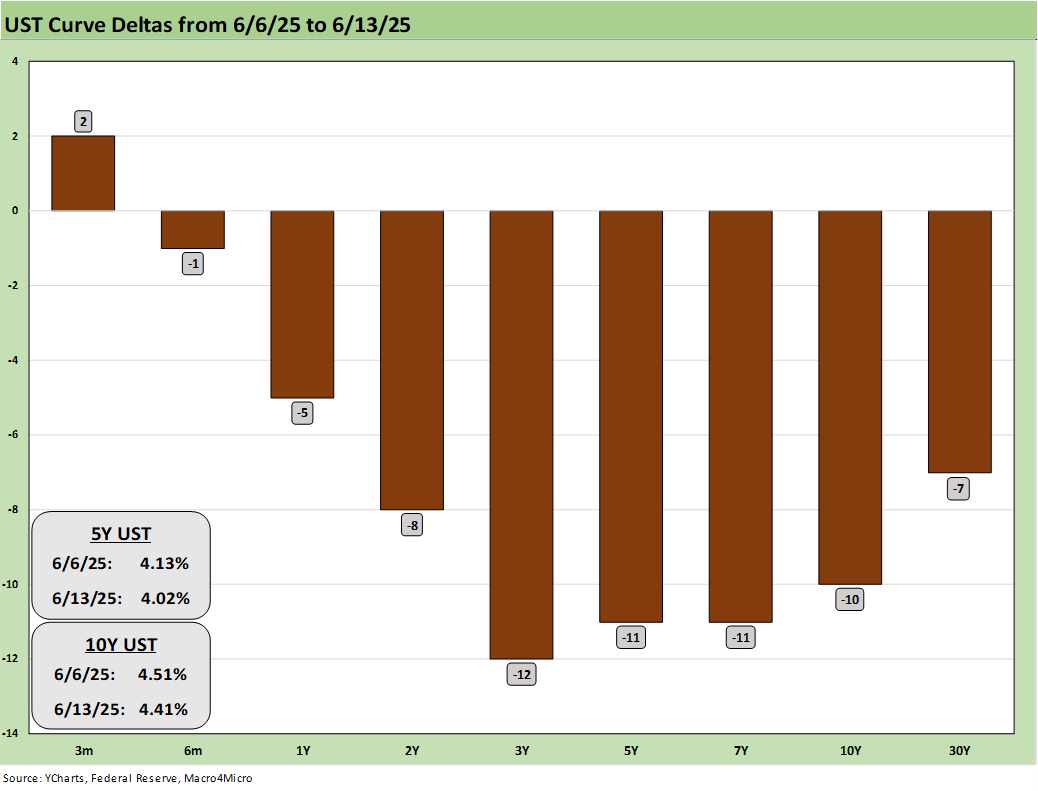
The 1-week UST deltas show a decent rally across the week that sent 4 of the 7 bond ETFs we watch into the top quartile of the 32 asset lines we detailed earlier. The long duration UST 20+ Year ETF ranked #4 on the week with the longer duration IG Corp ETF (LQD) at #5 with AGG at #7 and GOVT at #8.
All eyes will be on the dot plot from the FOMC this month for a read on how they are framing up inflation risk, GDP growth, and expected fed funds timing. Trump will make noise again, but he will offer no details on whether the buyers “write the checks” on the tariffs or what his volatile and erratic policies will bring for tariffs in the end. The tariffs continue to be weekly moving targets. That does not make the FOMC’s job easier when critical variables are withheld and a wide range of outcomes is presented. Trump’s recurring “I collected hundreds of billions of tariffs from selling countries” is embarrassing in what it reflects on his grasp of the issues. The sheep do not call him out on it.
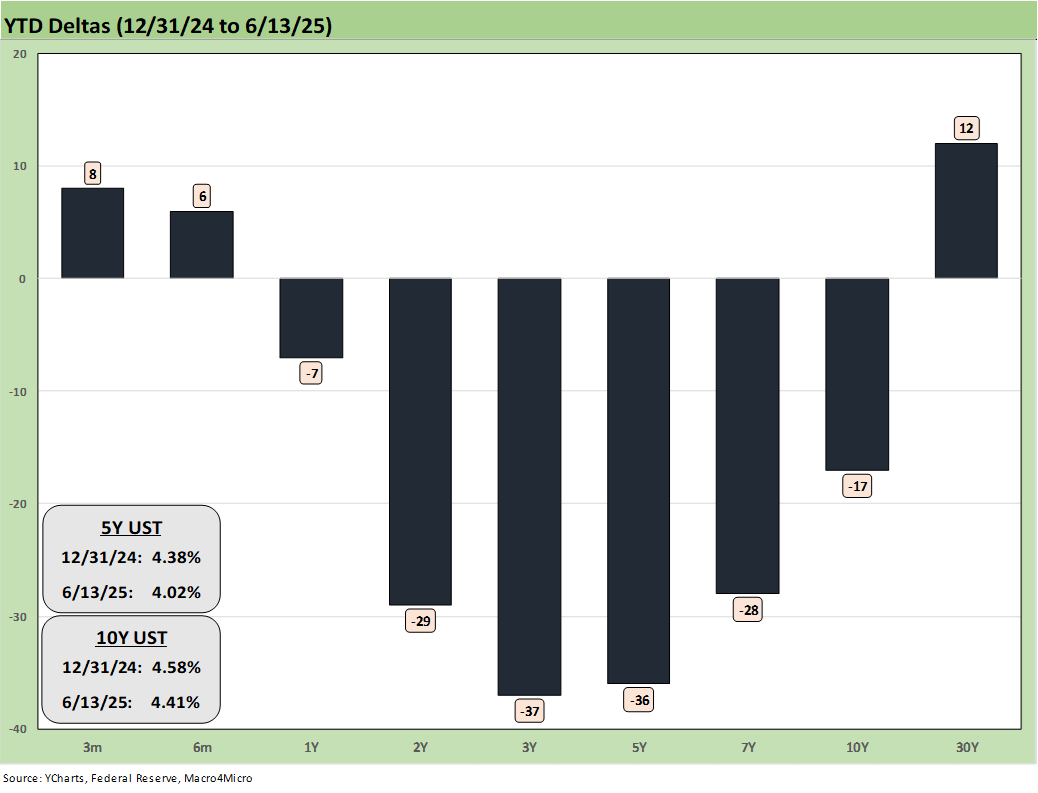
The YTD UST deltas still show a solid move lower from 2Y to 10Y. That UST shift has helped keep all 7 of the bond ETFs we track in our peer group of 32 in positive return range. EM Sovereigns (EMB) made the top quartile while HYG, LQD, and AGG made the second quartile. For the YTD period, the 7 bond ETFs have outperformed Midcaps and the Russell 2000 equity index.
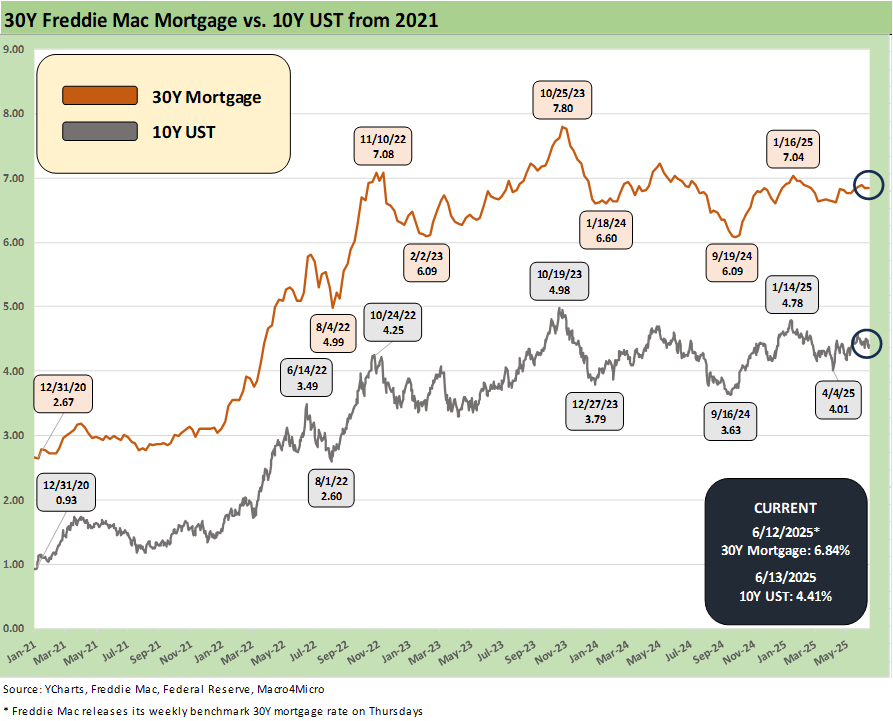
The above time series updated the Freddie Mac 30Y mortgage benchmark (released on Thursday) vs. the 10Y UST (Friday quotes). Mortgages have been languishing in the high 6% range for some time. We get the latest home start details this coming week.
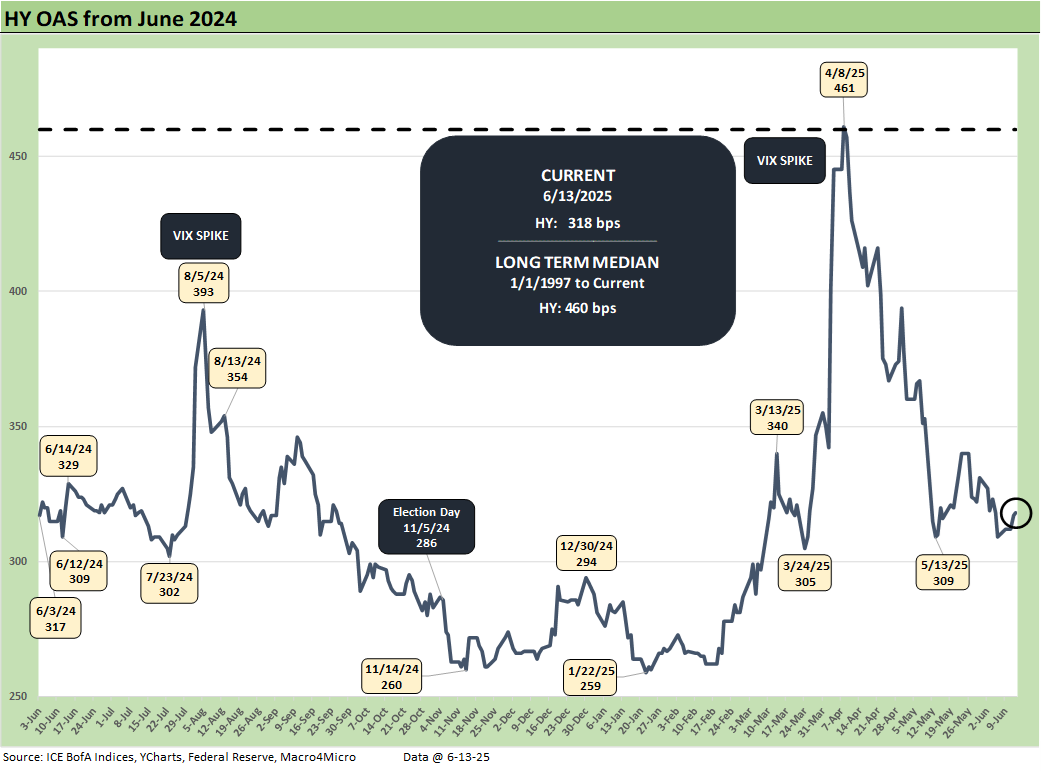
We update the recent HY OAS ride above. At +318 bps, HY OAS is sitting around the early Oct 2018 cyclical lows. The week saw +9 bps widening.
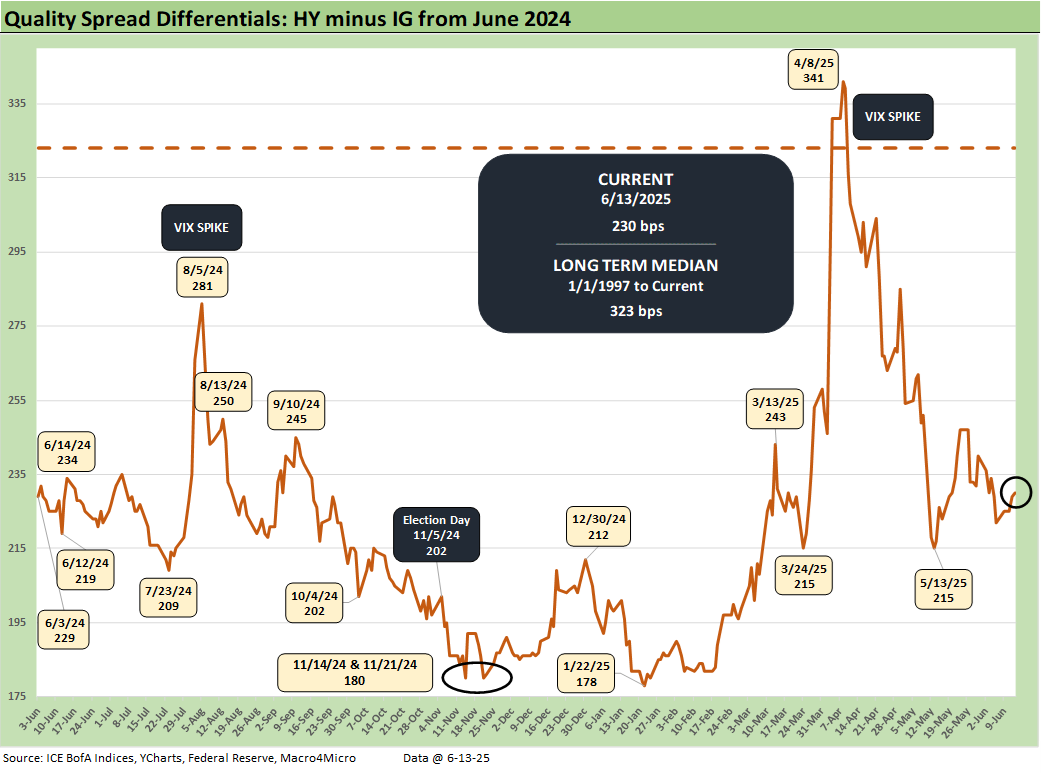
The “HY minus IG OAS” quality spread differential widened by 8 bps this week to +230 bps. That is a long way from the +323 bps post-1996 median.
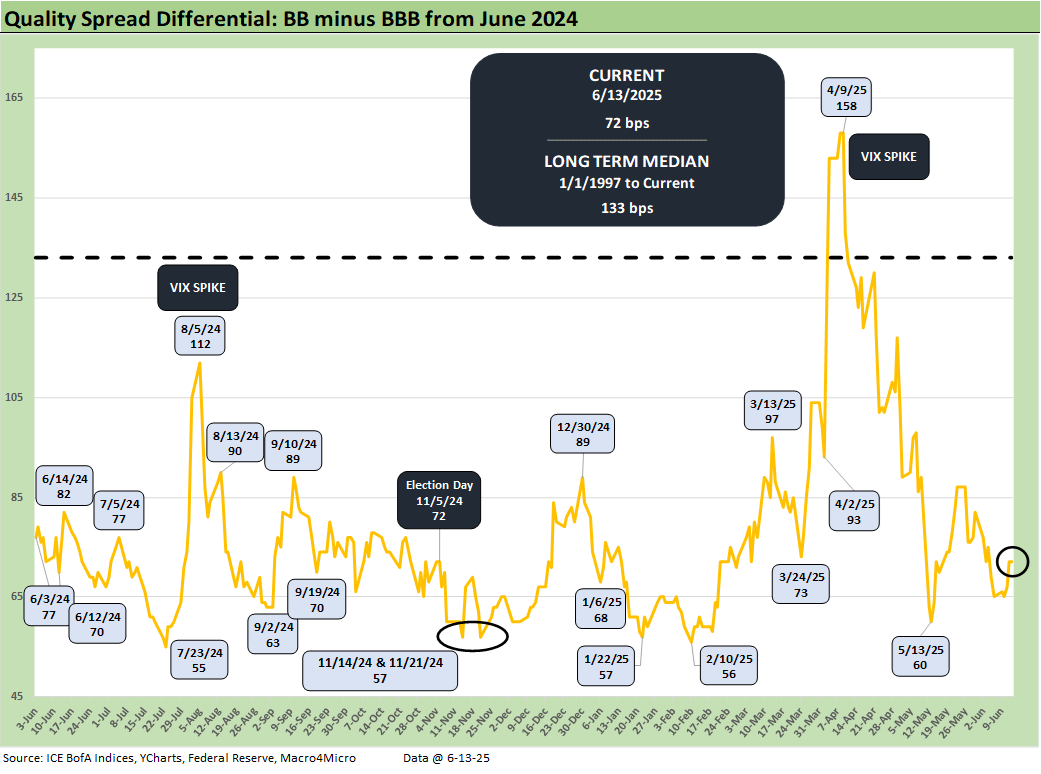
The “BB OAS minus BBB OAS” quality spread differential widened by +7 bps to +72 bps this past week, or well inside the +133 post-1996 median.
See also:
Credit Snapshot: Hertz Global Holdings 6-12-23
CPI May 2025: The Slow Tariff Policy Grind 6-11-25
Footnotes & Flashbacks: Credit Markets 6-9-25
Footnotes & Flashbacks: State of Yields 6-8-25
Footnotes & Flashbacks: Asset Returns 6-8-25
Mini Market Lookback: Clash of the Titans 6-7-25
Payrolls May 2025: Into the Weeds 6-6-25
Employment May 2025: We’re Not There Yet 6-6-25
US Trade in Goods April 2025: Imports Be Damned 6-5-25
Past-Prologue Perspective for 2025: Memory Lane 2018 6-5-25
JOLTS April 2025: Slow Burn or Steady State? 6-3-25
Tariffs: Testing Trade Partner Mettle 6-3-25
Footnotes & Flashbacks: Credit Markets 6-2-25
Mini Market Lookback: Out of Tacos, Tariff Man Returns 5-31-25
PCE April 2025: Personal Income and Outlays 5-30-25
Credit Snapshot: Meritage Homes (MTH) 5-30-24
1Q25 GDP 2nd Estimate: Tariff and Courthouse Waiting Game 5-29-25
Homebuilder Rankings: Volumes, Market Caps, ASPs 5-28-25
Durable Goods Apr25: Hitting an Air Pocket 5-27-25
Mini Market Lookback: Tariff Excess N+1 5-24-25
New Home Sales April 2025: Waiting Game Does Not Help 5-23-25
Existing Home Sales April 2025: Soft but Steady 5-22-25
Credit Snapshot: Lithia Motors (LAD) 5-20-25
Home Starts April 2025: Metrics Show Wear and Tear 5-19-25
Industrial Production April 2025: CapUte Mixed but Time Will Tell 5-15-25