
Market Commentary: Asset Returns 11-2-25
A week with no shortage of crosscurrents saw mixed returns for benchmarks, industry ETFs, and bond ETFs.


I admire your taste Mister Trump!
Asset returns lagged this past week despite some “record high” headlines and solid 3Q25 numbers from more than a few bellwethers as our group of 32 benchmarks and ETFs weighed in at 10-22 positive-negative with only a single bond ETF of the 7 in positive range (see Mini Market Lookback: Not Quite Magnificent Week 11-1-25). The 11 S&P 500 sectors saw 6 negative, 4 positive, and 1 flat.
The Fed commentary trumped the action of -25 bps as the FedWatch odds for a December -25 bps cut plunged to 69.3% as we go to print, up from 63% on Friday but down from almost 92% 1 week ago. Duration was hit this week by the adverse UST move. The interest rate sensitive industries were among the worst performing ETFs such as Real Estate (XLRE) and Homebuilders (XHB).
The extended shutdown saw some good/bad news flow as the court ruled SNAP benefits needed to be paid. Unfortunately, Team Trump stalled on the decision and sought legal clarification. The result as we go to print is that the food benefits expired. Furthermore, the consumer headwinds continued with the Nov 1 ACA premium information flowing to the public with the sign-up period started. Those two key policy risks (SNAP, ACA) will be a zero-sum game for consumers and the economy (discretionary income and outlays). The cost impact will not do wonders for consumer credit quality (especially subprime) unless something can shift modestly back in the direction of the status quo.
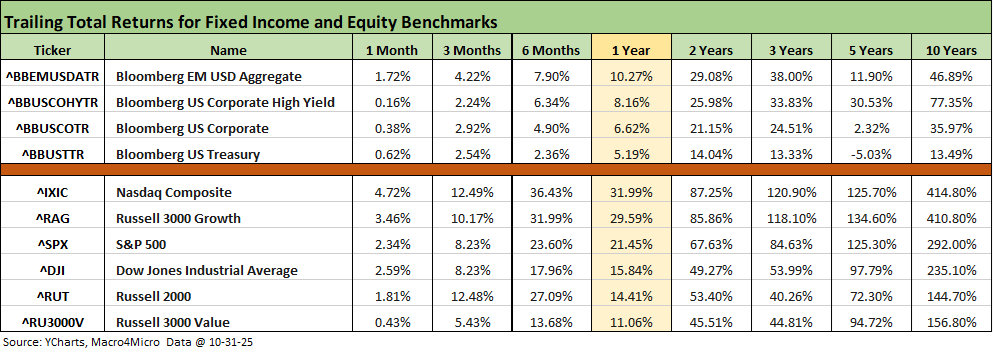
The above table updates the running returns for the high level debt and equity benchmarks. The boxes and time horizons are again all positive with the same exception of the trailing 5-year returns for UST (-5.0%) as the curve transitioned from ZIRP to where we stand on the other side of the tightening cycle and into the easing process.
The main equity benchmarks under pressure remains Russell 3000 Value at under 0.5% for the 1-month time horizon. All the equity benchmarks are in double digits for the past 1 year. In debt benchmarks, this past 1-month period shows duration taking its toll and HY is just coming off a rough 1-month period for spreads.
The rolling return visual
In the next section, we get into the details of the 32 ETFs and benchmarks for a mix of trailing periods. Below we offer a condensed 4-chart view for an easy visual on how the mix of positive vs. negative returns shape up. This is a useful exercise we do each week looking for signals across industry groups and asset classes.
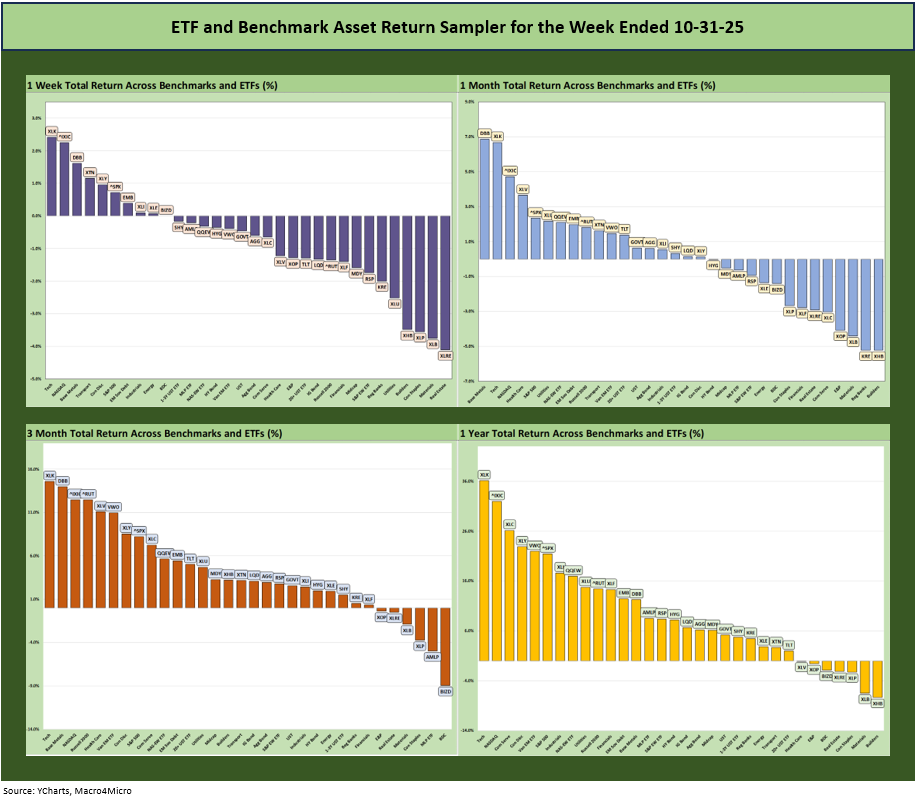
The positive symmetry we have seen for so much of the year is fading a bit in the home stretch. That is notably the case in the weekly and monthly mix, but the year will be a good one unless some major event hits the market in the holiday season. Trump has ducked a fresh disaster with China, and the odds of Canada or Mexico aggressively pushing back on the US appears low.
The Magnificent 7 heavy ETFs…
Some of the benchmarks and industry ETFs we include have issuer concentration elements that leave them wagged by a few names. When looking across some of the bellwether industry and subsector ETFs in the rankings, it is good to keep in mind which narrow ETFs (vs. broad market benchmarks) get wagged more by the “Magnificent 7” including Consumer Discretionary (XLY) with Amazon and Tesla, Tech (XLK) with Microsoft, Apple, and NVIDIA, and Communications Services (XLC) with Alphabet and Meta.
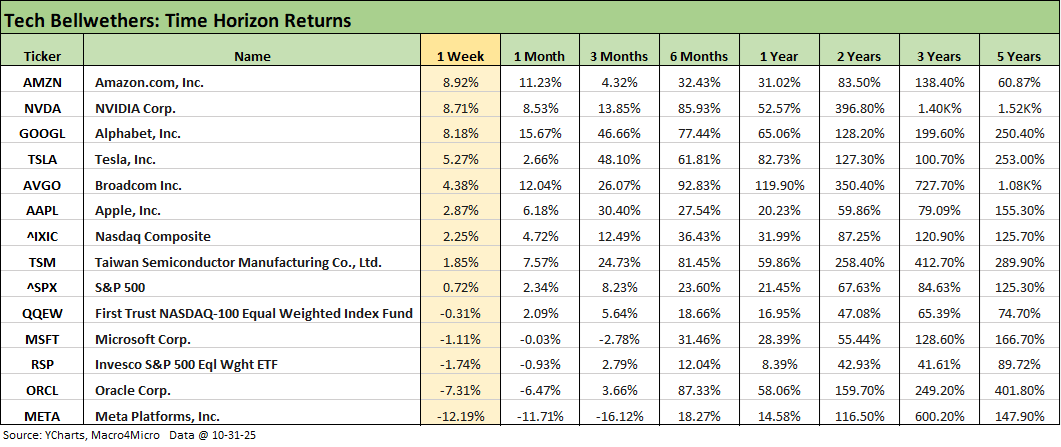
We already looked at the weekly tech bellwether returns in our Mini Market Lookback: Not Quite Magnificent Week (11-1-25). The Hi-Lo range between Amazon and Meta of around 21 points stands out as Meta was pounded in a week when it got press for the biggest bond deal of the year. While Meta was well inside the all-time record size of bygone M&A deals, this deal was part of an aggressive expansion program that is growing the on and off balance sheet debt totals.
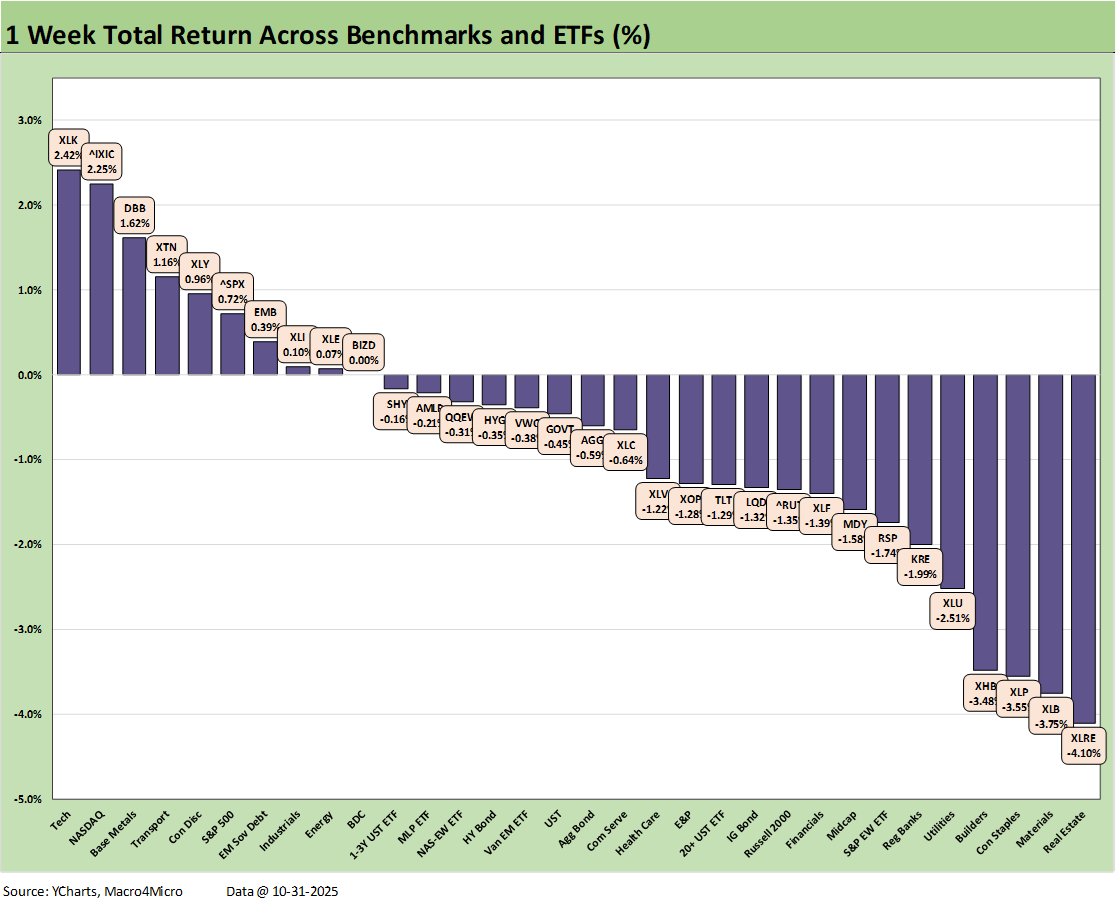
We looked at the 1-week returns already in our Mini Market Lookback: Not Quite Magnificent Week (11-1-25). The 10-22 positive-negative score was not consistent in theory with an FOMC easing move, some event risk mitigating news in US-China trade, ADP talking up payroll scenarios, and a decent earnings season. The protracted shutdown is getting serious and will break the Trump 1.0 record this week. The increasingly clear economic impact on consumers from household budget pain (healthcare, food) is significant.
The disinformation on tariffs will not change any time soon since the shelf life of nonsense has legs in these strange times (Trump is even talking more about the Justice Department investigating 2020 voter fraud). That said, misstatements on tariffs do not comprise a “variable” and are more of a “constant.” What is not constant is the “tariff game clock” as the tariff costs paid to customs add up and work their way into the working capital cycles.
The tariff lineup will just keep on coming and the reality of higher tariffs is higher costs. That means lower earnings or higher prices or cost mitigating actions in some combination. Tariffs also mean material pain for small businesses – a topic Trump and Bessent avoid like the plague. As the ADP economist said this week in the media (paraphrase): “Big companies create headlines but small companies create jobs.”
The main worry this week was the FOMC post-easing color and UST curve steepening with the 3M and the 1Y to 7Y UST up double digits as noted below. The UST supply realities are not going away and tariff impacts will take their course along with the forces of supply-demand, pricing power where available, and elasticity where relevant to the equation.
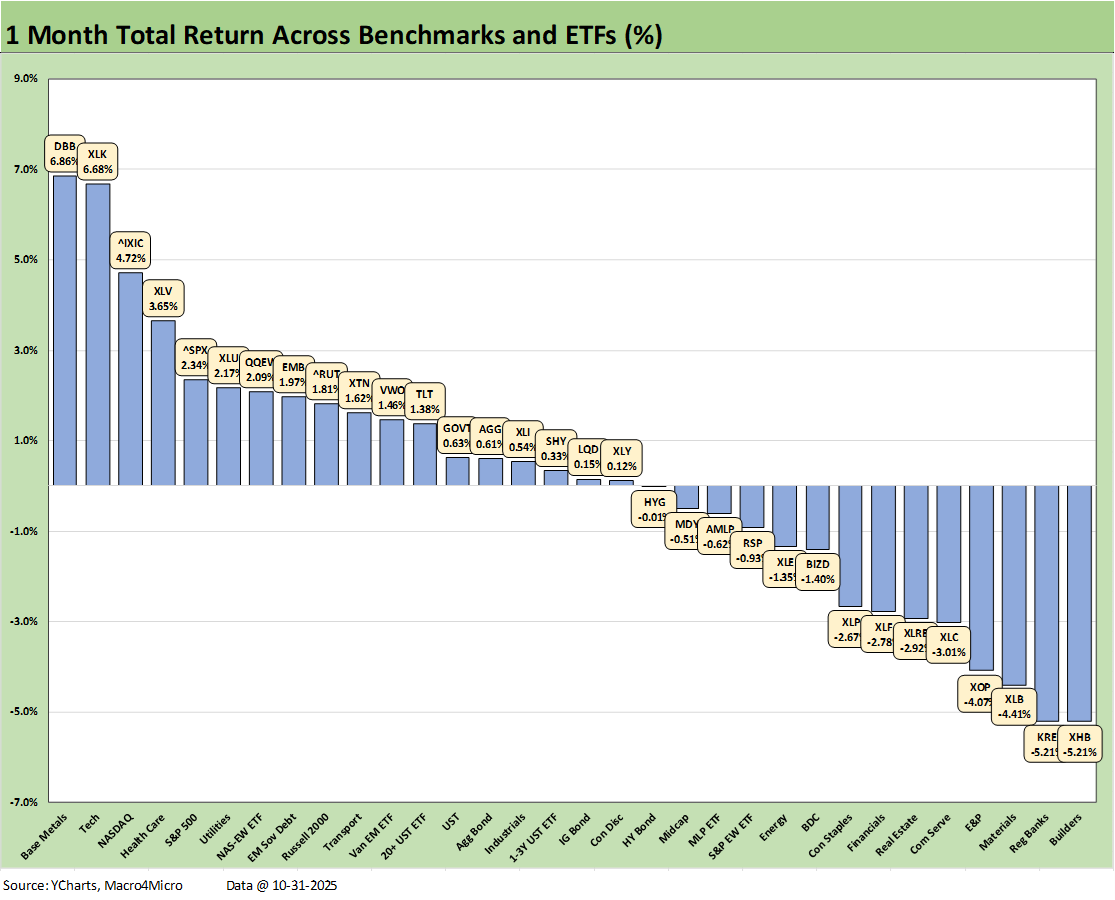
The 1-month score weighed in at 18-14 in another adverse shift from last week’s asset return update that posted a 22-10 score for 1-month. The runaway winners on the month were Base Metals (DBB) and Tech (XLK).
We see Homebuilders (XHB) on the bottom with Regional Banks (KRE) second to last and Materials (XLB) 3 off the bottom. Bond ETFs are all positive except HYG with a very slight negative in the third quartile.
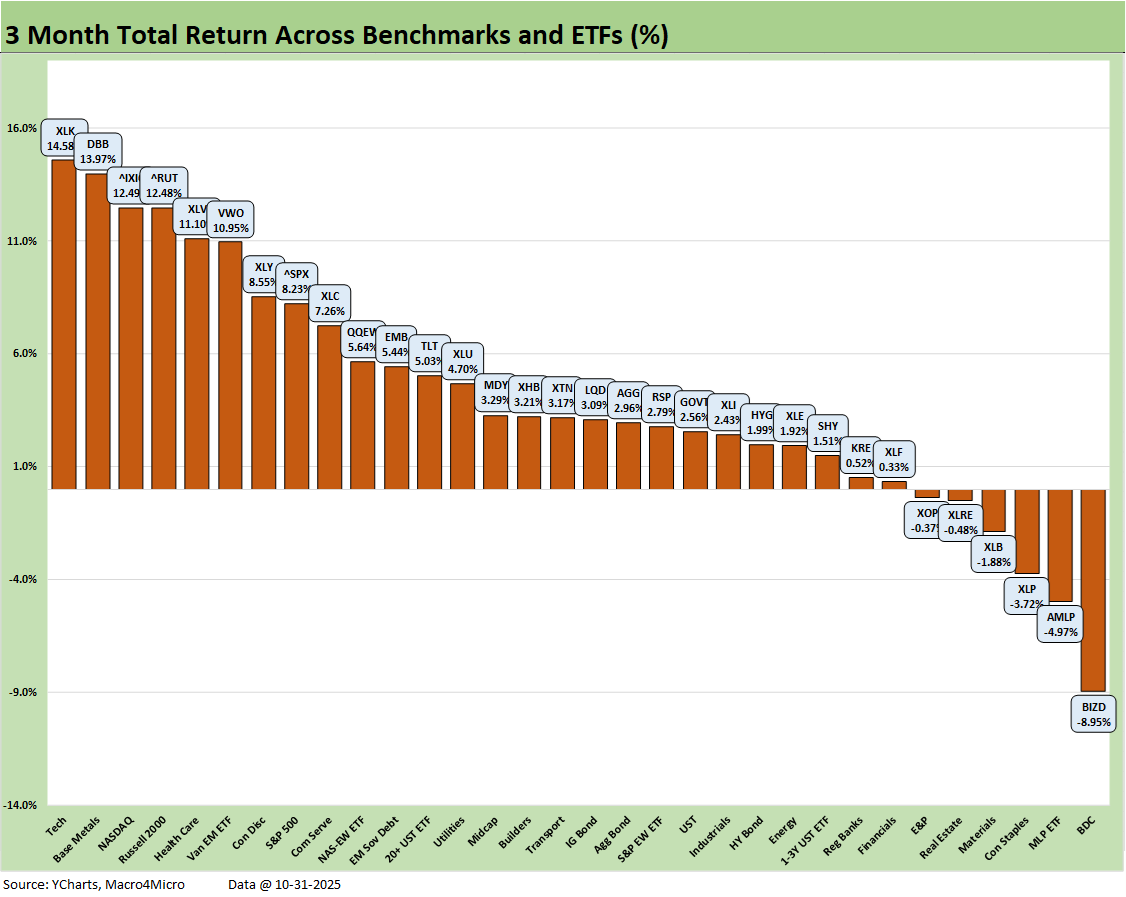
The 3-month score was 26-6 for the latest timeline, which is the same as last week. All the bond ETFs are positive and the top quartile had a heavy tech bellwether influence. A positive note was that the Russell 2000 small cap index was in the top quartile at #4. Base Metals (DBB) was a strong #2 behind Tech (XLK).
The BDC ETF (BIZD) was sitting on the bottom again with a -8.95% return (last week posted a rolling 3-month of -11.4%). This coming week brings a wave of BDC earnings, but the report from industry leader Ares this past week was reassuring on the idea that the range of well positioned BDCs do not all March in the same direction. Some of the problems in the headlines are likely to end up as more idiosyncratic than a set of systemic operating mishaps (the “cockroach” theory). There will be a lot of transcripts to look through in coming days.
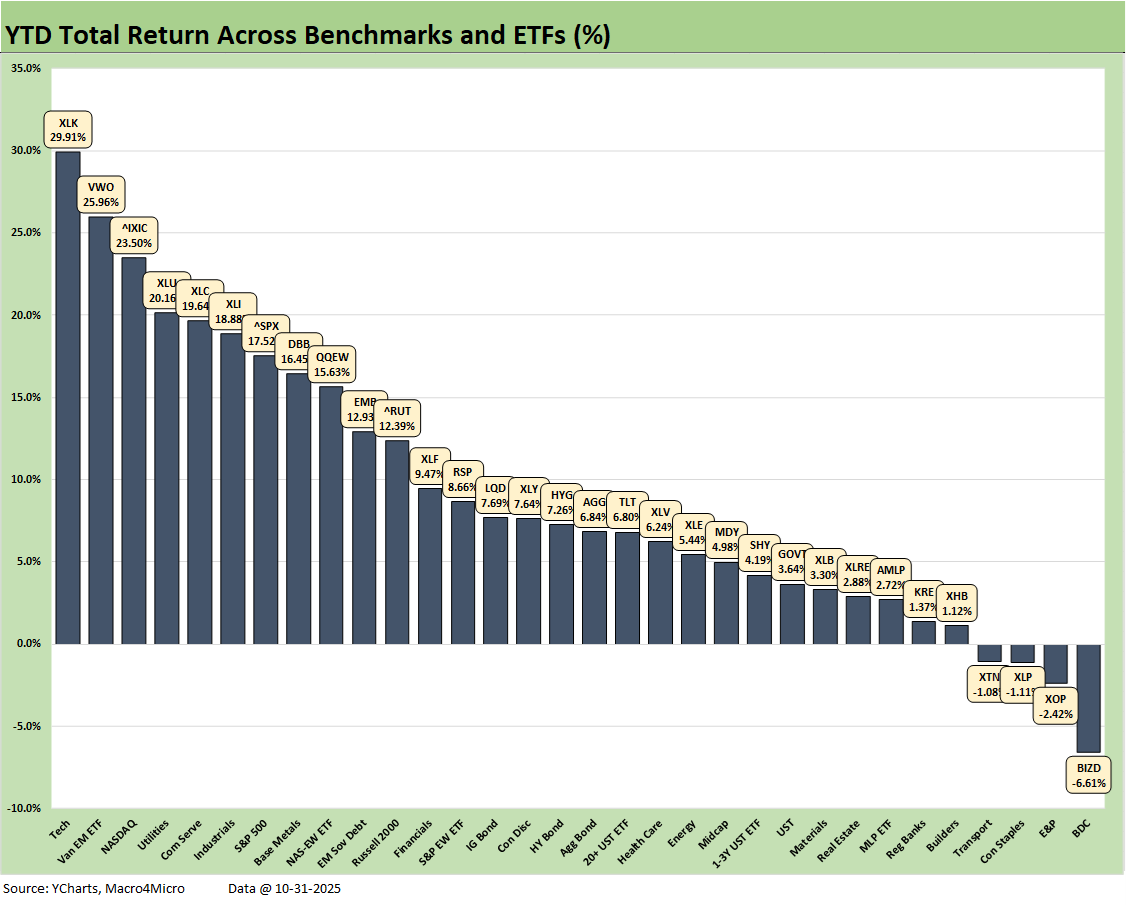
We looked at the YTD numbers in our Mini Market Lookback: Not Quite Magnificent Week (11-1-25). The 28-4 score makes for a very good performance by any standard, but the S&P 500 at +17.5% will have its hand full getting across the +25% line which was achieved in 2023 and 2024.
We see BIZD on the bottom at -6.6% with E&P (XOP) second to last with the lower average oil prices, the lingering concerns of supply overhang, and questionable demand strength into 2026. The defensive, dividend-stock-heavy Consumer Staples ETF (XLP) and more trade sensitive Transports (XTN) round out the negative numbers.
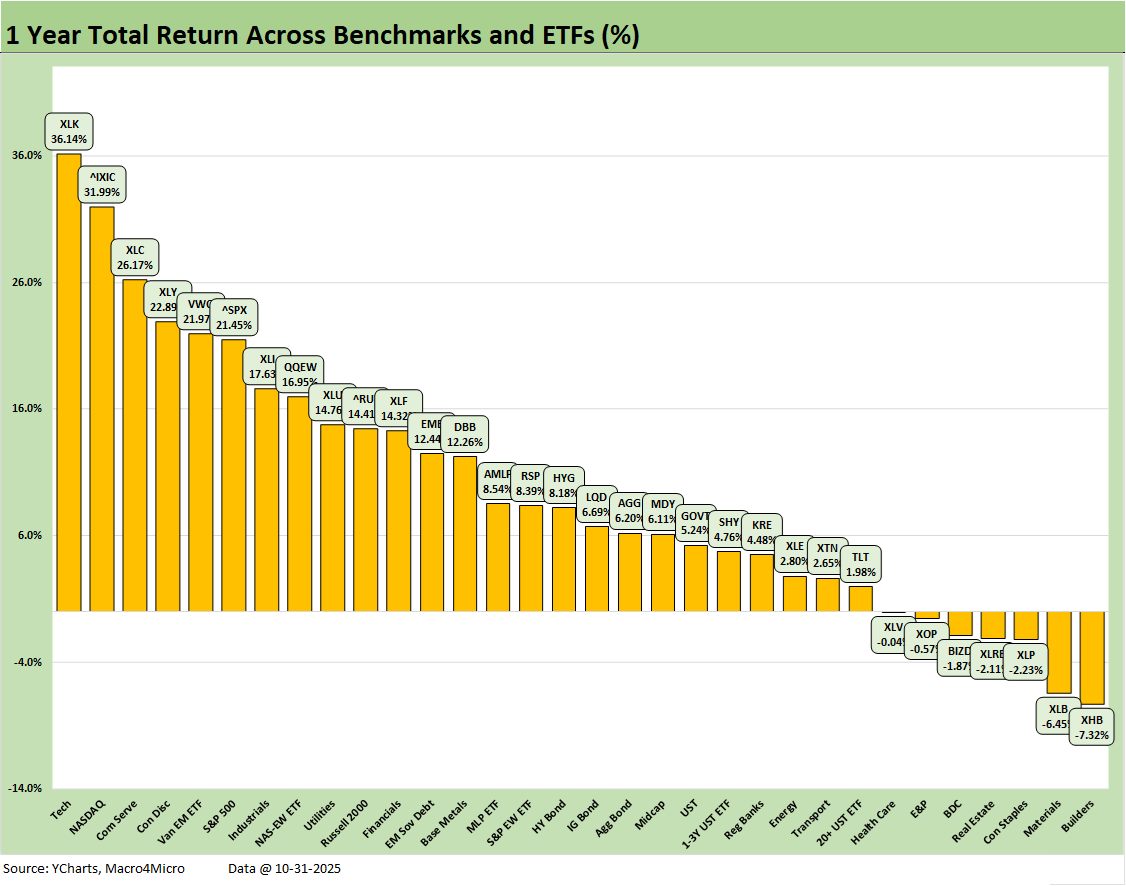
The LTM period posts a score of 25-7 with some of the usual suspects in the red with the main common theme being interest rate sensitivity with a few more tied into industry specific worries (health care, transport, E&P). The running S&P 500 at 21.4% when framed against the +17.5% YTD return sets a bar that will be hard to match up with the first back-to-back +25% years since the late 1990s that the market saw in 2023-2024. Trump might have to stop calling the US in 2024 a “dead country.”
See also:
Mini Market Lookback: Not Quite Magnificent Week 11-1-25
Synchrony: Credit Card Bellwether 10-30-25
Credit Markets: Call Me After Trouble Arrives 10-27-25
The Curve: A Slow Pour of Tariffs 10-27-25
Market Commentary: Asset Returns 10-26-25
Existing Home Sales Sept 2025: Staying in a Tight Range 10-26-25
Mini Market Lookback: Absence of Bad News Reigns 10-25-25
CPI September 2025: Headline Up, Core Down 10-24-25
General Motors Update: Same Ride, Smooth Enough 10-23-25
Credit Markets: The Conan the Barbarian Rule 10-20-25
Mini Market Lookback: Healthy Banks, Mixed Economy, Poor Governance 10-18-25
Mini Market Lookback: Event Risk Revisited 10-11-25
Credit Profile: General Motors and GM Financial 10-9-25
Mini Market Lookback: Chess? Checkers? Set the game table on fire? 10-4-25
JOLTS Aug 2025: Tough math when “total unemployed > job openings” 9-30-25
Mini Market Lookback: Market Compartmentalization, Political Chaos 9-27-25
PCE August 2025: Very Slow Fuse 9-26-25
Durable Goods Aug 2025: Core Demand Stays Steady 9-25-25
2Q25 GDP Final Estimate: Big Upward Revision 9-25-25
New Homes Sales Aug 2025: Surprise Bounce, Revisions Ahead? 9-25-25
Mini Market Lookback: Easy Street 9-20-25
Home Starts August 2025: Bad News for Starts 9-17-25
Industrial Production Aug 2025: Capacity Utilization 9-16-25
Retail Sales Aug 2025: Resilience with Fraying Edges 9-16-25
Mini Market Lookback: Ugly Week in America, Mild in Markets 9-13-25
CPI August 2025: Slow Burn or Fleeting Adjustment? 9-11-25
PPI Aug 2025: For my next trick… 9-10-25
Mini Market Lookback: Job Trends Worst Since COVID 9-6-25