
Market Commentary: Asset Returns 9-21-25
Russell 2000 small caps joined large caps at record highs while IG credit spreads look like 1997 and HY still at June 2007 levels.


The market puts the political and policy risk behind it…for now.
A very busy week of FOMC details, economic releases, and a mixed UST curve reaction ran alongside enough toxic political and ideological bile to drown out all sense of the rational. Despite that backdrop, the markets still saw a broader array of equities posting record highs and credit spreads compressing below numerous prior credit cycle peaks and even credit bubbles (see Mini Market Lookback: Easy Street 9-20-25, FOMC: Curve Scenarios Take Wing, Steepen for Now 9-17-25).
The balance of constructive economic releases this past week included Retail Sales and Industrial Production with a critical update on consumers this coming week in the PCE and Income and Outlays report (see Industrial Production Aug 2025: Capacity Utilization 9-16-25, Retail Sales Aug 2025: Resilience with Fraying Edges 9-16-25).
Housing posted bad Home Starts numbers and mortgage rates backed off from the recent, brief 6.1% handle lows while Lennar as a homebuilder bellwether reported bad numbers as well. We get the Existing Home Sales and New Home Sales numbers this week as the market still tries to find room for more optimism on the UST “steepener vs. flattener” debate and what it would mean for mortgages (see Home Starts August 2025: Bad News for Starts 9-17-25).
Many tariffs are just getting warmed up, and a lot of strategic decisions need to be worked out with respect to the “tariff cost mitigation” game plans. Anyone who tells you the tariff and inflation debate is over is pulling your chain. Many voices in the most impacted industry groups and the small businesses that make those decisions sure don’t agree. Pharma, semis, lumber, and furniture are still getting warmed up as the SCOTUS IEEPA ruling beckons in front of a court that seldom says no to Trump’s executive power ambitions (as in “checks and balances need not apply”).
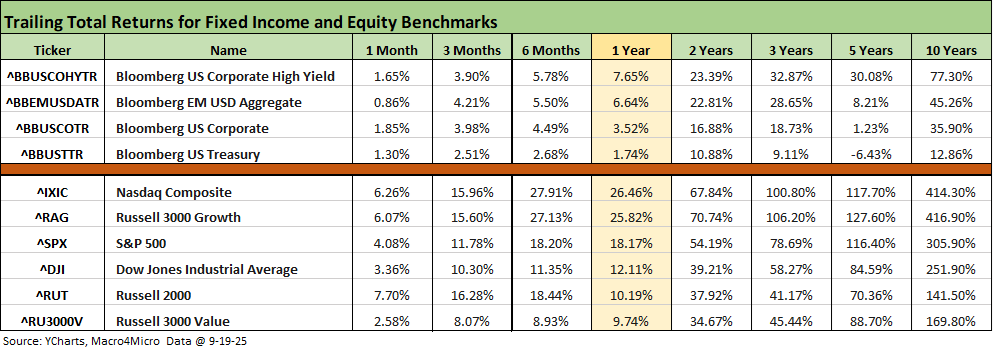
The above table updates the running returns across multiple time horizons for the high-level debt and equity benchmarks we monitor each week. The cheering section for equities has now extended to Russell 2000 small caps, and that brings some good news on market breadth.
The UST curve shapeshifting action the past week saw long duration bond ETFs in negative return range as the curve reaction to the FOMC action was mixed for bondholders. The above chart shows equities and fixed income asset lines all positive across the running periods detailed except in 5 years for the UST index. That 5-year line shows the effects of the tightening cycle and curve shift.
The fixed income and UST side of the ledger still faces that stubborn worry about tariff-induced price increases and how it could play out during a time with record supply of UST ahead, brutal deficits, and the recurring tariff story line that it is a one-time event (a deluge of Section 232 ahead and the SCOTUS IEEPA decision). The one-time event is a defensible point of view, but they hesitate to say, “one-time erosion of consumer purchasing power.’’ It is all in the delivery?
What has never been stated by Trump is that the “buyer pays customs” and that Trump is taking in record amounts of money from US buyers. Facts play a secondary role and facts are even denied for the first time in my working life since the late 70s. That period has had more GOP leaders in the White House than Democrats. They all marketed their views and stretched the stories (both parties), but this is now a period of clear “factual falsehoods” (aka lies).
The rolling return visual
In the next section, we get into the details of the 32 ETFs and benchmarks for a mix of trailing periods. Below we offer a condensed 4-chart view for an easy visual on how the mix of positive vs. negative returns shape up. This is a useful exercise we do each week looking for signals across industry groups and asset classes.
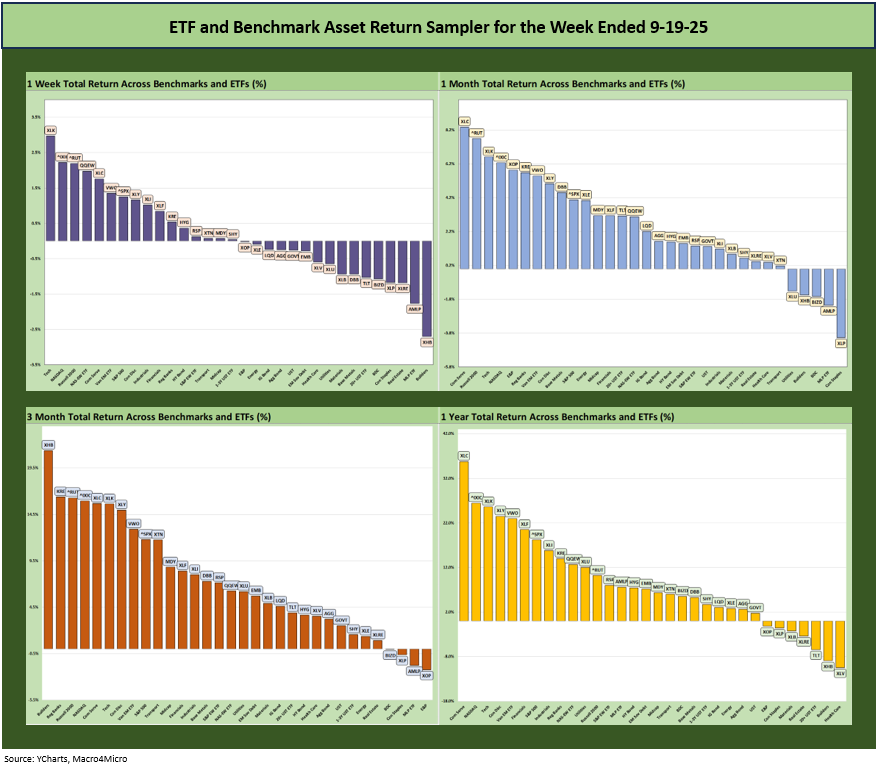
The symmetry of returns for the 32 benchmarks and ETFs were more divided this past week than one might have expected from all the “record high” headlines. The week shows a 16-16 score on positive vs. negative as we detail below. The other timelines are still heavily weighted toward positive, and the same for the YTD chart that we detail below.
The market is setting up for a great S&P 500 return for the third year in a row after the first back-to-back 25%+ years since the late 1990s (even if Trump says the US was a dead country 9 months ago). That said, the S&P 500 will still need a very strong finish in 4Q25 to match 2023 and 2024.
As we knock on the door of 3Q25 earnings season and more policy action working its way into the numbers – and with much more to come in tariffs – we will keep printing CPI and PCE price index lines each month and await the details on running tariff costs and how companies will address them.
There are ample ways to deal with tariffs through cost cutting (payroll, product line shifts, scrapped expansion plans, etc.) or simply absorbing margin pressure for a period. Companies can also redeploy capex expansion funds to stock buybacks until there is full clarity. Unfortunately, we will be in the back end of the 3Q25 reporting period by the time SCOTUS makes the call on IEEPA in November.
The Magnificent 7 heavy ETFs…
Some of the benchmarks and industry ETFs we include have issuer concentration elements that leave them wagged by a few names. When looking across some of the bellwether industry and subsector ETFs in the rankings, it is good to keep in mind which narrow ETFs (vs. broad market benchmarks) get wagged more by the “Magnificent 7” including Consumer Discretionary (XLY) with Amazon and Tesla, Tech (XLK) with Microsoft, Apple, and NVIDIA, and Communications Services (XLC) with Alphabet and Meta.
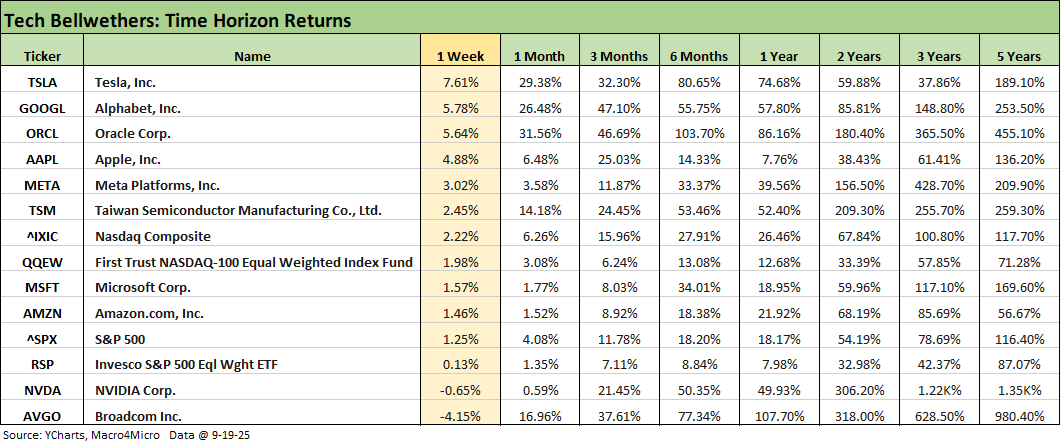
We already looked at the tech bellwether chart in our Mini Market Lookback: Easy Street (9-20-25). As of last week, the Mag 7 + Broadcom had climbed to around 37% of the S&P 500, which is a major distortion of the large cap benchmarks. Oracle also has burst into the mix in recent periods and was just below the ranks of the Top 10 names in the index (#11 on a recent list behind Berkshire).
That issuer concentration factor is why we like using the broad mix of industry ETFs and Equal Weight benchmarks. The S&P 500 weighs in at a multiple of the Equal Weight S&P 500 (RSP) over the past week and 1-month, but the differential shows better balance (but still lopsided) on a YTD basis (S&P 500 around 5.5 points higher YTD). The tech bellwethers at the median are major eye openers for the largest names with some exceptions (Apple). It is easy enough frame large cap benchmarks against the broader tech mix such as the Equal Weight NASDAQ 100 ETF (QQEW) and the Equal Weight S&P 500 ETF (RSP).
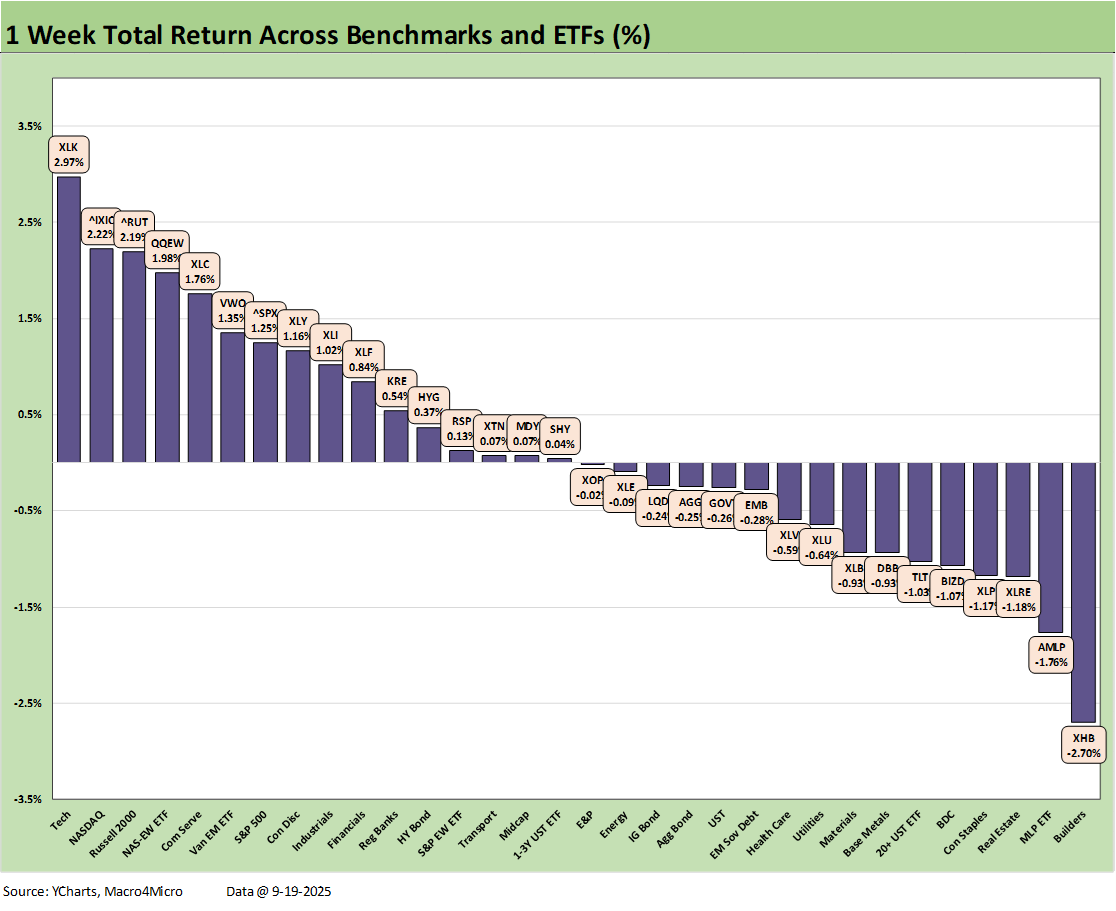
We looked at the 1-week return chart in our Mini Market Lookback: Easy Street (9-20-25). The 16-16 score for positive vs. negative is sending some signals on the potential struggles from here for numerous industries as investors look out further into 2026.
The health of the consumer sector has come under a cloud as 2025 progressed, and it will only get harder from here as more tariffs roll into working capital cycles and some of the employees end up the wrong side on “tariff cost mitigation” decisions (layoffs).
We see the tech-centric ETFs above leading the returns on the left with the Tech ETF (XLK) and NASDAQ (IXIC), Equal Weight NASDAQ 100 (QQEW) and Communications Service (XLC) making up 4 of the Top 5.
The Homebuilder ETF (XHB) took a hit this week after a period of rallying that sent it to the top of the 3-month return rankings. Housing (new or existing) is a bellwether consumer indicator that led the ETF and Benchmark return rankings in much of 2024 until it fell out of bed in 4Q24 and took a beating into early 2025. Through 1H25, the only ETF that XHB (-5.3%) performed better than was Transports (XTN) at -6.4% with the freight and logistics turmoil that came with tariffs.
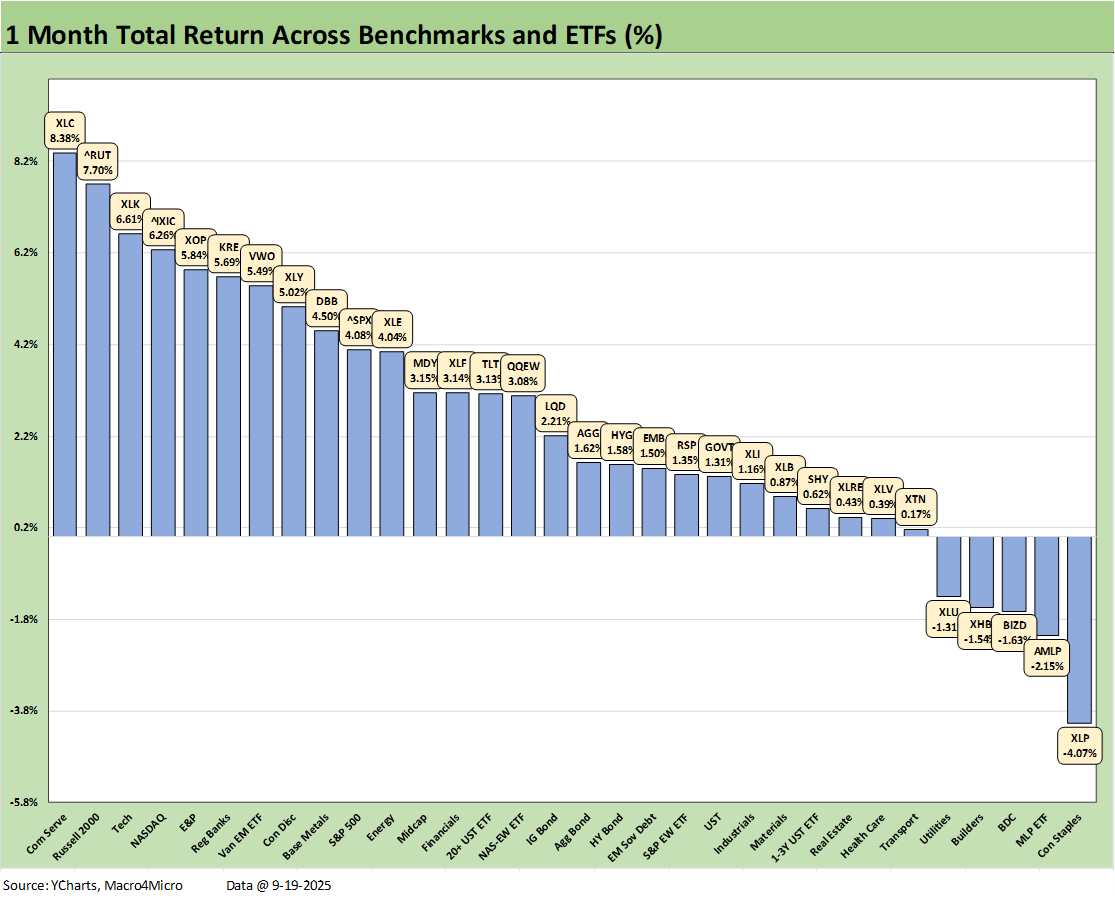
The 1-month score of 27-5 highlights the strength of tech-related or Mag 7-heavy ETFs with the small cap Russell 2000 (RUT) and Regional Banks (KRE) moving the top quartile numbers. Income-heavy (AMLP, BIZD) and more defensive names (Utilities-XLU, Consumer Staples-XLP) show up in the red the past month, but some sectors such as Utilities (XLU) have turned in strong YTD numbers with XLU in the top quartile.
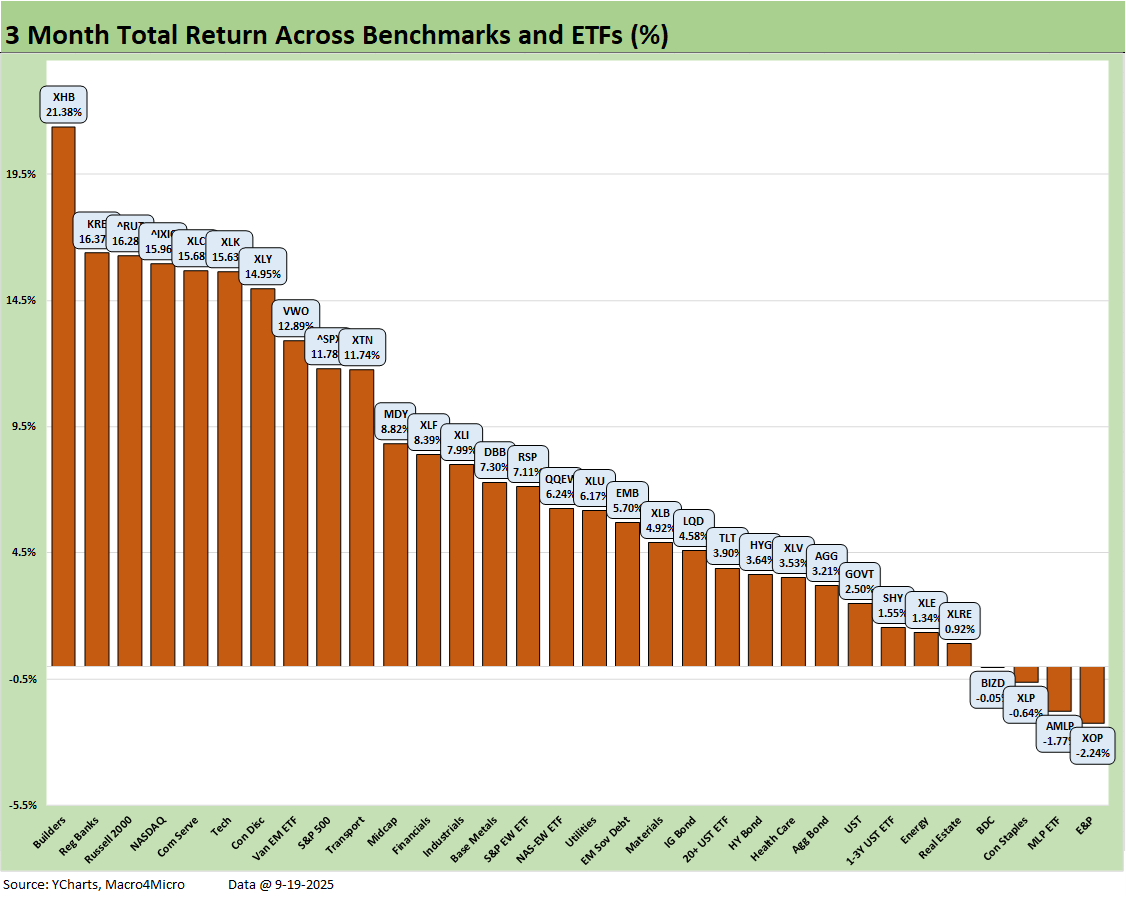
The rolling 3-month numbers at 28-4 include the “afterburn” from the post-Liberation Day rally and now a more optimistic view on where short rates are heading. We see Homebuilding (XHB) on top and E&P (XOP) on the bottom with a Hi-Lo range of 23.6 total return points. Throw out the Hi and Lo asset returns, and we still see a differential of over 18 points. That is a reminder of winners and losers in the selection and weighting process.
The 3Q25 earnings season and guidance will be a key swing factor, but the real clarity will still await 4Q25 earnings season as the SCOTUS case gets decided and the market can gauge how it might flow into the follow-through with the trade partners who were part of the “reciprocal tariff” mania. The midyear USMCA review in June 2026 also will show up in the headlines, so the trash talking with Mexico and Canada is still unclear at this point on the current tariff regime.
From a macro perspective, what might catch up and weigh on the total return run rates from here would be the worries around an ongoing slide in payrolls. The potential is there for economic softening to catch up with the struggling low quartile household earners. If consumer defensiveness then spreads up the consumer income chain, the PCE line in the GDP accounts will not get back to where it was in 2024. The PCE line in GDP is well below 2024 now with fresh a PCE update due this week in the final 2Q25 GDP numbers.
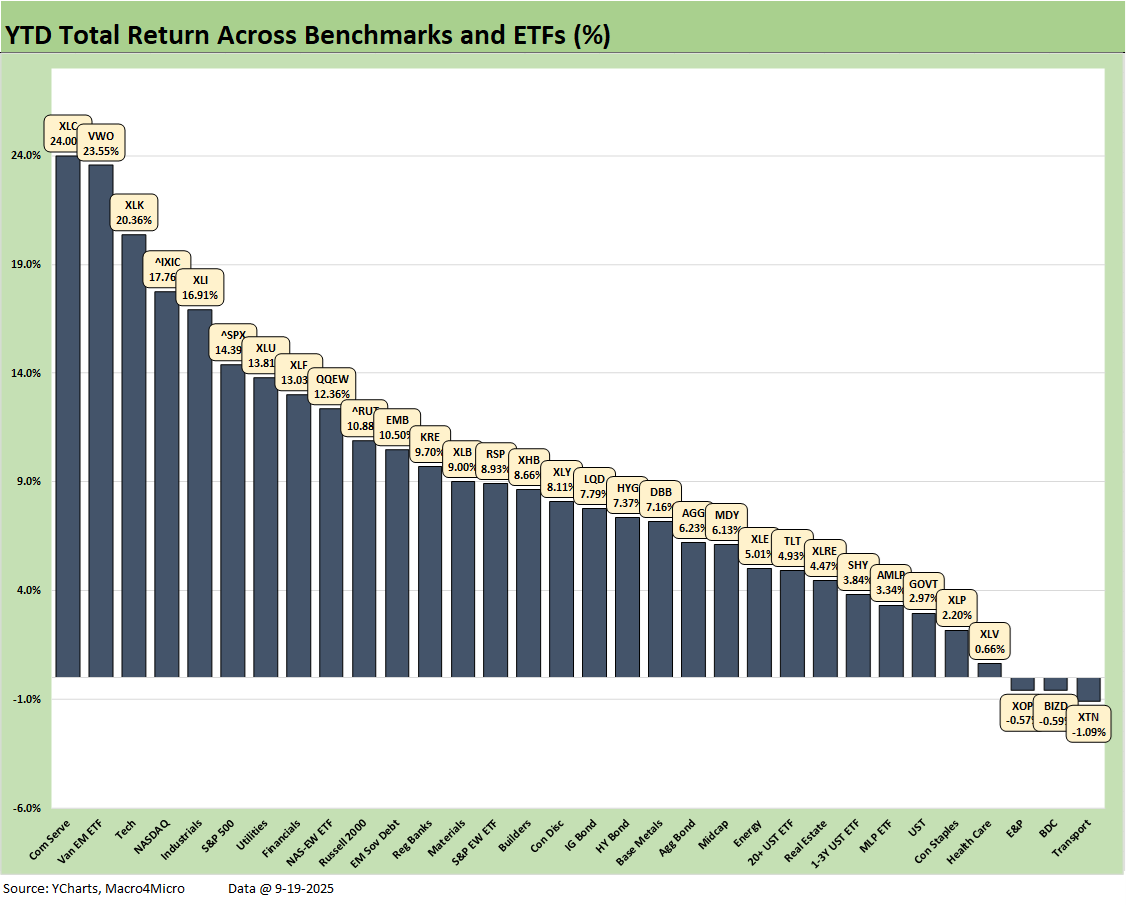
The YTD return score is 29-3, reflecting a more impressive set of numbers than we would have expected given the policy proposals. Those have dragged on in terms of implementation for months in a “death by a thousand tariffs” process. Many are only recently working their way into inventory and working capital cycles with some of the largest attacks on trade partners yet to come (e.g. pharma, semis).
In areas such as semis with such broad applications (massive in autos) and pharma an inevitable problem that will flow through to household budgets, there is still much to be fleshed out ahead.
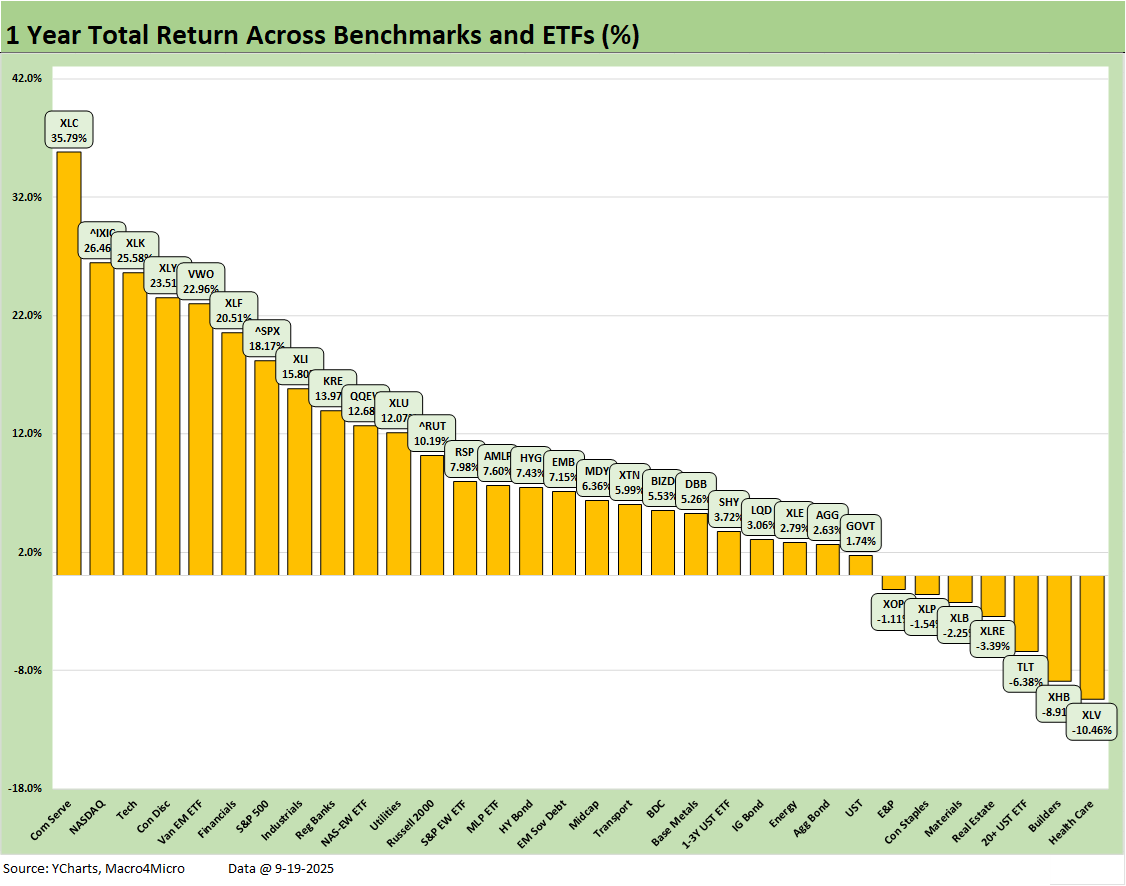
The 1-year returns stood at 25-7 this week after 28-4 last week. The Health Care ETF (XLV) once again is on the bottom, sequentially eroding to -10.5%. The long duration UST ETF (TLT) is still in the red zone at -6.4%. We see slight negative returns for Consumer Staples (XLP) and Real Estate (XLRE) given the latter’s interest rate sensitivity.
Communications Services (XLC) holds down #1 and keeps pulling away from the pack, with NASDAQ #2, the Tech ETF (XLK) at #3, Mag 7 heavy Consumer Discretionary (XLY) #4, with EM Equities VWO at #5. The top quartile is clearly more tech heavy including the S&P 500 with its company concentration, but we see Financials (XLF) and Industrials (XLI) in the top quartile with Regional Banks (KRE) just across the line.
The S&P 500 at a run rate stands at 18.2% over 1-year (14.4% YTD 2025), so the S&P 500 will need to finish 2025 in impressive fashion to move from 14.4% to 25% for the year to match the 2024 and 2023 S&P 500 returns.
The year 2024 was Part Two of the best 2-year run in the S&P 500 since the late 1990s, so that sets a high bar (see Footnotes & Flashbacks: Asset Returns for 2024 1-2-25). The S&P 500 return of +25% for 2024 (26% 2023) and more than double that for the cumulative 2 years (2023 through 2024) will be very hard to match in 2025-2026.
That market reality – combined with the recent weak job performance – undermines Trump’s theme music of “the country was dead 9 months ago.” That is, before he arrived. We would also highlight those S&P 500 numbers in 2023-2024 were generated at higher interest rates prevailing under Biden in 2023-2024 with a divided Washinton after 2022. Trump has a full GOP House and Senate combination to legislate at will.
We still vote against the recession scenario in the fall…
Recession debates continue to unfold in the markets, but we still see a recession scenario as a hard case to make in the fall. The period since the early 2020 COVID recession has not seen the US economy come close to a recession in our view. That was the case even in the fall of 2022 when many were screaming “we are in a recession now” (see Unemployment, Recessions, and the Potter Stewart Rule 10-7-22). That period had low unemployment and strong PCE numbers showing the consumer sector resilience.
The COVID recession in early 2020 came after the longest recovery in US history. In looking back at past downturns, the trigger points for recessions were often extreme, such as the late 1980 LBO leverage excess, much higher short-term rates in 1989, and the financial system crisis unfolding that lasted for a while. That period went through regional breakdowns, including the residual stress of the oil price crash in the oil patch (Texas Bank meltdown) and the thrift crisis upheavals from TX to CA, among the more notorious.
The TMT bubble after 1999 did serious damage to investors and led to an overreaction by Greenspan, which in turn set the table for a housing bubble, structured credit excess, and a counterparty derivative bender that the regulators (and Washington crowd) did not have their arms around.
As we have covered in earlier commentaries, it takes a lot to drive a recession (see Macro Menu: There is More Than “Recession” to Consider 8-5-25). There have only been two Presidents over the last 50 years who have served out their terms without a recession period – Clinton and Biden. Try to get the White House to admit that fact.
The wild economic, capital markets, and banking system issues that drove the recessions were stories unto themselves. So were the geopolitical and systemic events that contributed to those recessions. The triggers were extraordinary.
Trump could get there with a return of IEEPA and more severe clashes with trade partners since more tariff cost strains could hit corporate expense lines and generate reactions on pricing, costs, and business line changes.
Then it all needs to be factored into forward capex planning with massive gaps in the policy details and the White House practice of speeding ahead, slamming it into reverse and then driving in a demolition derby Crazy 8 pattern. They call that brilliant game theory. We don’t. In the end, it is the market and capex planners that make the call and not the political marketing players.
See also:
Mini Market Lookback: Easy Street 9-20-25
FOMC: Curve Scenarios Take Wing, Steepen for Now 9-17-25
Home Starts August 2025: Bad News for Starts 9-17-25
Industrial Production Aug 2025: Capacity Utilization 9-16-25
Retail Sales Aug 2025: Resilience with Fraying Edges 9-16-25
Credit Markets: Quality Spread Compression Continues 9-14-25
The Curve: FOMC Balancing Act 9-14-25
Footnotes & Flashbacks: Asset Returns 9-14-25
Mini Market Lookback: Ugly Week in America, Mild in Markets 9-13-25
CPI August 2025: Slow Burn or Fleeting Adjustment? 9-11-25
PPI Aug 2025: For my next trick… 9-10-25
Mini Market Lookback: Job Trends Worst Since COVID 9-6-25
Payrolls Aug 2025: Into the Weeds 9-5-25
Employment August 2025: Payroll Flight 9-5-25
JOLTS July 2025: Job Market Softening, Not Retrenching 9-3-25
Hertz Update: Viable Balance Sheet a Long Way Off 9-3-25
Mini Market Lookback: Tariffs Back on Front Burner 8-30-25