
Market Lookback: Last Call for Unusual Behavior
The last full trading week signals a banner year for the S&P 500 and NASDAQ but still falls short of the 2024 and 2023 total return performance.


USMCA policy planning committee for 2026
The markets had a relatively uneventful week by recent standards with spreads making minimal moves, the UST curve making a modest shift lower, and tech bellwethers putting up a good mix of positive numbers. The S&P 500 posted 6 negative and 5 positive across the 11 sectors.
The last full week of trading in 2025 heads toward the next year with a lot of uncertainty around inflation and payroll resilience. In 2025, the top down policy framework moved from unpredictable to erratic and then into inconsistent and then what many would say (including us) became economically incoherent (“seller pays”).
We enter the new year with more items on the list of policy challenges, including the ACA premium shocks. Meanwhile the IEEPA SCOTUS decision and the USMCA review lurk, and the undeclared war on the EU by the White House is getting nastier.
We get a read on 3Q25 GDP this week, but the calendar remains quiet in the home stretch.
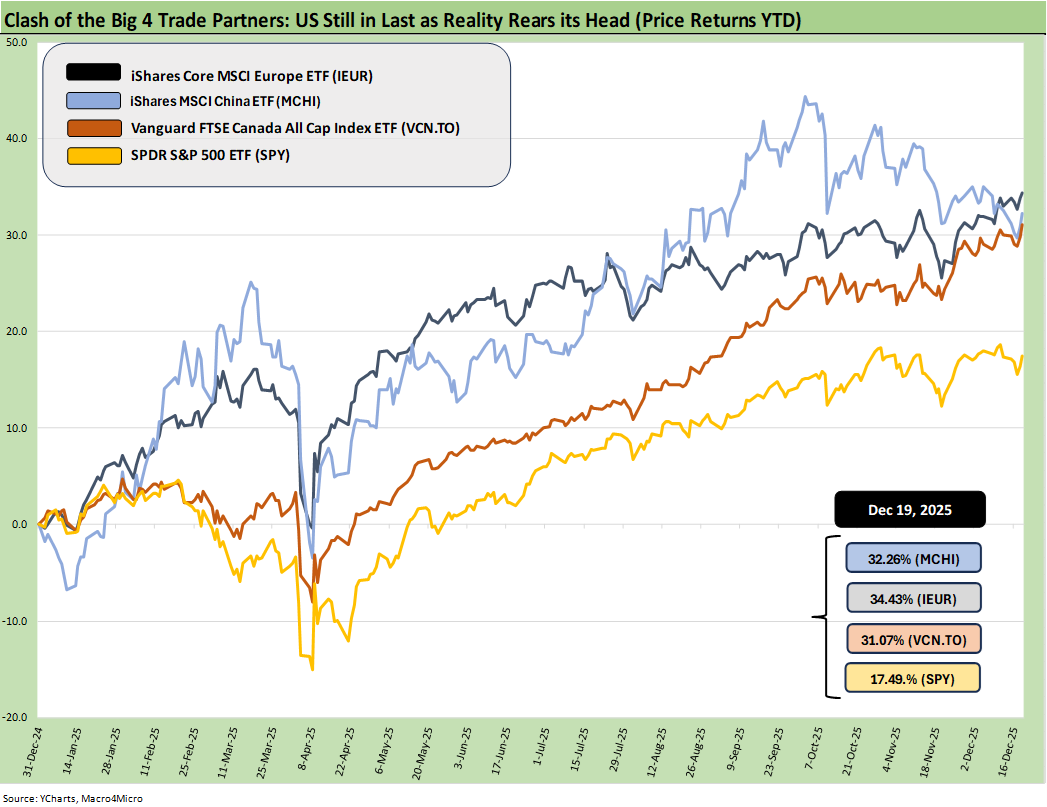
The above chart updates the YTD returns for the Big 4 trading partner benchmarks that we update each week. The weak dollar remains the big story for the comparative performance with the US in last place behind Europe at #1, China at #2, Canada #3 and the US a distant #4. That falls a bit short of a Golden Year moment in the bigger picture of fundamental performance, currency risks, and how that all ties into the macro picture for 2026
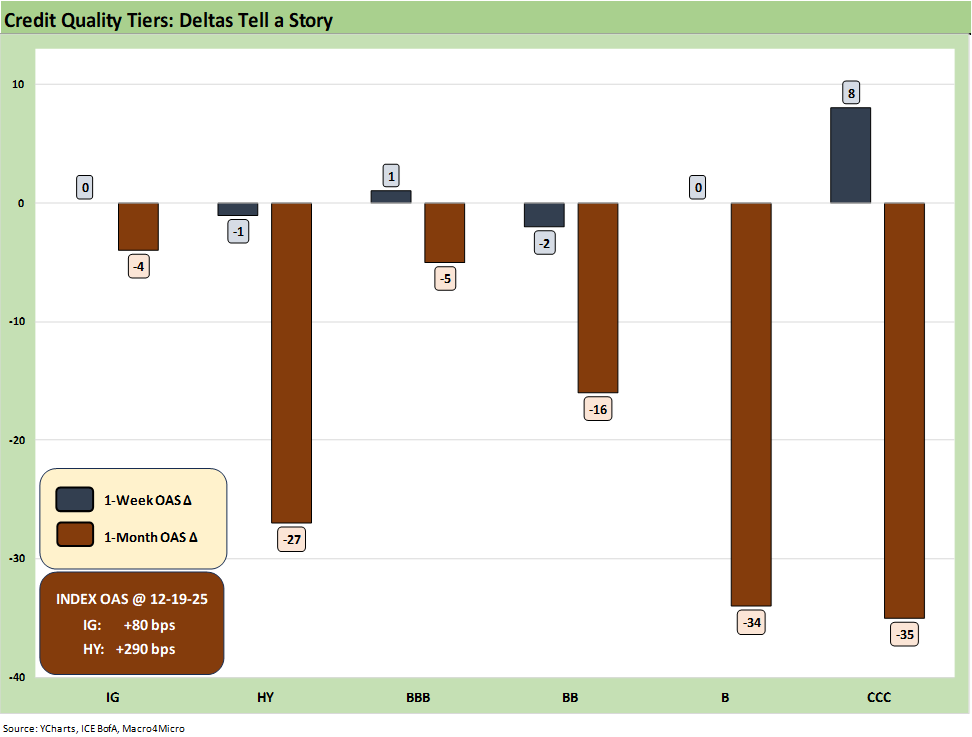
.The above chart updates the spread delta for 1-week and 1-month for IG and HY and for the BBB tier down to CCC tier. We see a very benign week with more action in HY for the trailing 1-month at -27 bps. HY credit spreads wind down 2025 back in the June 2007 range when the credit bubble was in place. The +80 bps for IG OAS is in line with the past credit cycle peaks
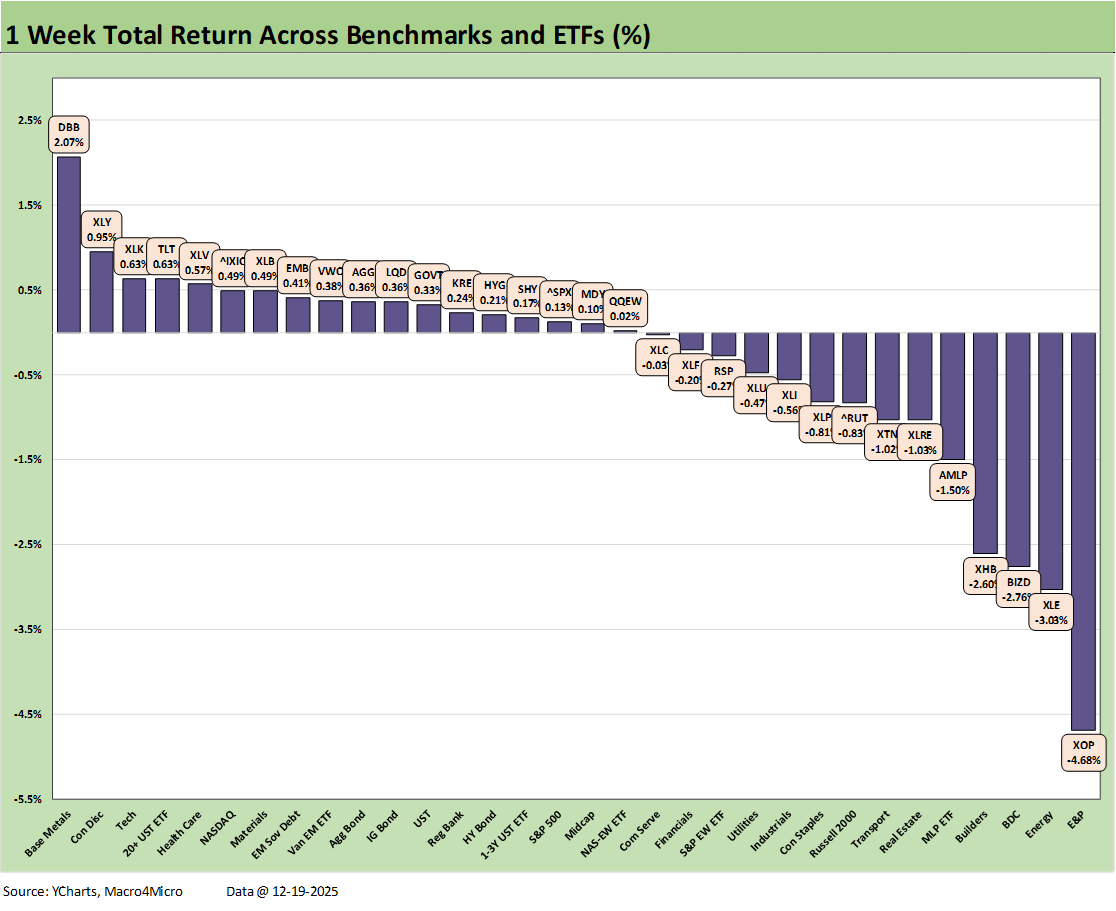
.The 1-week returns weighed in at 18-14 with the bookend outliers being Base Metals (DBB) at #1 and the E&P ETF (XOP) in last place. The major benchmarks were spread around with the NASDAQ in the top quartile, the S&P 500 and Midcaps straddling the dividing line of the 2nd and 3rd quartile, and the Russell 2000 small caps at the top of the low quartile.
All the bond ETFs were positive with the long duration UST ETF (TLT) placed in the top 5 with EM Sovereign ETF (EMB) also in the top quartile. The short UST ETF (SHY) was in the bottom of the 7 bond ETFs just below HYG.
Energy is struggling on soft oil prices with E&P (XOP), Energy (XLE) and Midstream (AMLP) in the bottom 5. That should not be mistaken for low Energy inflation in the CPI, however, given high electricity and piped utility gas inflation (see November CPI: Tricky Navigation 12-18-25)
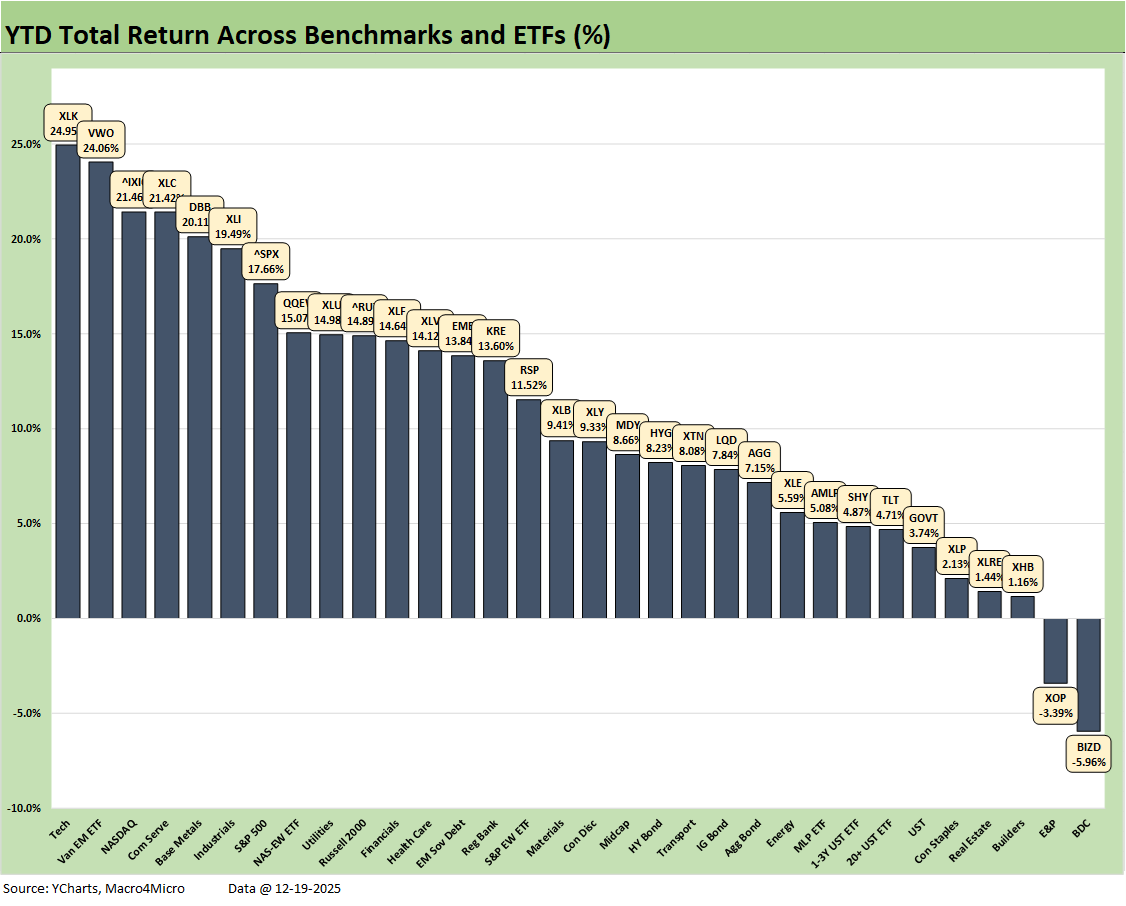
.The above chart updates the YTD performance of the 32 benchmarks and ETFs, and we see an impressive score of 30-2. The BDC ETF (BIZD) and E&P ETF (XOP) are the only lines in the red.
The top quartile boasts 5 tech-heavy lines with the Tech ETF (XLK) at #1, NASDAQ at #3, Communications Services (XLC) at #4, the S&P 500 with its heavy tech weighting at #7 and the Equal Weight NASDAQ 100 (QQEW) at #8. The China-heavy EM Equity ETF (VWO) held down #2 on the currency performance with the copper-heavy Base Metals ETF (DBB) and Industrials (XLI) in the top quartile.
All the bond ETFs are positive, but we see 3 of the 7 bond ETFs (GOVT, TLT, SHY) in the bottom quartile joined by some interest rate sensitive equities such as Homebuilders (XHB), Real Estate (XLRE), and the dividend-heavy Consumer Staples ETF (XLP)
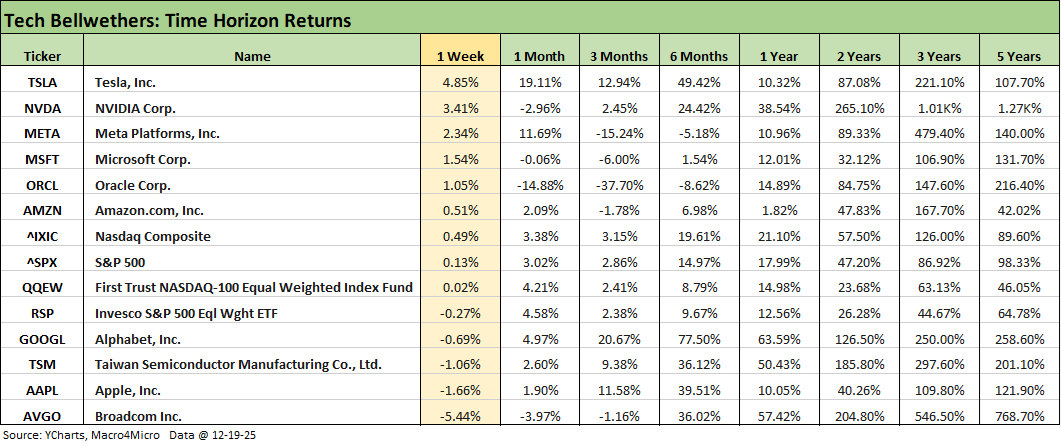
.The tech bellwethers had a decent week than in recent context. We see 5 of the Mag 7 ahead of the S&P 500 in positive range with Tesla and NVIDIA leading the pack. We saw 2 of the Mag 7 (Apple, Alphabet) in the red. Broadcom struggled in last place while Oracle got some relief after TikTok

.The 1-week UST deltas are broken out above. On the way into 2026, we will keep seeing the 10Y and 30Y UST wrestling with the inflation question as well as the potential for more turmoil in payrolls.
The 3Q25 GDP line items this week might shed some more light on the personal consumption expenditures line (PCE) for goods and services while fixed investment line trends will offer color on the AI boom and tailwinds from the tax bill.
When it comes to headline GDP, making adjustments for swings in net trade flows and inventory investment will be a crucial part of framing the growth number under the distorted headlines (see 2Q25 GDP Final Estimate: Big Upward Revision 9-25-25, 2Q25 GDP: Second Estimate, Updated Distortion Lines 8-28-25, 2Q25 GDP: First Cut of Another Distorted Quarter 7-30-25)

.The YTD UST deltas are updated above. The deltas present a bull steepener that will be very hard to replicate in 2026 without a lot of macro setbacks (see The Curve 12-15-25). The challenges on the long end with the 30Y has been getting a lot of press on a global scale with Japanese bond highlights and supply-demand imbalances a big part of the equation. Getting the 10Y UST into a place that supports long term mortgages remains an “odds-against” proposition at this point. We still expect a 3M to 10Y steepening in 2026

.The above chart updates the 10Y UST plotted against the Freddie Mac 30Y mortgage benchmark. The time series offers a reminder of the wild ride for mortgages since the ZIRP period of 2021. The run-up in mortgages and the 10Y UST from Sept 2024 through early 2025 is a sobering visual for the “FOMC eases and mortgages follow” crowd. The mix of steepener and flattener moves have been tricky
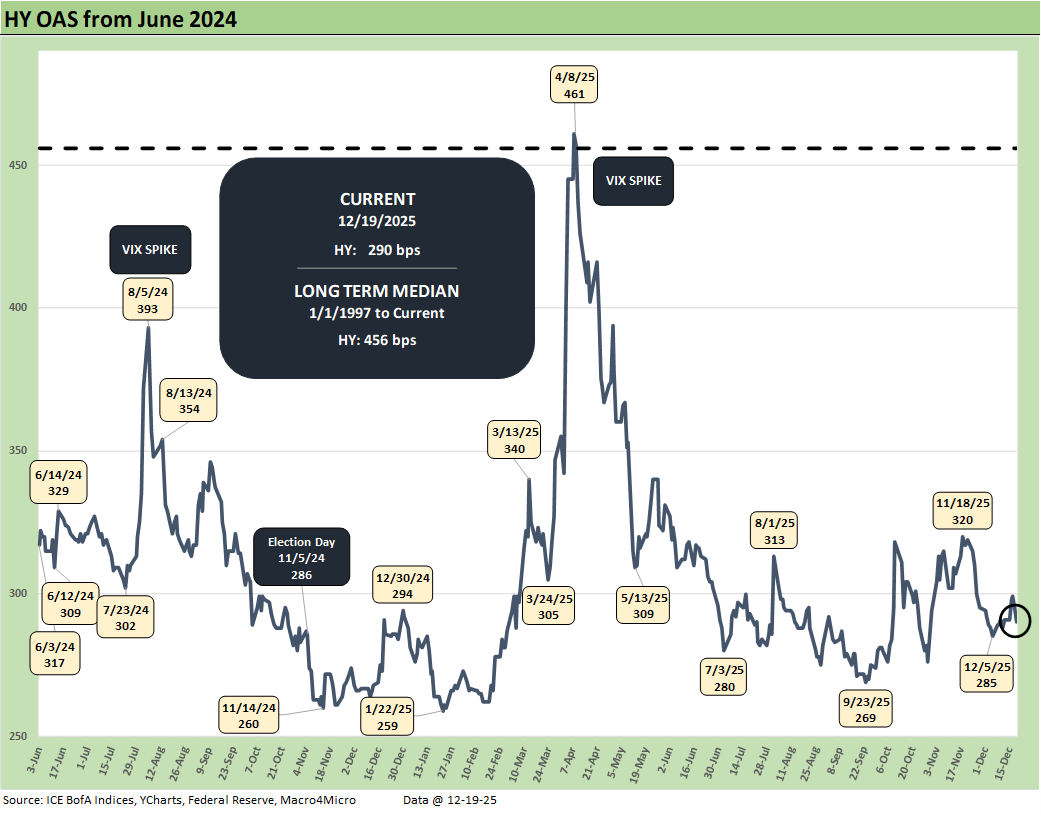
.HY ticked -1 bps tighter in a very quiet week for spreads.

The “HY OAS minus IG OAS’” quality spread differential narrowed by -1 bps with HY -1 bps tighter and IG OAS flat.

The “BB OAS minus BBB OAS” quality spread differential narrowed by -3 bps with BBs -2 bps tighter and BBBs +1 wider.
See also:
Existing Home Sales Nov 2025 12-21-25
November CPI: Tricky Navigation 12-18-25
Payrolls Nov 25: Into the Weeds 12-16-25
Employment Nov 2025: Bad News is Bad News 12-16-25
The Curve 12-15-25
Market Commentary: Asset Returns 12-14-25
Market Lookback: FOMC Fragments, Rate Debates Murky 12-13-25
FOMC: Dot Plot Scatters for 2026 12-10-25
Employment Cost Index 3Q25: Slowing but Above CPI 12-10-25
JOLTS: Goldilocks’ Ugly Twin 12-9-25
Mini Market Lookback: Data Digestion 12-6-25
PCE, Income & Outlays: Calendar Gap Closing 12-5-25
Credit Markets 12-1-25
Mini Market Lookback: Back into the June 2007 Zone 11-29-25
Durable Goods Sep 2025: Quiet Broadening of Core Capex 11-26-25
Retail Sales September 2025: Foot off the Gas 11-25-25
The Curve: Flying Blind? 11-24-25
Mini Market Lookback: FOMC Countdown 11-23-25
Employment Sept 2025: In Data We Trust 11-20-25
Payrolls Sep25: Into the Weeds 11-20-25
Mini Market Lookback: Tariff Policy Shift Tells an Obvious Story 11-15-25
Retail Gasoline Prices: Biblical Power to Control Global Commodities 11-13-25
Simplifying the Affordability Question 11-11-25
Mini Market Lookback: All that Glitters… 11-8-25
Mini Market Lookback: Not Quite Magnificent Week 11-1-25
Synchrony: Credit Card Bellwether 10-30-25
Existing Home Sales Sept 2025: Staying in a Tight Range 10-26-25
Mini Market Lookback: Absence of Bad News Reigns 10-25-25
CPI September 2025: Headline Up, Core Down 10-24-25
General Motors Update: Same Ride, Smooth Enough 10-23-25
Mini Market Lookback: Healthy Banks, Mixed Economy, Poor Governance 10-18-25
Mini Market Lookback: Event Risk Revisited 10-11-25
Credit Profile: General Motors and GM Financial 10-9-25