
Employment Cost Index 3Q25: Slowing but Above CPI
The decline in the ECI eases some cost pressure on employers but undermines the theme of relatively favorable worker wage trends.

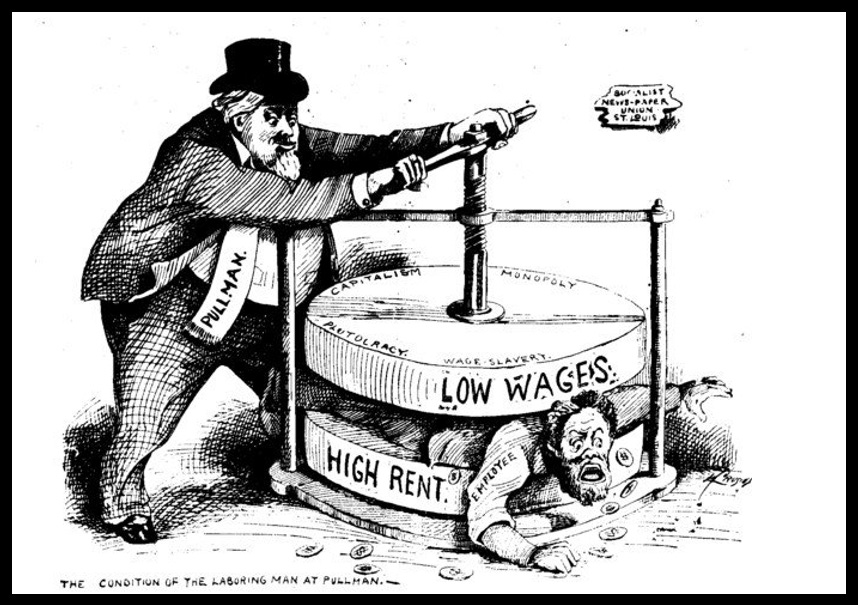
Don’t worry! I got your back on affordability!
At +3.5% YoY, the latest quarterly Employment Cost Index (“ECI”) report shows the ECI moving lower sequentially from 2Q25 at 3.6% and from Sept 2024 at +3.9%. That complicates the affordability debate and Trump’s “Happy Days are Here Again” roadshow. (Simplifying the Affordability Question 11-11-25).
The +3.5% wage rate comes alongside stubborn inflation including 3% handle inflation for total Food in the Sept CPI report and rising YoY inflation for Food and Energy in the most recent PCE report (see PCE, Income & Outlays: Calendar Gap Closing 12-5-25, CPI September 2025: Headline Up, Core Down 10-24-25). Purchasing power has declined in many areas even with wages rising.
In one of the lesser Jedi Mind Tricks of our time, the fixation on national retail gasoline prices gets a lot of air time (see Retail Gasoline Prices: Biblical Power to Control Global Commodities 11-13-25). We heard this again on Trump’s speech circuit last night with the magic “$1.99 per gallon” fantasy. As we ego to print, the AAA index price nationally is $2.94, down from $3.00 a week ago.
Crude oil volatility is largely outside the control of White House policy other than any effort to let Russian supply loose and throw Ukraine under the tank. The focus on gasoline is part of the effort to pretend that electricity inflation (+5.1% in Sept CPI) and Utility Piped Gas (+11.7% in Sept CPI) are not part of the affordability challenge. Pretending Putin did not have the dominant role in the spike in oil, gas, and gasoline in 2022 requires a suspension of disbelief.
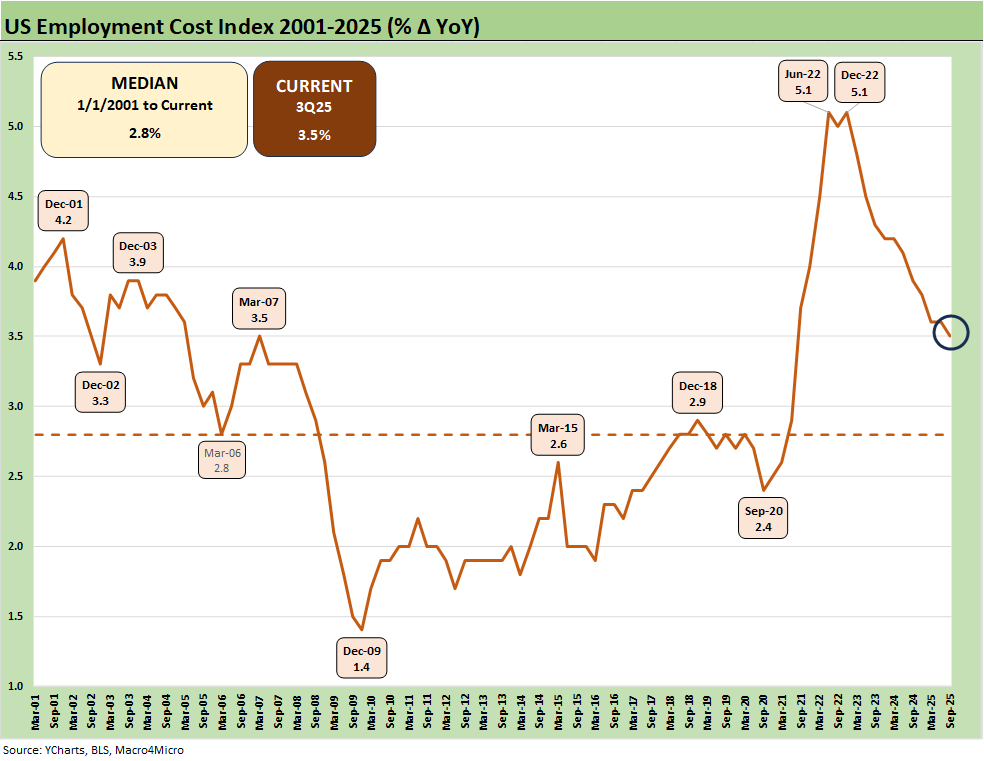
The time series for ECI is plotted above, and the post-COVID spike is clear enough as the ECI shot up to the 5% handle zone. The great reopening made for good supply-demand dynamics for labor.
The current compensation growth lines for workers are in fact trending down across the past year and sharply from 2022, so of course Trump cited them as going higher in his rally speech last night. Absolute wages are “higher” (as are consumer prices), but the rate of wage/compensation growth is slowing while many consumer lines are seeing inflation rise. Headline CPI was in fact higher in Sept 2025 than Dec 2024 (see Simplifying the Affordability Question 11-11-25).
For the rolling 3 months, the rate ticked down for civilian wages from +1.0 to +0.8%. The 12-month YoY rate is at +3.5% which is down from +3.9% in 3Q24.
The ECI release has many angles on total comp, wages, and benefits. For example, state and local government workers were down to 3.5% for wages vs. 4.6% in 3Q24. Private industry wages were +3.6% in 3Q25 vs. +3.8% in 3Q24. That means a “lower” rate of increase – not higher.
You could argue that the recent set of numbers in ECI help the FOMC story on pricing pressure (tariffs are still the main event), but it does not tell a good story about worker’s affordability challenges.
In last night’s speech, Trump again cited Trump 1.0 as the greatest economy in US history and anywhere in the history of the world. That one never gets old (see Presidential GDP Dance Off: Clinton vs. Trump 7-27-24, Presidential GDP Dance Off: Reagan vs. Trump 7-27-24). Once again, he cited his view that “prices were down” despite positive inflation. That is unusual math. He tends to use the 2022 inflation spike as his starting point when Dec 2024 (or Jan 2025) is where he came in.
Wages battle inflation…
Meanwhile, inflation is trending higher since Dec 2024 for Food and Energy as the two lines most experienced by households on a daily basis. The political risk tied to food and energy is high, and the White House is scrambling to take pressure off with tariff revisions (notably such lines as coffee and beef). That will ease consumer pain but also put the lie to the cornerstone of Trump’s tariff pitch – the “seller pays.”
With energy, focusing just on gasoline is a sleight of hand for consumers to remember when they pay the electric or gas bill. Crude oil is biased lower, but Sept gasoline deflation was lower than the deflation of Dec 2024 in Biden’s last full month. In the end, most expect oil and gasoline to keep moving lower on supply/demand balance for crude.
As we cover in our employment commentaries, the moving parts of supply and demand for labor are shifting again with mass deportation in a slowing economy. That slowing has been concentrated in the Personal Consumption Expenditure lines and Fixed Investment even if Bessent at al. like to play games with the distortion of import/export lines and changes in inventory in the “year of tariffs” (see 2Q25 GDP Final Estimate: Big Upward Revision 9-25-25, 2Q25 GDP: First Cut of Another Distorted Quarter 7-23-25). We await the first 3Q25 GDP data to arrive on Dec 23rd).
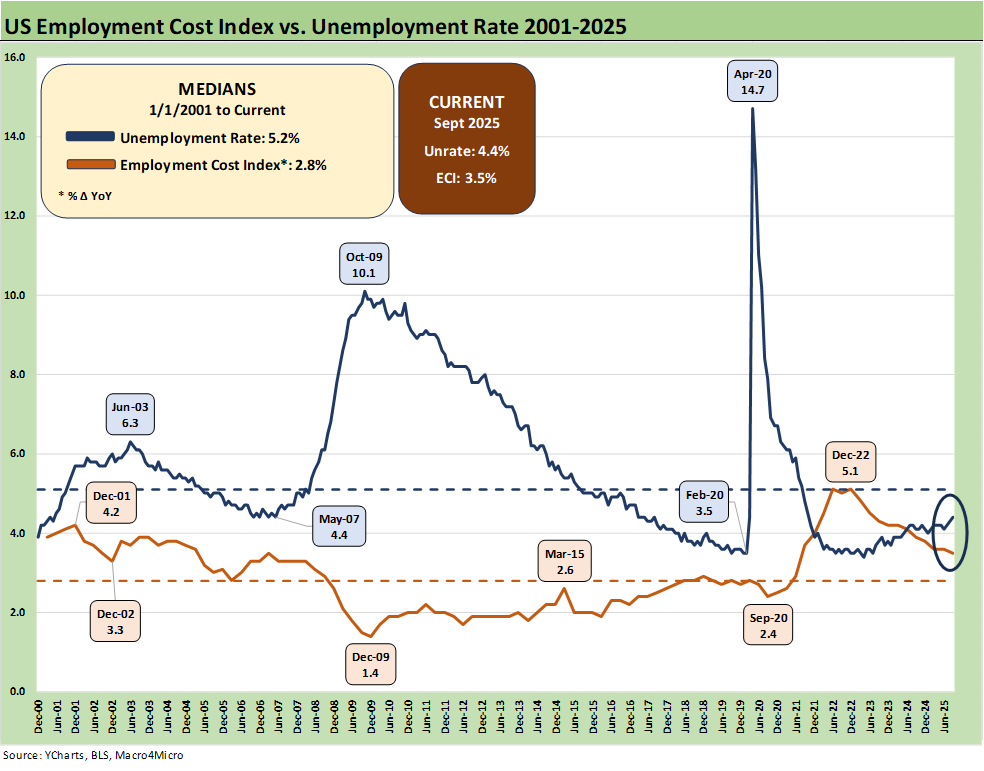
The above updates the ECI vs. unemployment rates. The relationship is fairly obvious but also highlights how COVID is in a world of its own with the pent-up demand factor for labor as well as goods and services. The current ECI of 3.5% is well above the long-term median of 2.8% (from 2000).
See also:
PCE, Income & Outlays: Calendar Gap Closing 12-5-25
Retail Gasoline Prices: Biblical Power to Control Global Commodities 11-13-25
Simplifying the Affordability Question 11-11-25
CPI September 2025: Headline Up, Core Down 10-24-25
Inflation: The Grocery Price Thing vs. Energy 12-16-24
Presidential GDP Dance Off: Clinton vs. Trump 7-27-24
Presidential GDP Dance Off: Reagan vs. Trump 7-27-24).
Inflation Timelines: Cyclical Histories, Key CPI Buckets11-20-23
Savings Rates: Context Across the Cycles 10-27-23).
Past ECI commentaries:
Employment Cost Index 2Q25: Labor in Quiet Mode 7-31-25
Employment Cost Index 1Q25: Labor is Not the Main Worry 5-1-25
Employment Cost Index 4Q24: Labor Crossroad Dead Ahead 1-31-25
Employment Cost Index Sept 2024: Positive Trend 10-31-24
The Employment Cost Index June 2024 8-1-24
Employment Cost Index March 2024: Sticky is as Sticky Does 4-30-24
Employment Cost Index Dec 2023: Compensation Mixed Picture 1-31-24
Employment Cost Index Sept 2023: Expect the Expected 10-31-23
Employment Cost Index: Rings of the Redwood 7-28-23
Employment Cost Index: Slow Motion 4-28-23
Employment Cost Index: Labor vs. Capital …Tide Turning or Swirling? 2-1-23