
JOLTS: Goldilocks' Ugly Twin
The growth bulls and the mega-easing, bull-flattener advocates likely came away feeling underwhelmed by the signals in JOLTS.


Maybe I should get highlights?
The JOLTS brought the flavor of not-too-hot and not-too-cold, but the market was likely looking for a more clarifying set of metrics than what they got.
Next at bat this week is the FOMC decision tomorrow with the SEP and dot plot. The forecasts will allow more “Fed types” to show their hands on what indicators they relied on and how the soft payroll signs trade off against the stubborn inflation.
For JOLTS MoM from Sept, the trend shows openings essentially flat (+12K), but hires were down sharply (-218K), layoffs/discharges were higher (+73K), and quits were down (-187K), which some say signals lower confidence.
For JOLTS on a YoY basis from Oct 2024, openings were up modestly (+55K), hires were down markedly (-201K), layoffs/discharges were higher (+66K), and quits were down (-276K).
Layoffs and discharges were higher in 3 of 4 regions for MoM and YoY. Hires were down in all 4 region MoM while YoY hires show increases in 3 of 4 but a major decline in the South as the largest region.
While the JOLTS data is not flashing signs of major setbacks in payrolls, employment trends are clearly soft in overall context. The hiring and layoff deltas carry the day as a net negative for the JOLTS report even if job openings are bringing some balanced news. The JOLTS release comes at a 1-month lag, so we look to the upcoming payroll release for a more timely read on how the job market played out in November and along the various occupation lines.
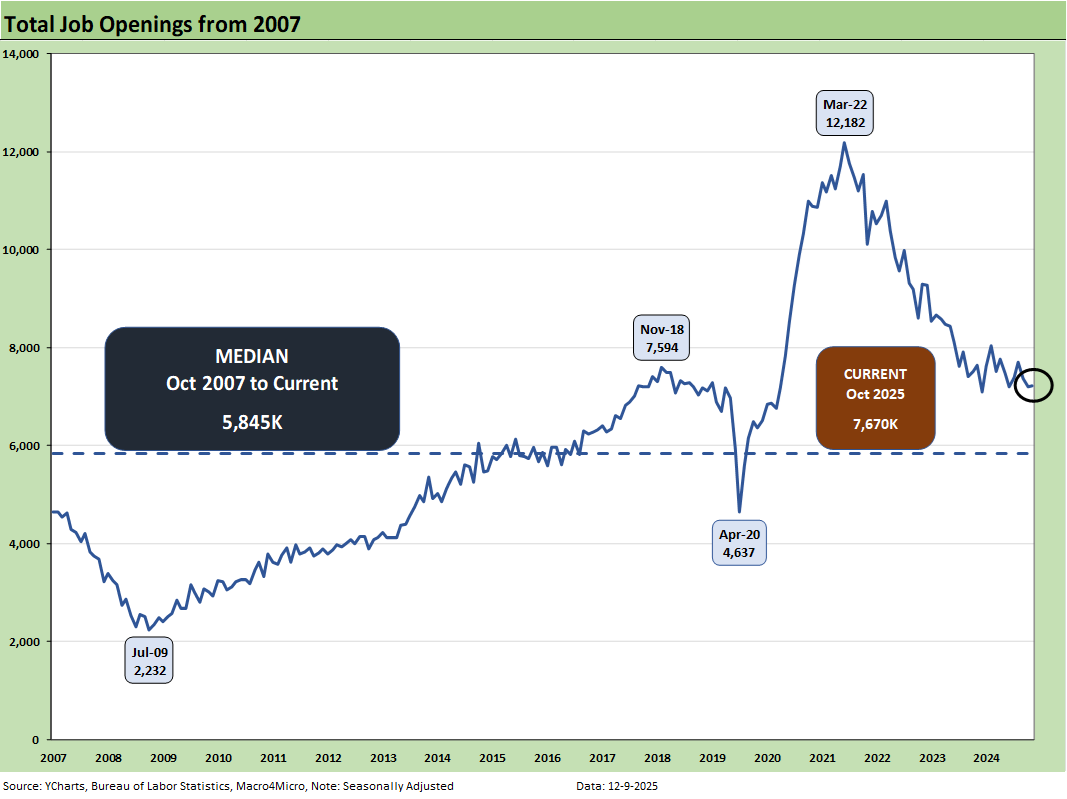
The 7.67 million in openings is up fractionally YoY by less than 1% YoY (+55K) from 7.62 million in Oct 2024 but well above the long-term median of around 5.85 million. That 7.67 million in openings for Oct 2025 is just above the Sept tally of 7.66 mn and more meaningfully above the Aug 2025 count of 7.2 million.
The shutdown challenge left the market in the lurch on data and came on the heels of Trump’s firing of the BLS head. His subsequent nomination of a highly inexperienced ideologue with “questionable” credentials is no longer under consideration. The candidate’s name was withdrawn by the White House (see Happiness is Doing Your Own Report Card 8-1-25).
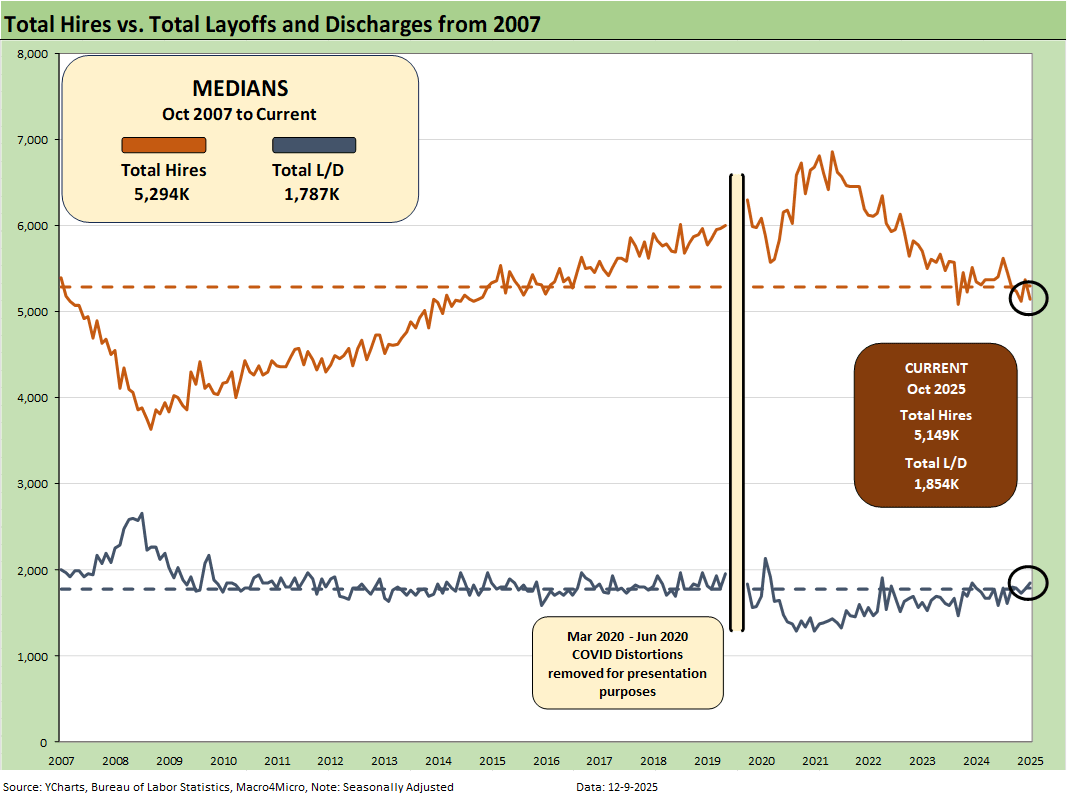
The above chart plots Hires vs. Layoff/Discharges on a SAAR basis. Note: we remove the COVID numbers from several charts to support the visual value for “normal” periods. For COVID distortions, see note at the end of the article. We note the MoM and YoY Hires and Layoffs trends in the bullets at the top of this piece.
Hires declined by -218K sequentially from Sept to October while layoffs/discharges rose by +73K. The hires YoY declined by -201K. Meanwhile, layoffs/discharges YoY rose by 66K. It is hard to see lower hires and higher layoffs as anything other than a negative payroll signal. Claiming enhanced productivity will get old quickly for the half-full crowd since it all adds up to less paychecks.
The biggest declines in Hires for Oct 2025 occurred in Health Care and Social Assistance and Leisure and Hospitality. The biggest increase in layoffs was Leisure and Hospitality. Notably, Construction saw a major decline in layoffs.
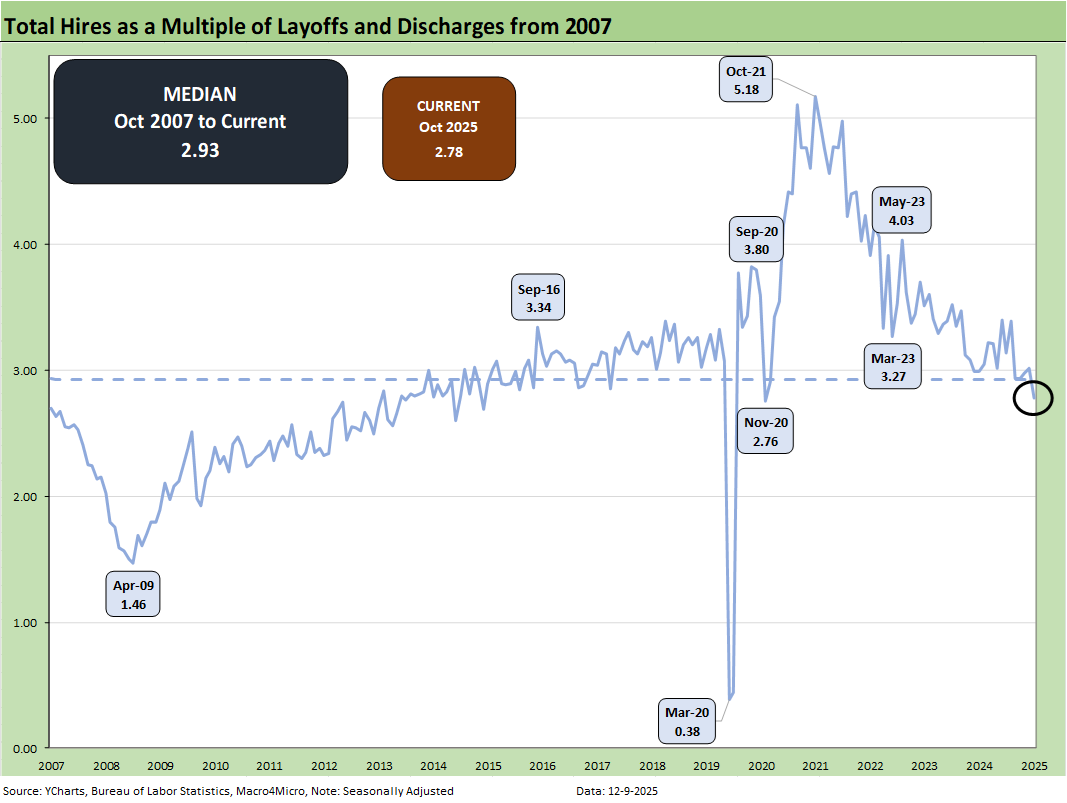
The above chart updates the ratio of Hires to Layoffs/Discharges. The relationship moved lower this month from 2.97 to 2.78, or just below the long-term median of 2.93 from 2007. The post-2007 period includes the longest recession since the Great Depression (Dec 2007 – June 2009) followed by the longest expansion from June 2009 to COVID (Feb 2020).
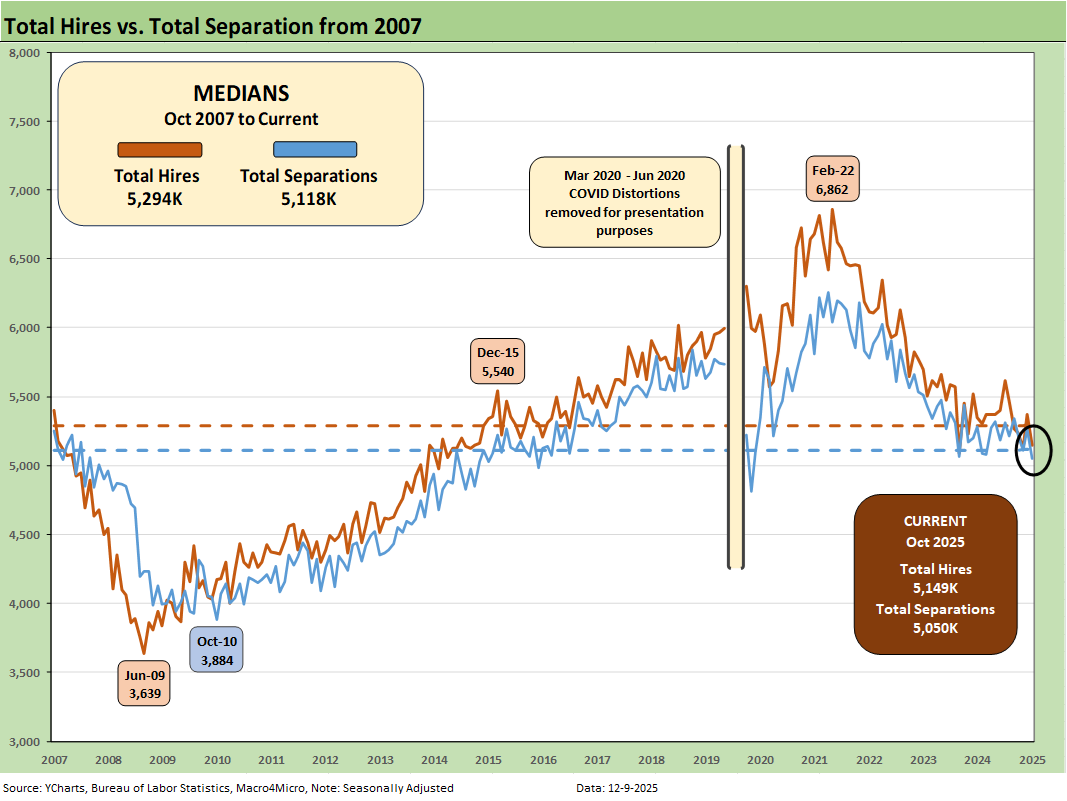
The above chart plots Hires vs. Total Separations on a SAAR basis. Separations include Quits, Layoffs/Discharges, and “Other Separations.” Total Separations were lower by -214K MoM (-4.1%) sequentially and down by -235K YoY (-4.5%) YoY. We typically do not find “Total Separations” particularly interesting as a multi-line net number.
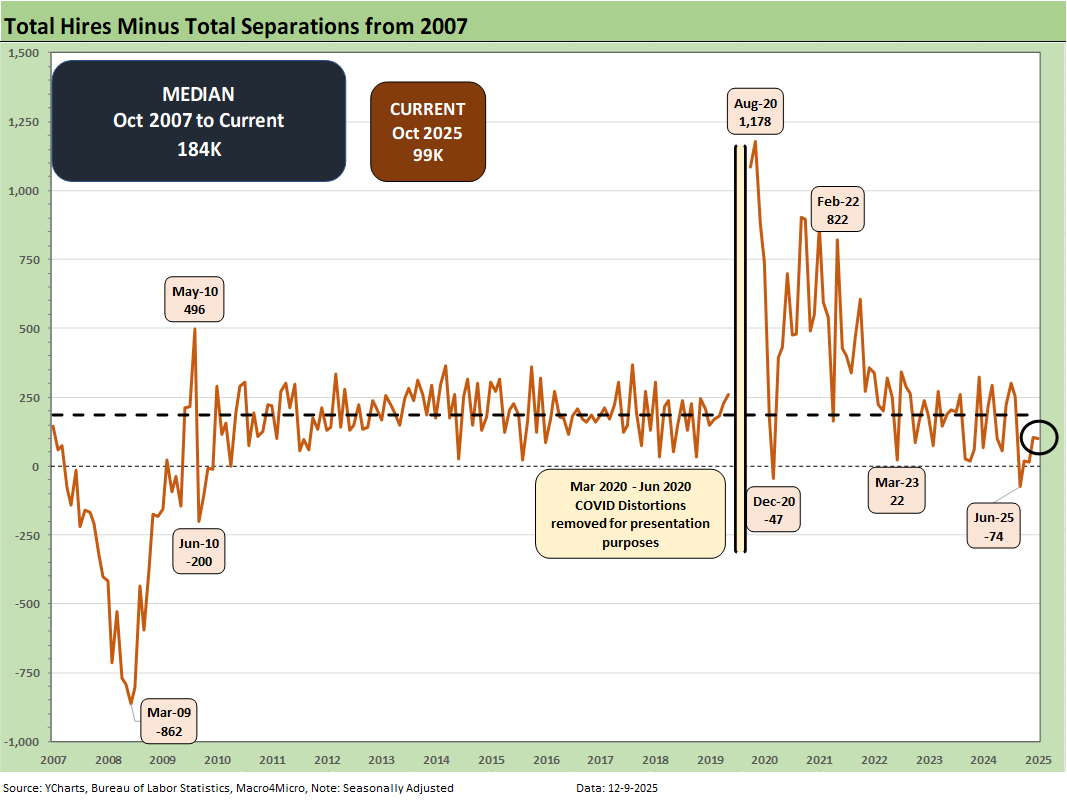
The Hires minus Total Separations differential is plotted above. We recently had some major revisions. Layoffs/Discharges for June had been revised upward by 192K, so that offers another negative data point in payroll. The net number above has moved notably lower in recent months before the bounce back to 99k. The differential is well below the long-term median of +184K. The current differential is a weak number.
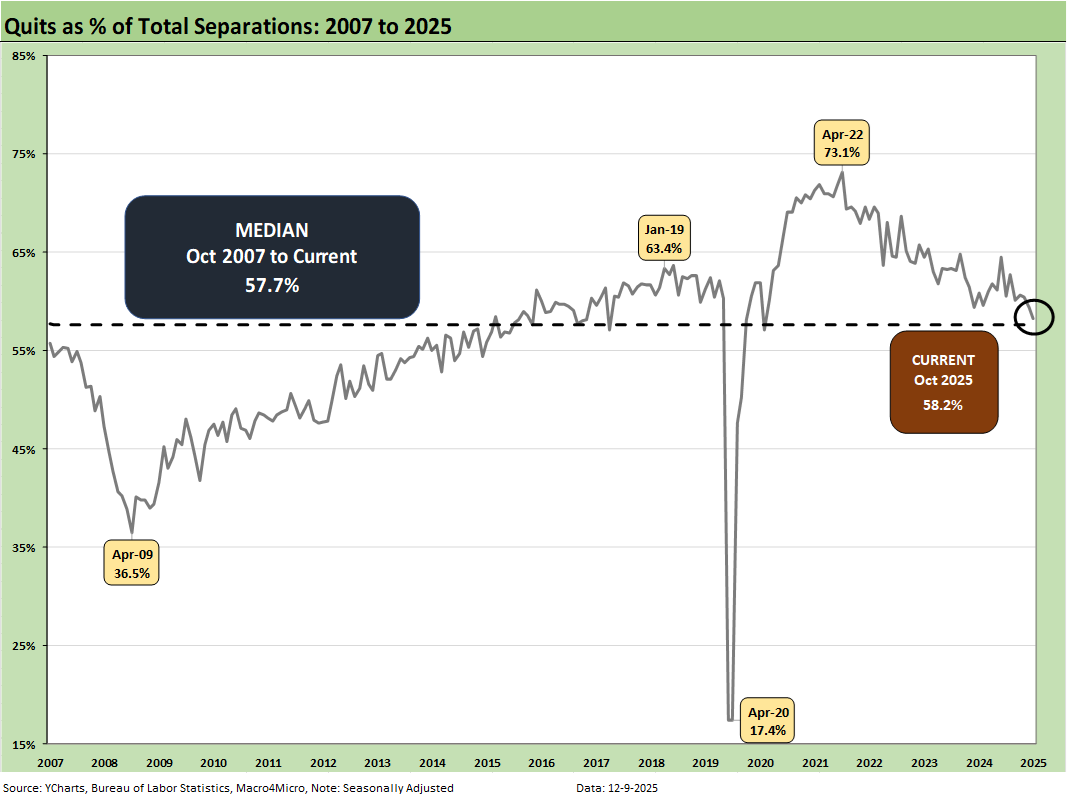
The time series for Total Quits as a % of Separations (SAAR basis) moved lower MoM to 58.2% from 60.5% and is above the long-term median of 57.7%. The classic “Quits Rate” is measured by Total Quits as a % Total Employment, and that metric moved lower on the month to +1.8%, down from 2.0%. The Quits rate is down slightly YoY from 2.0% to 1.8%.
The bottom line on JOLTS is that it continues the steady stream of signals that point to a softening economy that is likely to arm the FOMC with more easing ammo but only if they get more comfort around tariffs and the price impact on goods. So far, CPI and PCE has not been cooperating (see PCE, Income & Outlays: Calendar Gap Closing 12-5-25, CPI September 2025: Headline Up, Core Down 10-24-25).