
Mini Market Lookback: Data Digestion 12-6-25
The market is teed up for a steady flow of late and current data the next two weeks, but the FOMC color will be the main event.


Affordability problem? What health care premium crisis?
The past week saw bonds unhappy and equities feeling the FOMC love for more easing. The S&P 500 neared a record while the small cap Russell 2000 hit all time highs despite some mixed color on payrolls. ADP offered some ugly small business payroll pressures while initial claims yawned. Markets do not set their sundial by the Challenger report, but the collection of data from that source used terms like “worst since 2020.”
The equity markets are looking past consumer threats for now and there are plenty of company level and macro level inputs to support the idea of a resilient consumer even if weaker now than at the beginning of 2025. The recent retail earnings wave and the Sept PCE income and outlays data was supportive of the “I’m not dead yet” theory on the consumer. That said, it has not been a clean bill of health and especially for the low quartile consumer.
The payroll risk is generally seen as the key trigger point for a -25 bps cut from the FOMC (Dec 9-10), but the payroll worries will need to get more visibility in more timely releases to make a stronger case for a January cut with inflation data not cooperating. The market will get some mainstream BLS data this week with JOLTs and the 3Q25 Employment Cost Index with the November job numbers the following week. We will also finally get some 3Q25 GDP data before Christmas.
The latest headline and core PCE numbers looked like nonevents, but the release included numerous inflation lines (Food, Energy, Goods) that were hitting YoY highs for calendar 2025. The misinformation and rage-tweets from the White House are getting more shrill and numbers are never cited with the exception of the “Loch Ness” retail gasoline price of $1.99 per gallon (cited this morning on Truth Social) when the AAA national retail price is $2.96 per gallon today (see PCE, Income & Outlays: Calendar Gap Closing 12-5-25, Simplifying the Affordability Question 11-11-25, CPI September 2025: Headline Up, Core Down 10-24-25).
For the markets this past week, we saw Russell 2000 small caps hit a record while the S&P 500 came close. For now, the YTD S&P 500 total return looks to fall short of the back-to-back returns of over 25% in 2023 and 2024. Bonds felt the effects of the adverse UST move this past week, but spreads were tighter in both IG and HY with HY moving further into the June 2007 (“bubble month”) range at +285 bps. The IG index is inside the +80 bps line while the BB tier is well inside +200 bps at +173. The B tier is inside the +300 bps line. That is a frothy collection.
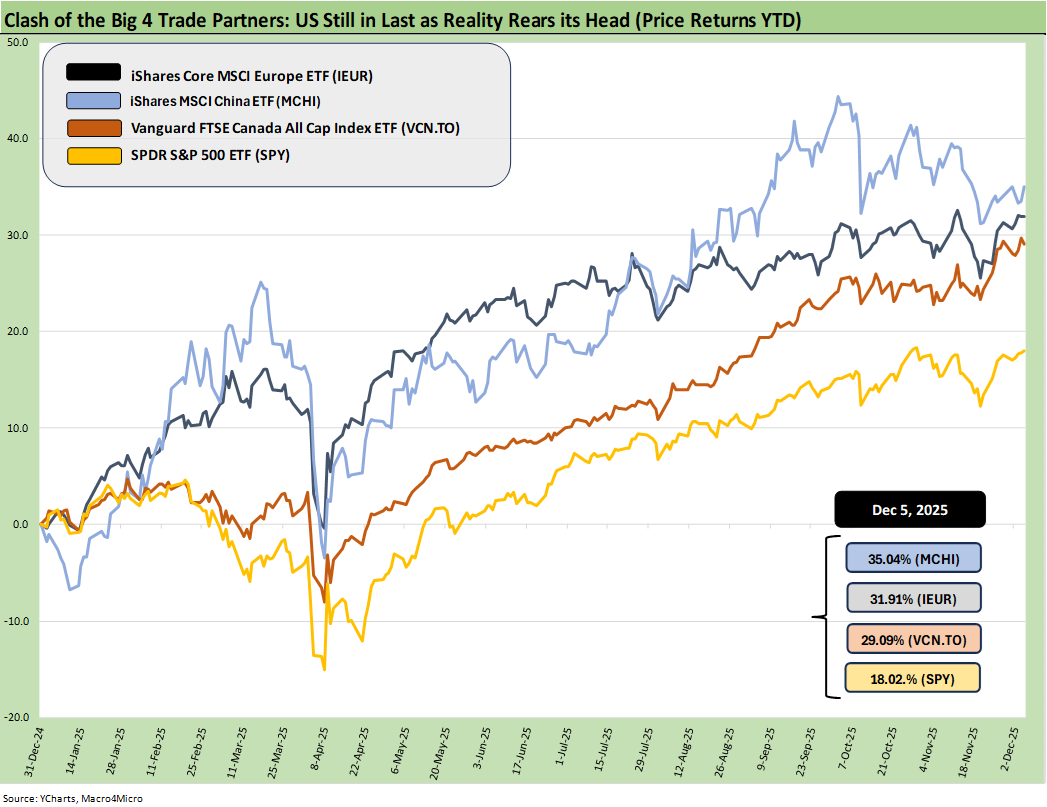
The chart updates the YTD returns for some bellwether index ETFs for the Big 4 developed market trading partners – the US, Europe, China, and Canada. The aim of the chart is to plot some ETFs that tell a market story for US investors thinking about global diversification. These ETFs are just a useful sample that uses relevant broad market indexes for each region as snapshots. The capture the balance of risks across the broad mix of macro trends (economy, currency) and the sea level industry and company fundamentals rolled up into a US traded ETF.
Once again, the US placed dead last YTD with the heavy influence of the dollar decline in 2025. The past week saw the DXY slightly weaken to 98.99 from 99.5 (11-28) when we went to print (down from 100.2 on 11-21). That contrasts with the 96-handle low of Sept 2025 and the 110-handle of Jan 2025.
The dollar has been on the mend in recent weeks after the worst YTD stretch since the 1970s. The price action is likely to remain an X factor as the direction of interest rates and the FOMC still signal uncertainty just watching the FedWatch gyrations the past few weeks.
The rule of thumb is the dollar stays firm or will strengthen when the US economic indicators are strong with UST rates stubborn or higher. For now, the consensus is for easing with the FedWatch at 86.2% as we go to print. We find it notable that the odds are not up over the 90% handle range where they were only a few weeks ago. The shift in the oddsmakers for the Jan 28, 2026 meeting will get a fresh game clock after some more payroll and CPI releases ahead.
Dollar risk, political dysfunction, and the UST supply factor…
The political disarray and relative instability of Washington in 2025 has set the stage for more trouble in 2026 (election attacks/denial, soldiers in the street, authoritarian leaning White House with GOP and SCOTUS tacit support, the optics of ICE violence). Such risks have raised some unusual issues for the dollar. The local currency-exposed ETFs thus make for a more complex set of inputs into 2026.
The American exceptionalism debate is not going away in substance even if that name gets old. The outlook season is bringing out some dollar bears with some tied to FOMC and UST curve expectations, some tied to macro shock worries (trade war, USMCA risks with the review, EU standing up for itself), stagflation worries, and some simply wrapped in the worry that the US has turned into a victim of erratic people with unworkable policy problems (i.e. an economic asylum). All of that comes with an election year soon underway.
With Epstein, affordability denial, martial excursions against Venezuela (Who is next?), and the small matter of the largest land war in Europe since 1945 still raging, it is easy to see why the flight to safety might not see the UST and dollar as the destination. That includes cases where there are grudges against the US – which are growing. The rumors and facts around de-dollarization and gold fixation are still being sorted out. The only BRICS member happy with Trump is the “R” and that is a problem with the #1 trade partner of the US, i.e., EU.
Basically, the US in geopolitical context has turned into a cluster of circles.
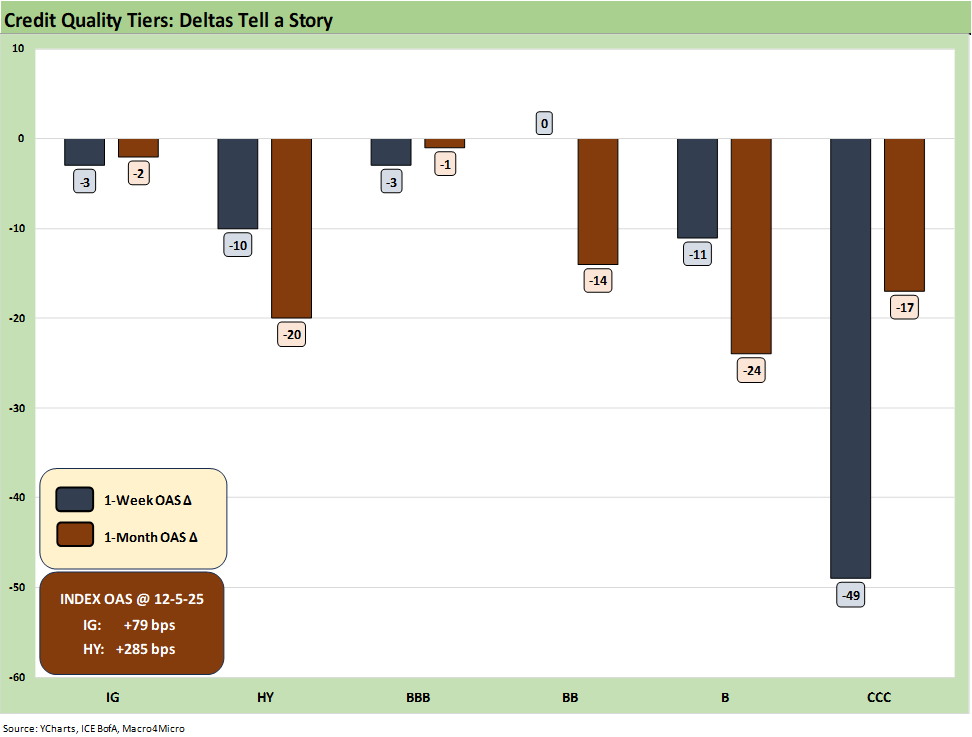
The above chart updates running 1-week and 1-month credit spread deltas for IG and HY. Spreads stayed in rally mode again this week and notably in HY at -10 bps with IG at -3 bps. With the new starting point for spread delta measurement and some rally weeks, HY is -20 bps tighter for the trailing 1-month period (last week’s rolling 1-month HY OAS delta was +19 bps wider). The B tier has led the charge with a quality spread compression in the B and BB tier for the month. The BB tier was quiet this past week. Meanwhile, IG is -2 bps tighter for the rolling 1-month period as it once again crossed below the +80 bps line to +79 bps.
The absolute HY spread level at +285 bps is still in line with past historical lows and just under the high end of the bubble month of June 2007. The HY Index OAS is now -7 bps tighter for the YTD period while IG is -3 bps tighter YTD. Returns in IG and HY have been about duration and coupon income and not spread compression.
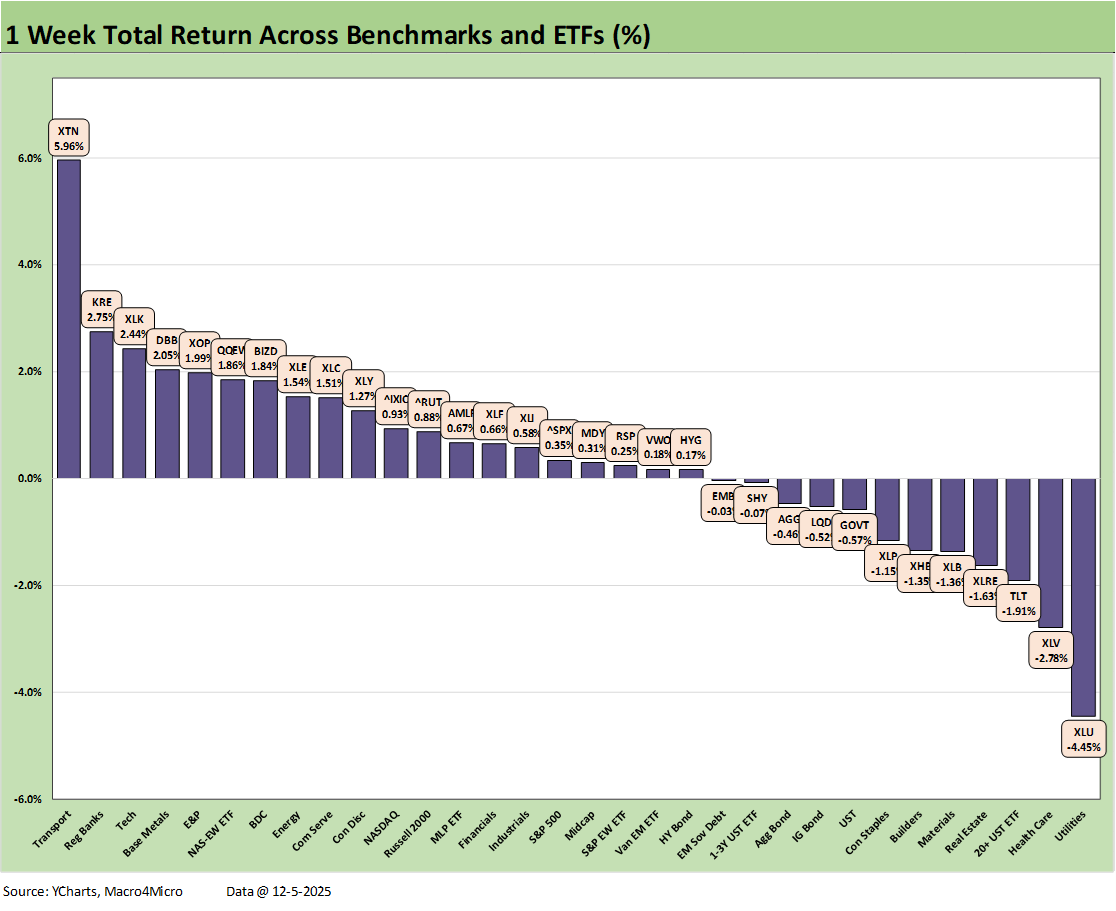
The above chart updates the rolling 1-week returns for the 32 benchmarks and ETFs we monitor. We see a 20-12 positive vs. negative return mix. So that was overall a good news week in equities with a healthy diversified mix of subsectors in the top quartile.
Bonds had a tougher week with 4 negative and 3 with positive returns. The few positive returns in bond ETFs posted negligible numbers with the best performer of the bond ETFs being HYG at +0.17%. We saw the long duration UST ETF (TLT) as the worst performer of the bond ETFs at 3rd to last with GOVT at the higher end of the bottom quartile and also in negative range.
The notable winner on the week was Transports (XTN) with some airlines and freight and logistics operators putting up some banner stock numbers. Some bullish street equity reports gave airlines some serious lift.
The top quartile has only two major tech lines with the Tech ETF (XLK) and Equal Weight NASDAQ 100 (QQEW). We see Regional Banks (KRE) at #2, Base Metals (DBB) at #4, E&P (XOP) at #5, and Energy (XLE) at #8. We also saw a modest rebound in the BDC ETF (BIZD). The top quartile mix of ETFs were not signaling “recession worries.”
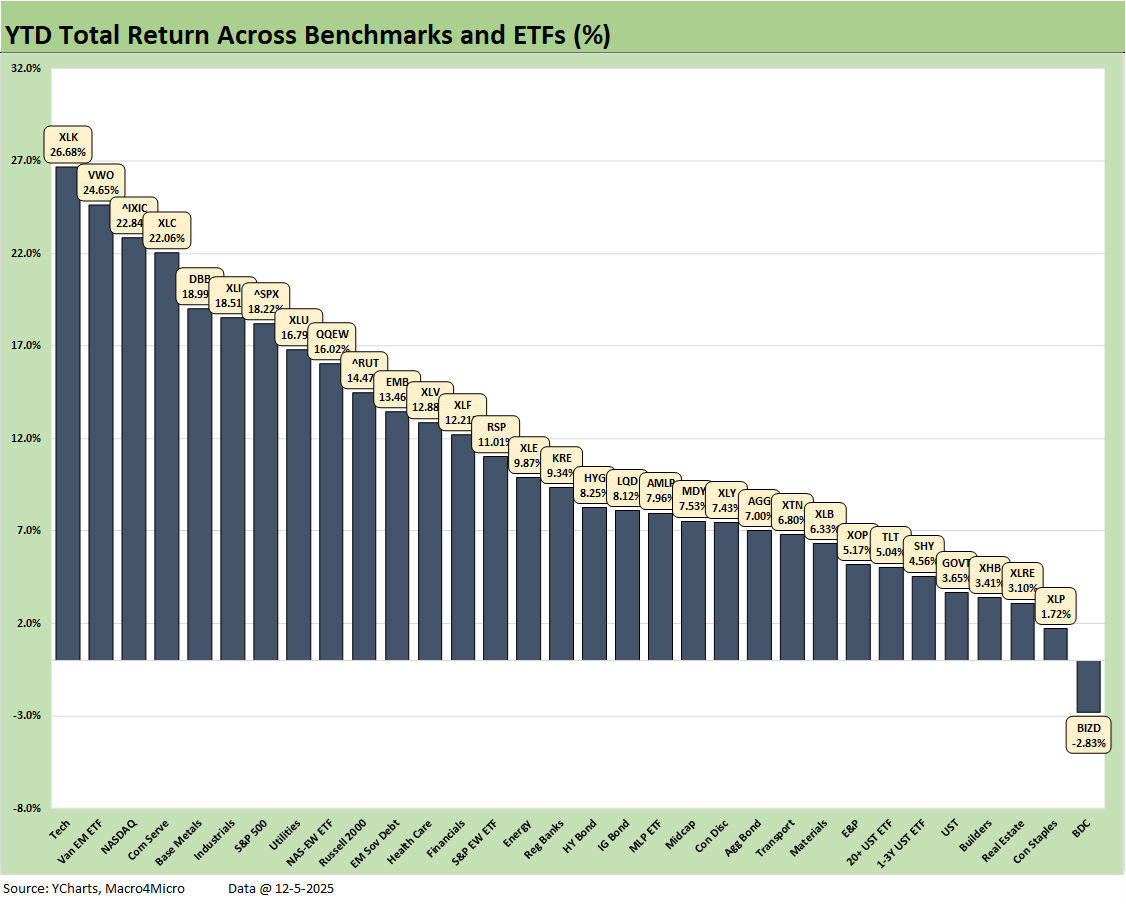
The above chart updates the YTD returns across the 32 benchmarks and ETFs. We look at the broader asset returns in a separate weekend publication. We include this one here to hammer home the race to the final 2025 numbers for the main benchmarks to see how those will frame up vs. 2024, which Trump has frequently labeled a” dead year” as one of his routine talking points.
With the S&P 500 at 18.2% YTD above, the index will need another 7% over a little more than 3 weeks to match 2024 and a bit more to match 2023. There are “record highs” and then there are competitive total returns. The 2025 numbers will likely lag 2024 and 2023 in large cap benchmark total returns – though not by much. The years across 2023 to 2025 have been very good years for equities.
This past week shows the NASDAQ at +22.1% YTD, so that benchmark will also need over 7 points over the remainder of the month to perform alongside 2024 when NASDAQ wrapped at +29.6%.
The Russell 2000 just hit an all-time high this past week. The Russell 2000 at +14.5% is looking very solid and is already ahead of the +11.5% in 2024.
None of the results will stop Trump from declaring 2025 the best stock market since the Big Bang.
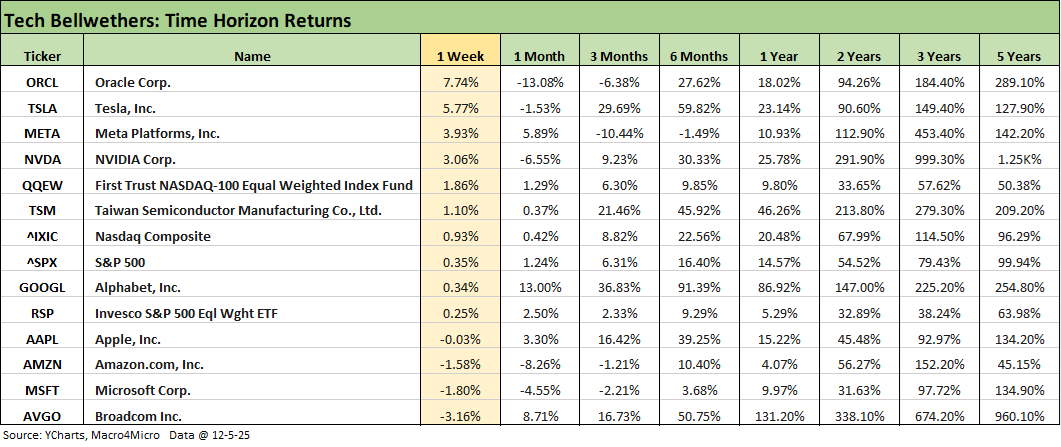
The above chart updates the tech bellwether returns in descending order of the weekly returns. We see Oracle climbing out of its recent swoon as it was tagged by some of the debt worries making the round in tech. We see 3 of the Mag 7 in the red for the week and 4 of the “Mag 7+3” in negative range. The NASDAQ and QQEW both beat the S&P 500.
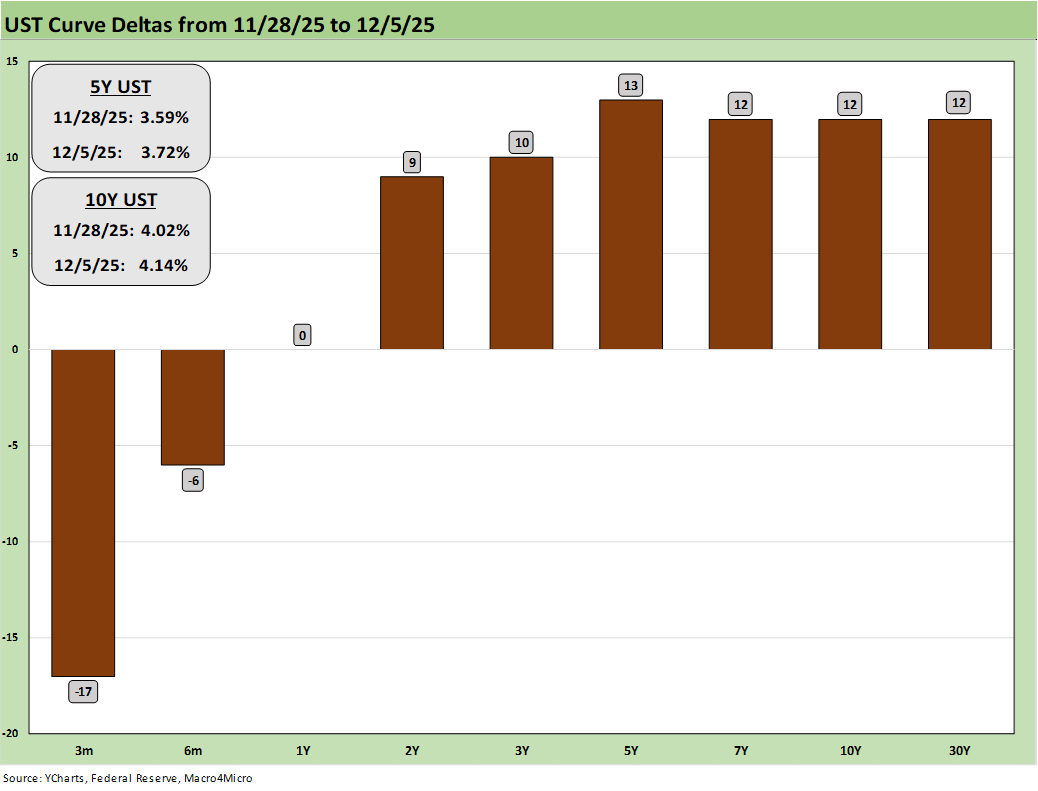
The above chart updates the selloff week for bonds as seen in the UST deltas. The 10Y UST has remained in a relatively tight range around the 4.0% line but ended at +4.14%. The PCE inflation numbers had some noise in the line items that constitutes “net bad” news as we see it. The 4Q25 data is critical for a better read on payrolls and tariff impacts (see PCE, Income & Outlays: Calendar Gap Closing 12-5-25, Simplifying the Affordability Question 11-11-25).
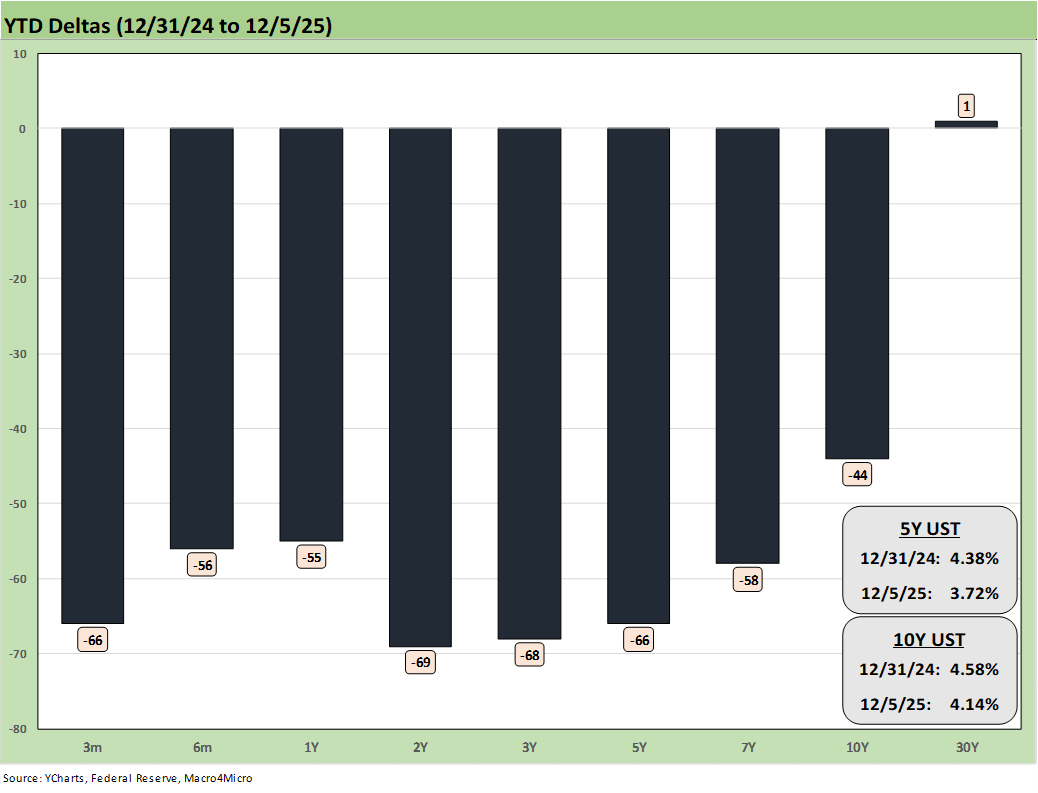
The above chart updates the YTD bull steepener that has kept all bond ETFs in positive return range during 2025.
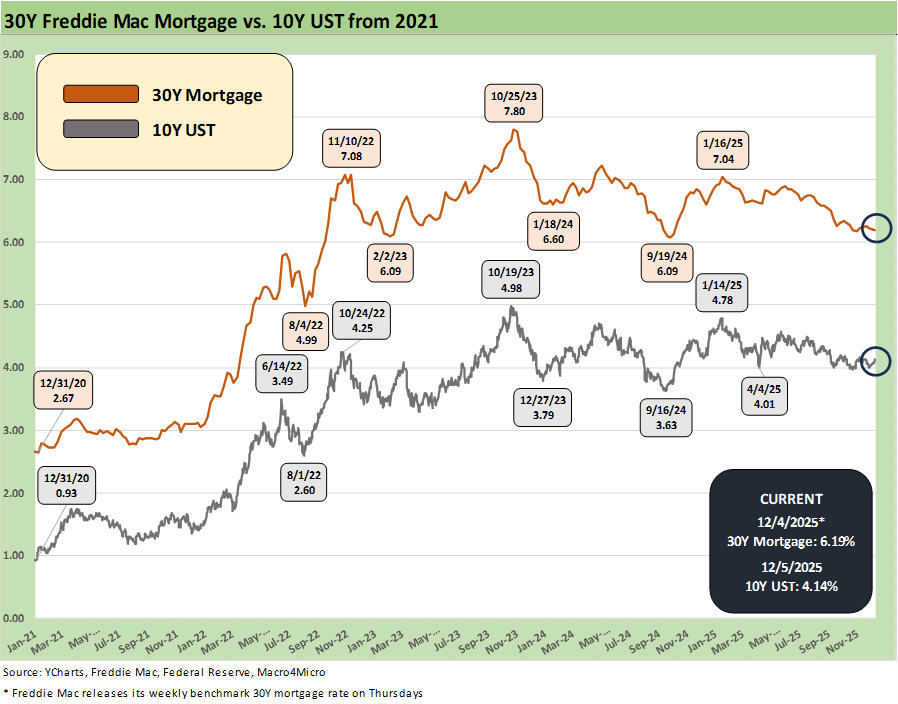
The above chart updates the 10Y UST vs. the 30Y Freddie Mac mortgage. With the 10Y UST fighting to break through the 4% line before this week’s backpedal, the 30Y mortgage rate is going to have a hard time cracking through 6%. The Mortgage News Daily survey closed on Friday at 6.27%.
When (and if) the FOMC eases this week, the market should take a peek back at the late 2024 price action on mortgages. The happy ending did not arrive with 100 bps of cuts in 4Q24. We even moved back above 7% on Freddie Mac in early 2025. The UST steepener dynamics are more complicated now with almost a year of tariffs, a much weaker dollar, and worsening global relations.
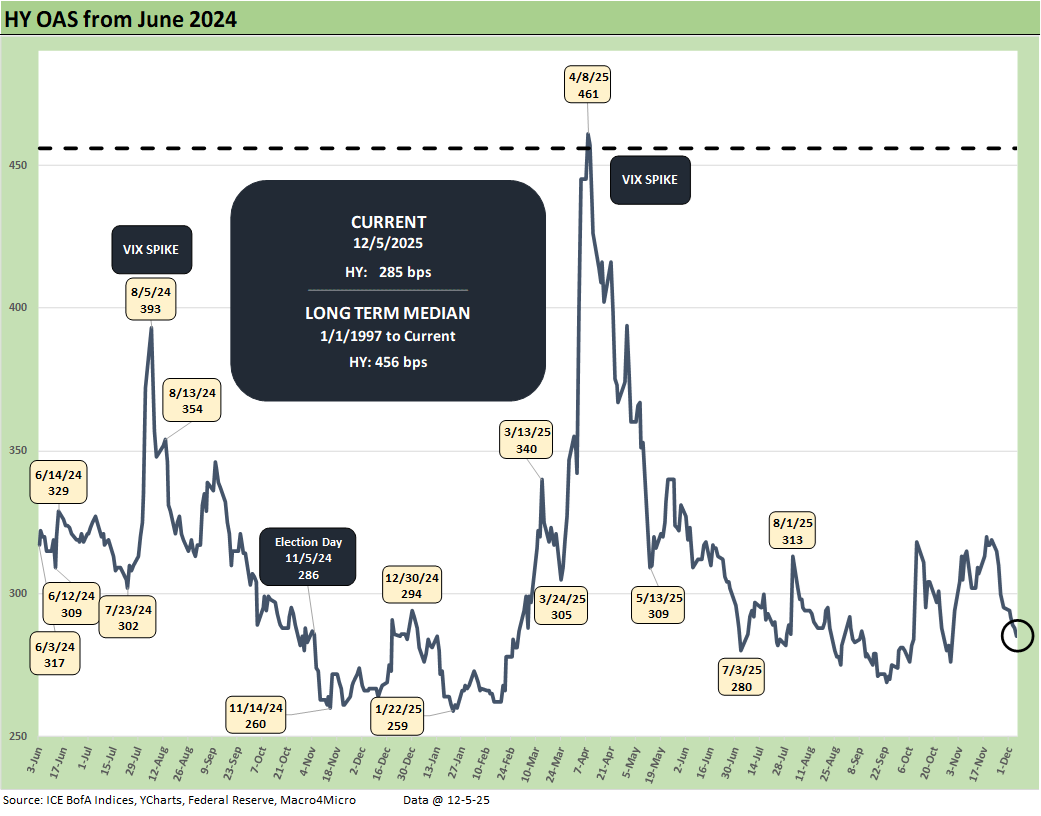
The above chart shows the fresh rally in the US HY index OAS by another -10 bps to +285 from +295. The reality of fundamentals and credit risk is that the HY issuer base is in decent shape, defaults are very low for the HY index issuer profiles, and the coupon income and manageable duration risk fit a lot of profiles.
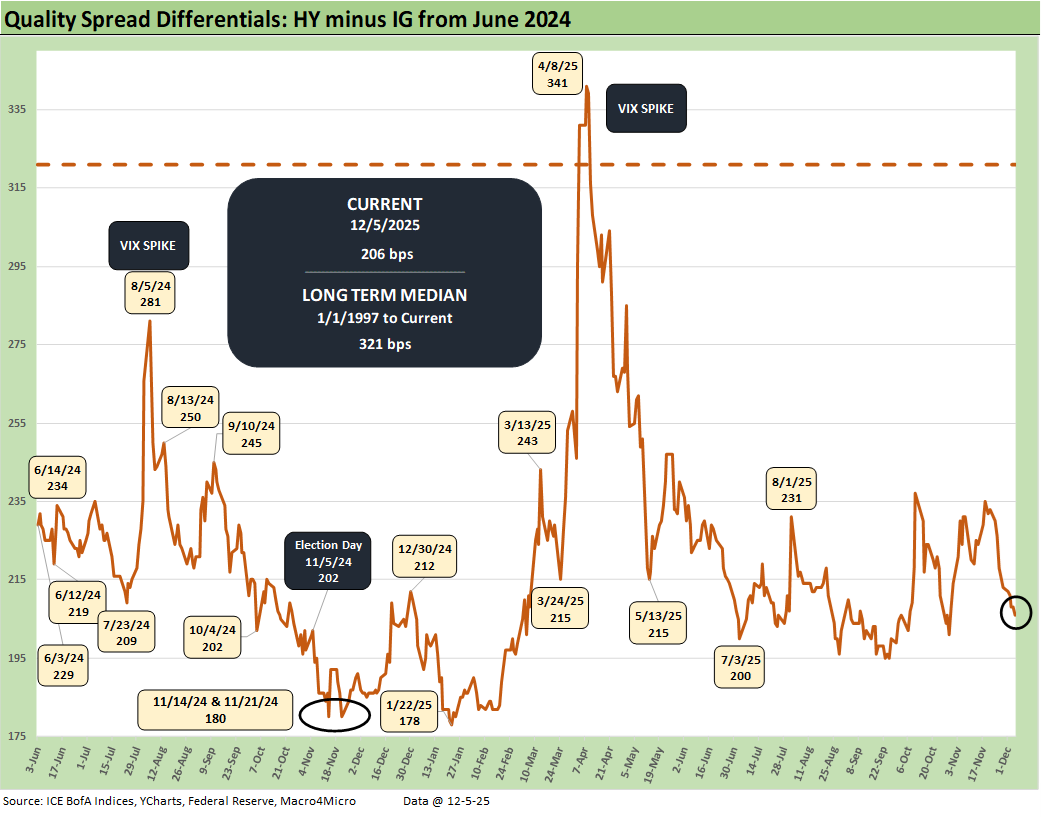
The HY OAS minus IG OAS quality spread differential tightened by -7 bps from +213 bps to +206 bps on the HY spread compression of -10 vs. the IG spread compression of -3 bps.
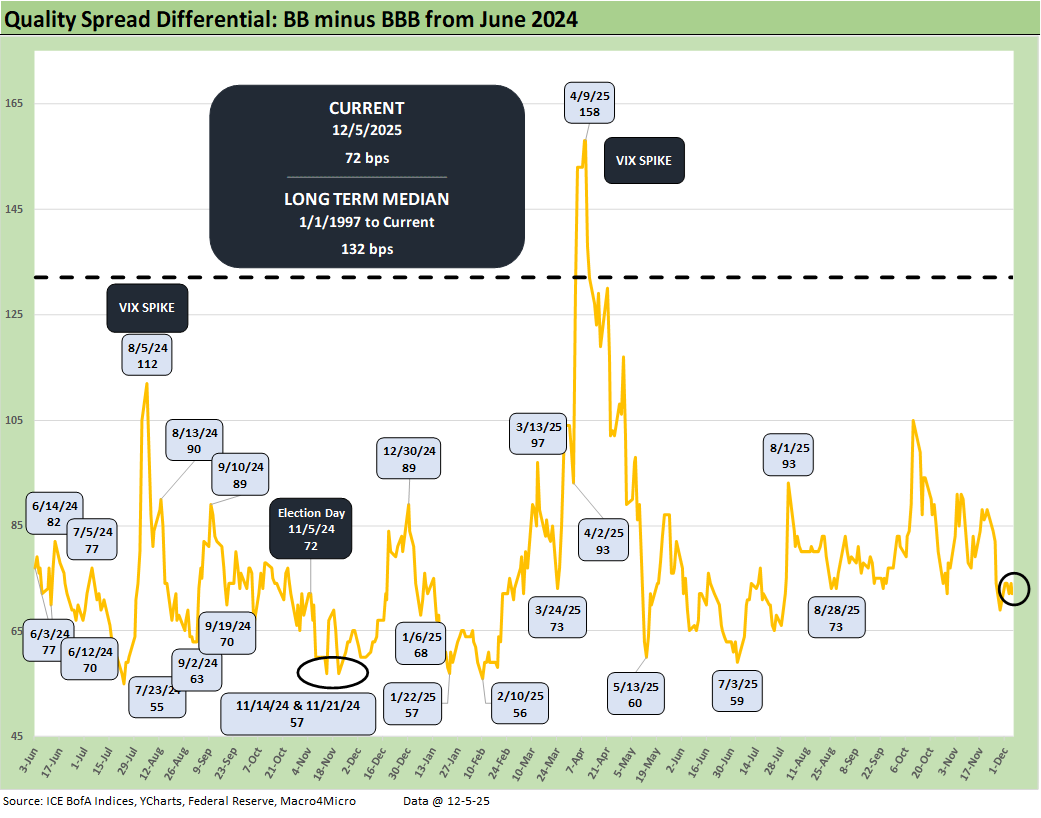
The quality spread differential along the speculative grade divide of BB vs. BBB widened by +3 bps to +72 bps from +69 bps last week. The zero bps move in the BB tier vs. -3 bps in the BBB tier drove the slight decompression of BBB vs. BB tier.
See also:
PCE, Income & Outlays: Calendar Gap Closing 12-5-25
Credit Markets 12-1-25
Market Commentary: Asset Returns 11-30-25
Mini Market Lookback: Back into the June 2007 Zone 11-29-25
Durable Goods Sep 2025: Quiet Broadening of Core Capex 11-26-25
Retail Sales September 2025: Foot off the Gas 11-25-25
The Curve: Flying Blind? 11-24-25
Mini Market Lookback: FOMC Countdown 11-23-25
Employment Sept 2025: In Data We Trust 11-20-25
Payrolls Sep25: Into the Weeds 11-20-25
Mini Market Lookback: Tariff Policy Shift Tells an Obvious Story 11-15-25
Retail Gasoline Prices: Biblical Power to Control Global Commodities 11-13-25
Simplifying the Affordability Question 11-11-25
Mini Market Lookback: All that Glitters… 11-8-25
Mini Market Lookback: Not Quite Magnificent Week 11-1-25
Synchrony: Credit Card Bellwether 10-30-25
Existing Home Sales Sept 2025: Staying in a Tight Range 10-26-25
Mini Market Lookback: Absence of Bad News Reigns 10-25-25
CPI September 2025: Headline Up, Core Down 10-24-25
General Motors Update: Same Ride, Smooth Enough 10-23-25
Mini Market Lookback: Healthy Banks, Mixed Economy, Poor Governance 10-18-25
Mini Market Lookback: Event Risk Revisited 10-11-25
Credit Profile: General Motors and GM Financial 10-9-25
Mini Market Lookback: Chess? Checkers? Set the game table on fire? 10-4-25
JOLTS Aug 2025: Tough math when “total unemployed > job openings” 9-30-25
Market Lookback: Market Compartmentalization, Political Chaos 9-27-25