
Existing Home Sales Nov 2025
The uptick in existing sales volumes for a third straight month is a decent way to end a rough year for housing.


Existing home sales volume ends with the good news of 3 straight months higher even if in the slow season. Inventories have faded to the lowest level since the early spring while mortgages remain stubbornly above 6%. Prices rose yet again YoY with a sequential MoM downtick in prices for single family and condos/coops.
The macro crosscurrents are ending 2025 on a bad note with weak overall payroll trends at a time as health care costs threaten a shock. Affordability pain could spread across the bottom of the “K economy” even as tariffs face reality checks from SCOTUS on the way into the upcoming USMCA review.
Policy chaos impacts material costs for DIY with existing or new housing across a wide range of household goods. Cost pressures range from the materials level and flow up through everything from cabinets to upholstered furniture as a strange year comes to an end.
The mortgage rate lockdown in a world with many 3% and 4% mortgages remains a barrier to supply on the existing side while new home supply has struggled as reiterated in recent quarterly earnings from homebuilder bellwethers.
The above chart shows the sales volume deltas by price tier for Nov 2025, and we see a major reversal from the recent increases across price tiers. For the YoY change in volumes YoY we see 5 of 6 posting YoY declines with only the $1+ million price tier slightly higher. We look at this mix from a different angle in the final chart in this collection.
With the Dec FOMC cut of -25 bps on the heels of the Sept and October actions, we still see mortgage rates hovering in the low 6% area but in a narrow range around 6.2% (6.25% for the Mortgage News Daily Survey Friday close).
The three cuts in the fall of 2025 (-75 bps) followed 3 actions in the fall of 2024 (-100 bps). Those expecting the 10Y UST to follow fed funds lower have been relatively disappointed even if the mortgage market is down from the highs of 2024-2025. Monthly payment demands set against higher average home prices are still painful for the buyer or those seeking to sell and move up, sell and downsize, or simply relocate.
UST steepening threats…
The threat of the UST curve steepening and pushing rates higher in the long end in 2026 is not gone (see The Curve 12-15-25). That is especially the case given stubborn inflation and the gradual increase seen in numerous product groups in the CPI report. Headline inflation in Sept was right around where it was in Dec 2024 (see PCE, Income & Outlays: Calendar Gap Closing 12-5-25, CPI September 2025: Headline Up, Core Down 10-24-25). The Nov CPI was favorable on balance (see November CPI: Tricky Navigation12-18-25), but the overall quality of the Nov CPI metrics took a lot of heat from economists based on the assumptions for October during the shutdown.
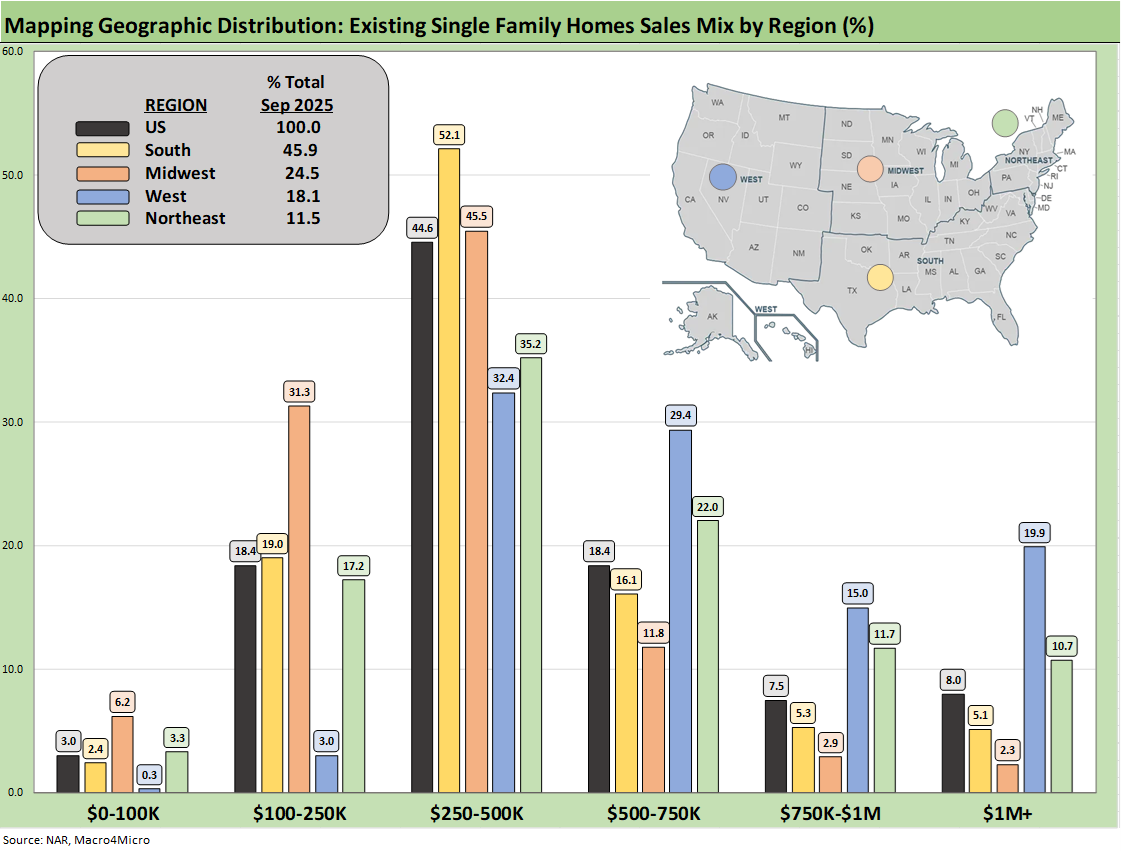
The above chart shows the geographic mix of volumes and details on price mix by region. The South is the main event in single family volumes whether new or existing at around 46%.
For the bar chart, we break out the mix for each region by price tier. For example, the South shows over 52% of its existing home sales volume in the $250k to $500K range and over 16% of its sales in the $500 to $750K bucket. The bars for each region add up to 100%.
The high cost of homes in the West (notably California) is clear enough just by glancing at the bar chart with almost 20% at prices over $1 million. The second highest in the $1 million club is the Northeast at over 10%.
We see a big concentration in the $250K to $500K bracket for all regions at over 44% of the total and a heavy weighting in the $100K to $250K bracket for the Midwest at over 31%. The map explains what states are in each Census region. There is a very wide range of home price profiles in the West and Midwest states.
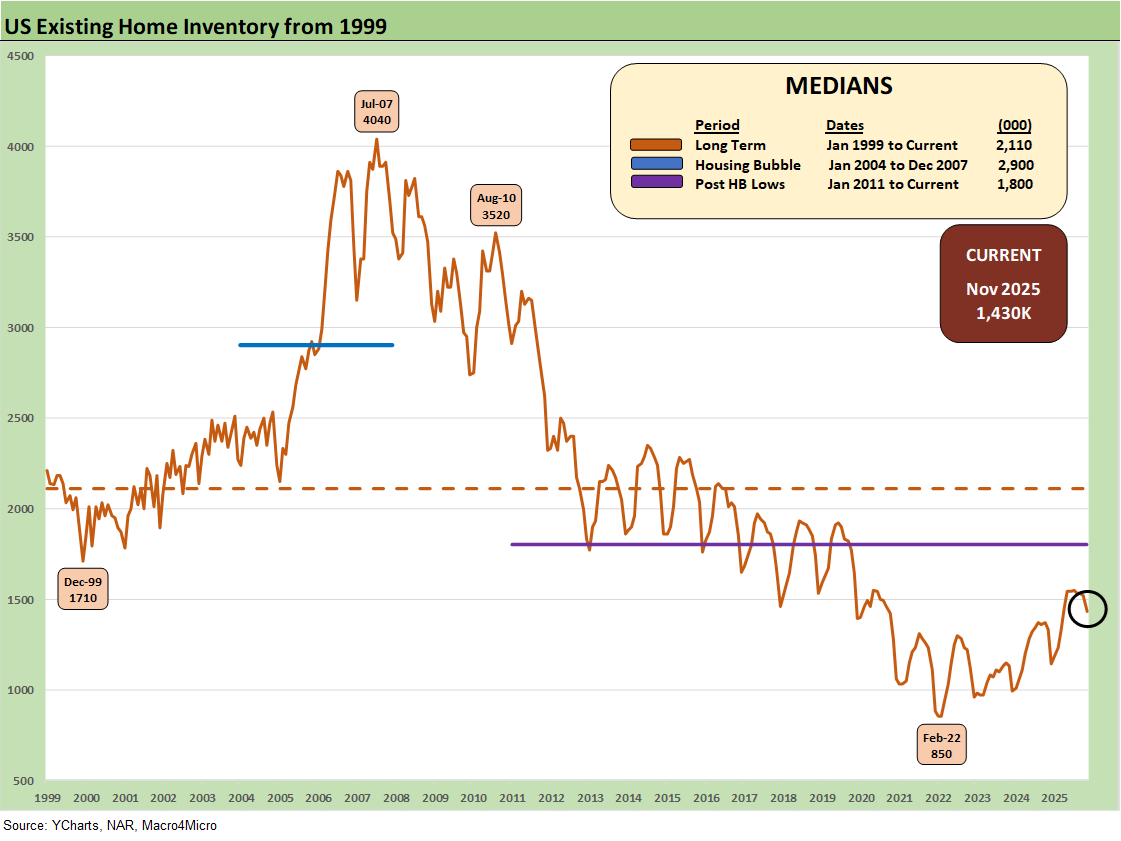
Inventory declined MoM to 1.43 million units for total existing homes at -5.9% MoM but was still +7.5% higher YoY. Current inventory is well below longer term medians.
The existing home inventory balance had shown a steady rise off the sub-1 million lows of 2022-2023. Inventory had risen to the 1.3 million handle range in 2024 before dipping back down to a recent low of 1.14 million to close out 2024. We bounced off those numbers in 2025 to get back above 1.5 million before this latest move lower to 1.43 million.
We see the Feb 2022 lows at 850K above when demand was very high just before the tightening cycle kicked into gear in March 2022. Separately, single family home inventory is up by +7.8% YoY but down by -5.3% sequentially. Condos and Coop inventory is up by +5.4% YoY but down by -9.2% from Oct 2025.
The ability of prices to push higher in the face of rising YoY inventory had been one of the more multilayered issues across price tiers and regions. We now see inventory shifting lower this past month. Whether it is the time-honored gap that often exists between seller and buyer or the belief that a sharp yield curve move could favor one side or the other, volumes have suffered (and brokers are not too happy either).
We see many in the housing trade focusing on a move below 6.0% as the trigger point for a sharp rise in sales. As detailed in other research, the mortgage market was briefly around 6.0% in Sept 2024 with the FOMC easing before the UST curve went higher and steeper and took mortgage rates along with it.
Fed funds cuts in the fall of 2024 (that was -100 bps in 3 moves) were not magic for mortgages then, and the stagflation risks are higher today. The FOMC has not been magic in late 2025 either with 3 cuts.
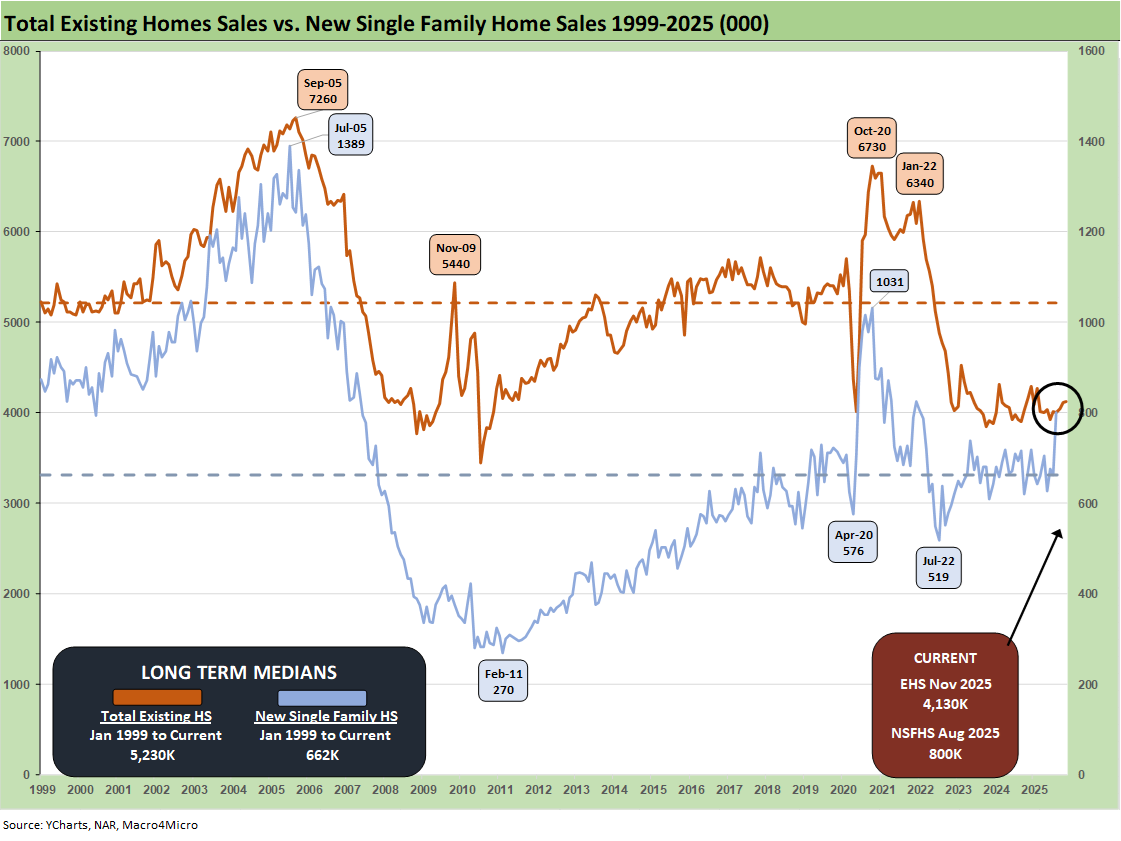
The above two-sided chart updates the trend line in total existing home sales vs. new single family homes. August new home sales are reflected in the chart given the lack of recent new home sales data from the Census. We have been operating without new home sales data from the census since the shutdown. We await the updates.
The existing single family MoM median price decrease to $414.3K in Nov 2025 from $420.2K in Oct 2025 in part reflects the end of the peak selling season but also a mix of cyclical anxiety risks and mortgage rate factors impacting households.
The trends reinforce the view that there are some “expectation challenges” in the buyer and seller ranks.
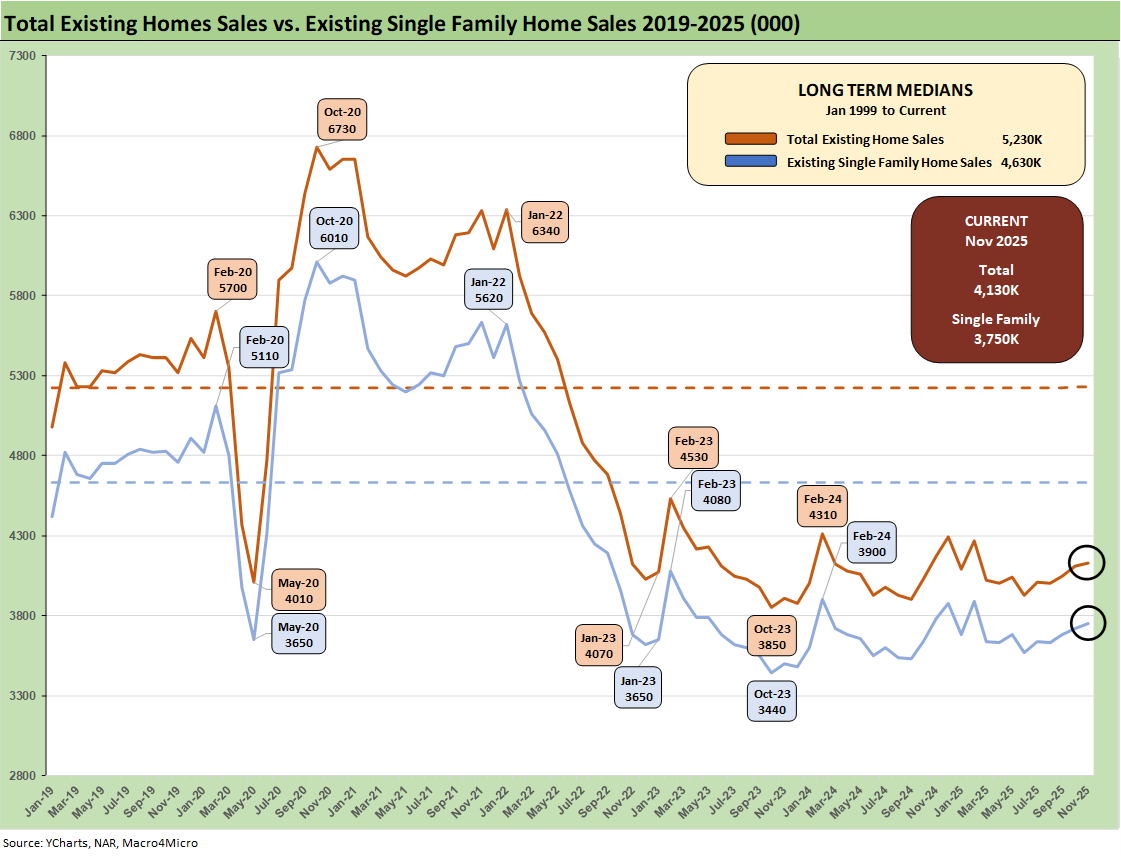
The above chart breaks out the timeline for existing single family alone of 3.75 million vs. total existing home sales of 4.13 million, which is well below the long-term median (from Jan 1999) of 5.23 million for total existing homes. Existing single family was +0.8% sequentially and -0.8% YoY (SAAR). The lower line is ex-condo/ex-coops. We saw 380K in condos and coops in Nov 2025, down from 390K YoY in Nov 2024 and down from 390K in Oct 2025.
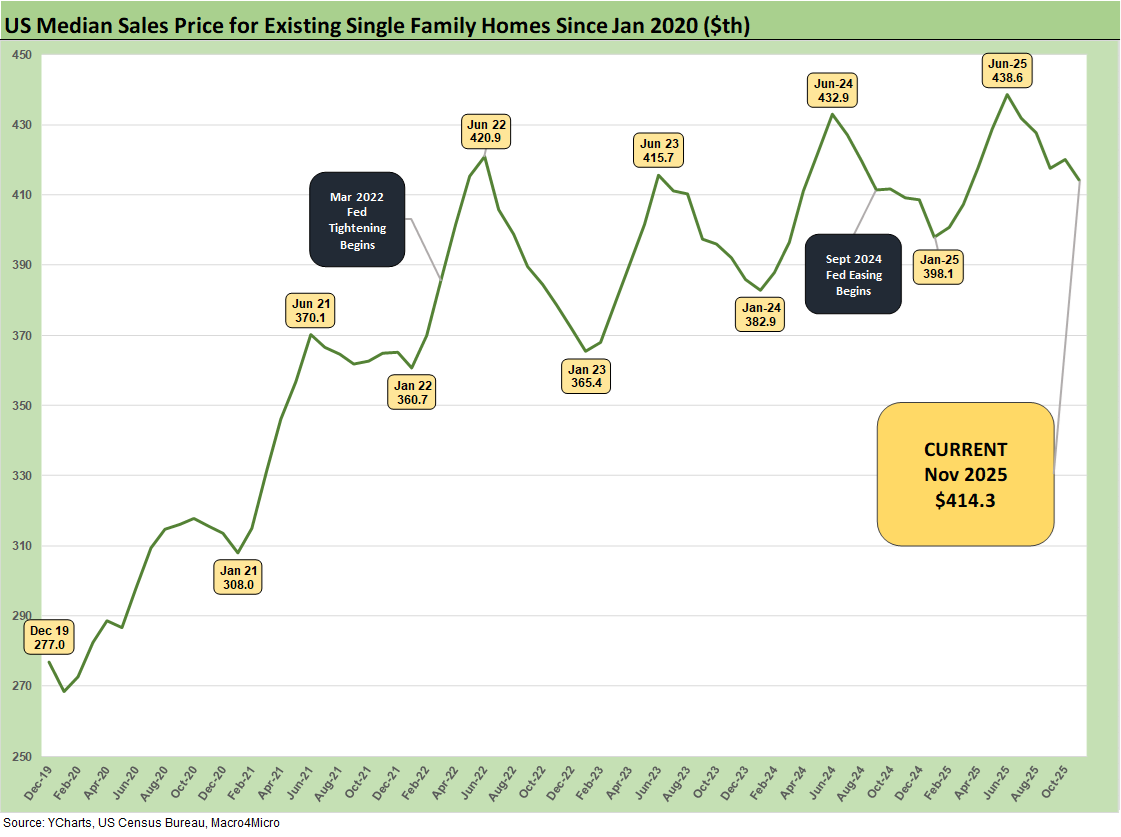
The above chart updates the median price for existing single-family homes at $414.3K after June 2025 hit a record $438.6K. The median price in Nov 2025 is dramatically above the $308K level back in Jan 2021 and $277K in Dec 2019 when mortgage rates were in a different zip code.
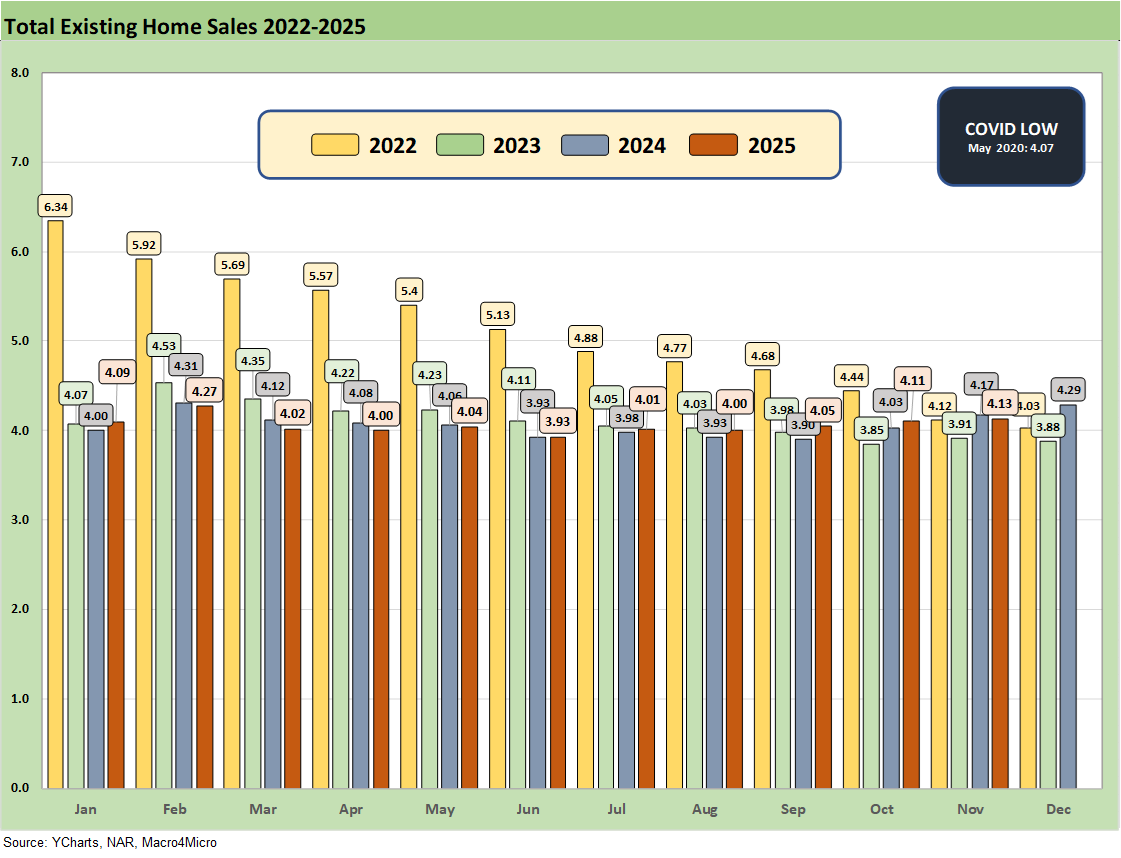
The above chart updates the monthly existing home sales across the timeline from Jan 2022 through Nov 2025. The existing home sales volume is a long way from the mid-6 and high 5 million handles of 2021 and then into early 2022 when many homeowners had refinanced and new buyers locked in low mortgages. ZIRP ended in March 2022 and then the UST migration began.
The Nov 2025 total of 4.13 million is slightly above the May 2020 COVID trough of 4.07, so the current run rates remain quite low in cyclical context. We had a few more sub-4 million handles along the way as noted in the chart, so this has been a brutal period for real estate brokers.
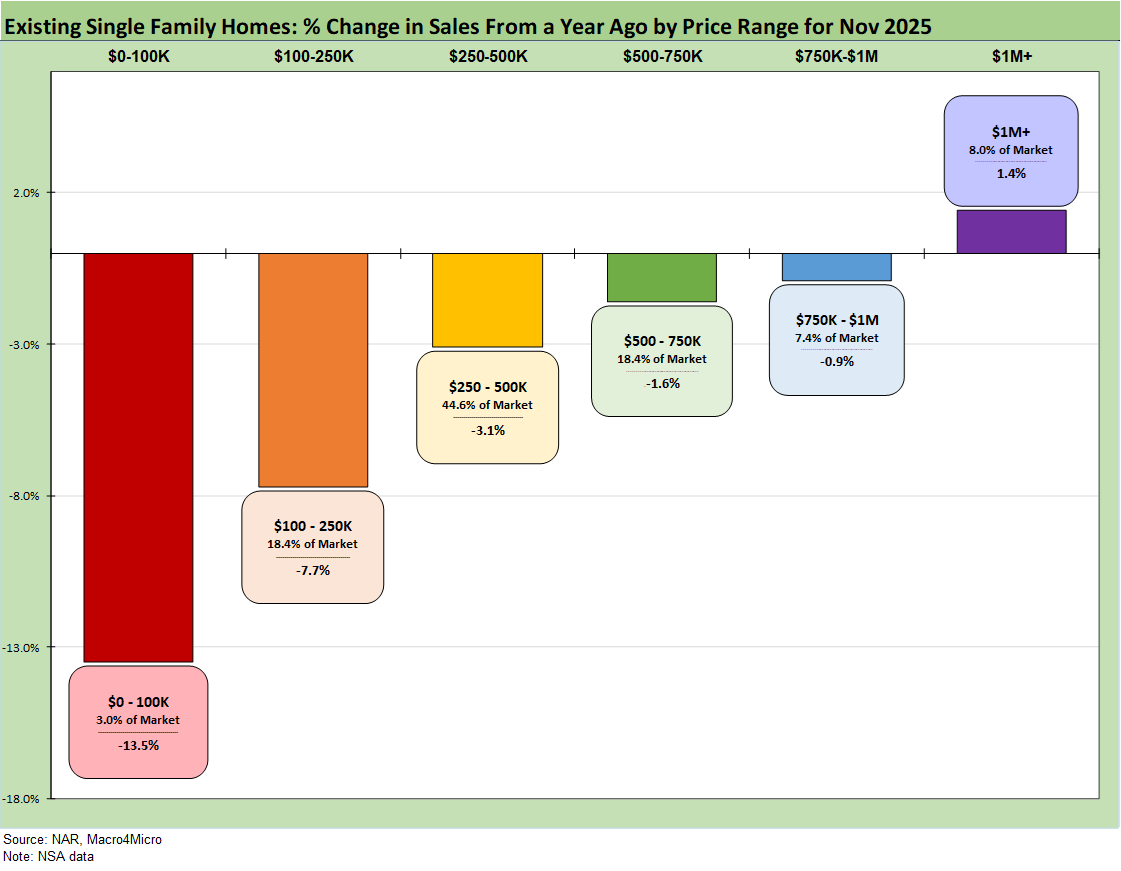
The above chart revisits the topical area addressed earlier on the existing home sales deltas by price tier. The largest tier is the $250K to $500K at over 44% of sales volumes, and that tier was at -3.1% in a seasonal slow period.
The challenge for the lower tier buyers is evident with the $100K to $250K tier at -7.7% in a tier that comprises over 18% of volume. The $500K to $750K tier is 18.4% of the market and was off by -1.6% for Nov. We see the $1+ million up by +1.4% for Nov. The highest price tier is 8.0% of the market.
The modestly negative trends overall in the above chart still get back to the reality of low volumes and the obvious trend that homebuyers with more money are better off.