
November CPI: Tricky Navigation
Some relief for the stagflation story with the “-flation” part easing this month and edging closer to target range.


Row faster.
After a Sept PCE reading that was going the wrong way in YoY numbers along the major line items (food, energy, goods), the headline and core CPI numbers moved more comfortably below the 3% line in Nov. Trump can now say Nov headline CPI is below Dec 2024 CPI (Biden’s last full month). That was not the case in September (see PCE, Income & Outlays: Calendar Gap Closing 12-5-25, CPI September 2025: Headline Up, Core Down 10-24-25).
The affordability challenge remains but looks better in this month’s release. The next major challenge will be the direction of health care with the premium reset after the ACA hammer comes down. Total Energy CPI remains high at +4.2% despite some oil price support. Medical Care Services weighed in at +3.3% YoY, which is down notably from 3.9% in Sept. Health Insurance was only +0.6%. Those two lines will go into the “hang onto your hat” category as we wade into 2026 and the moving parts of health care premiums unfold.
There are always good and bad lines in these releases, and the bottom line is 2.7% headline CPI and 2.6% Core CPI have a lot going on under the hood. Positive inflation means prices are higher and will remain higher, so the “prices are down” nonsense needs deflation to be an accurate statement. No economist outside a straight jacket wants deflation. That said, prices are up overall. That is why they call it “positive inflation.”
For now, this CPI is good news and helps the easing bulls craft a story when taken in tandem with the weak Nov jobs performance (see Employment Nov 2025: Bad News is Bad News 12-16-25). As we go to print, we see the 10Y edging a few bps lower, but much lies ahead as more pricing decisions are made by buyers of goods under tariffs, and the health care (ACA premiums) fiasco flows into consumer budgets.
This best news is the decline in Food inflation YoY to 2.6% from 3.1% in Sept and the worst news is the increase in total Energy inflation to +4.2% in Nov from +2.8% in Sept with Electricity at +6.9%, Utility (Piped) Gas Services at +9.1% and Fuel Oil at +11.3%. Gasoline at +0.9% takes the edge off, and there are more than a few forecasters calling for oil to collapse, which in turn would be a windfall for the consumer.
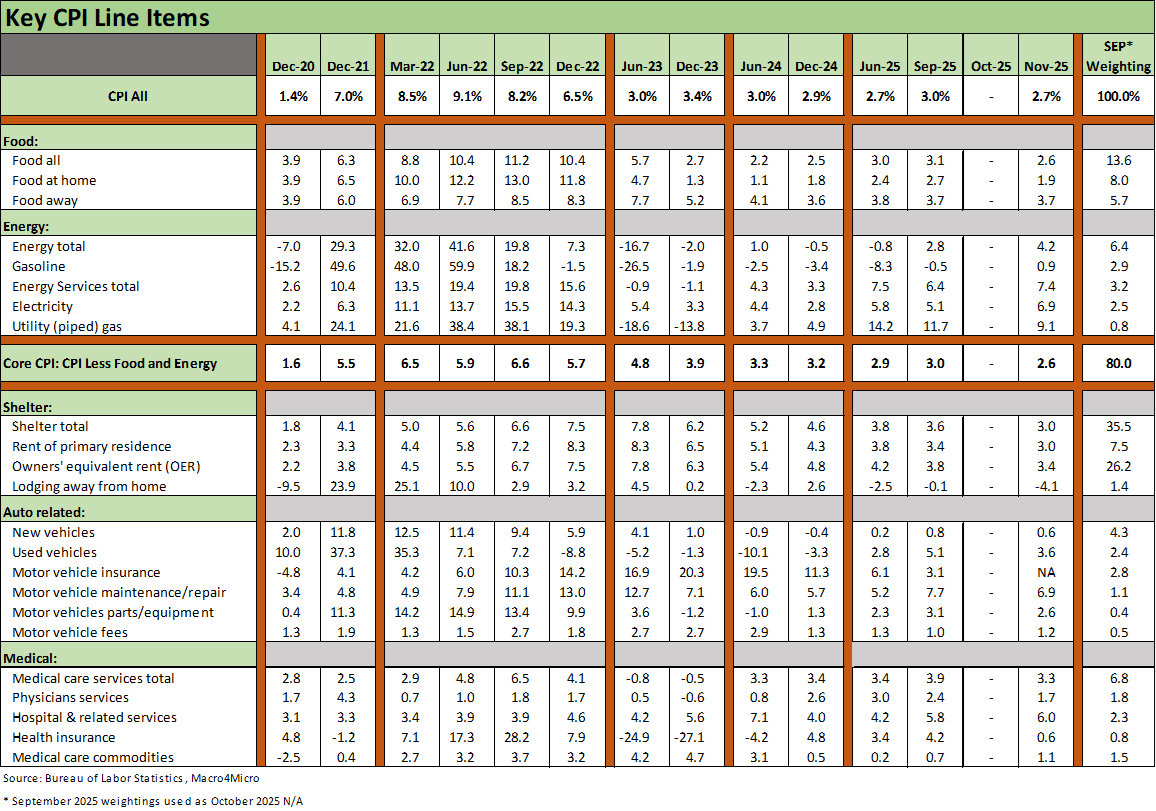
The above chart updates the key goods and services CPI lines we break out each month. They add up to around 75% of CPI. This month we will skip the long-term timelines and stay in the product groups. For the Headline vs. Core history and fed funds vs. headline CPI relationships (see CPI September 2025: Headline Up, Core Down 10-24-25).
We highlight that the above chart details the weighting based on Sept numbers since October metrics are not available. The relative dominance of Shelter at over 35% of the CPI index weighting puts an asterisk on the number, so CPI ex-Shelter is a good proxy as detailed further below.
When affordable housing comes up as a topic, the cash economics have very little to do with the shelter CPI number given the changes back in the early 1980s on how shelter CPI is measured. We have covered that in past commentaries.
The shelter CPI is a derived theoretical number tied to rent (“Owners Equivalent Rent” or OER). That is unlike the data you would see in the late 1970s tied more to price and mortgage rates. Either way, housing affordability needs lower mortgage rates and more supply. That challenge remains as does the need to unlock more existing home sales. NAR’s existing home sales report will be released tomorrow.
The reality for the homebuyer can be more simply framed with the questions: “How much does the house cost?” and “What are my monthly payments? That math is still brutal in the post-COVID cycle.
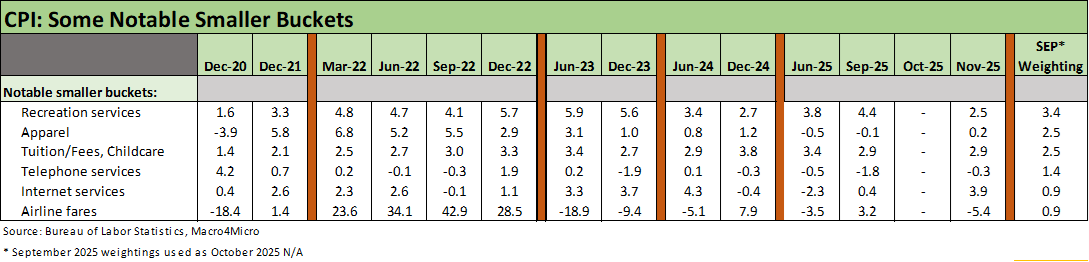
It is easy enough to dig into the line items to see some tariff impacts in some of the goods line items such as “living room, kitchen, and dining room furniture” (+4.6%), “tools, hardware and supplies” (+5.6%), and “audio equipment” (+10.2%). We see “women’s outerwear” (7.4%) and “women’s dresses” (+5.6%), but those and other product line CPI measures will be playing out gradually across 2026. What the tariffs are costing small business lines and retailers on the “cost of sales” line is a slow and steady pain analysis.
Those of us that are heavy coffee drinkers (+18.8%), eat meat (+8.9 with +15.8% beef and veal), like sugar and sweets (+6.8%) will pay more, but the good news is that Food at Home is down to +1.9% YoY from +2.7% in Sept. “Frozen fish and seafood” weighed in at +11.6%. Eggs are down by -13.6% now that Trump has cured avian flu (he looks great in a white coat, sets off the orange).
“Food Away from Home” at +3.7% (flat to Sept) is more stubborn but has more moving parts with costs to recapture. The “Energy prices are down” Jedi Mind Trick about oil does not change the reality that total Energy inflation remains a problem at +4.2% despite only +0.9% on gasoline. Energy Services overall weighed in at +7.4%.
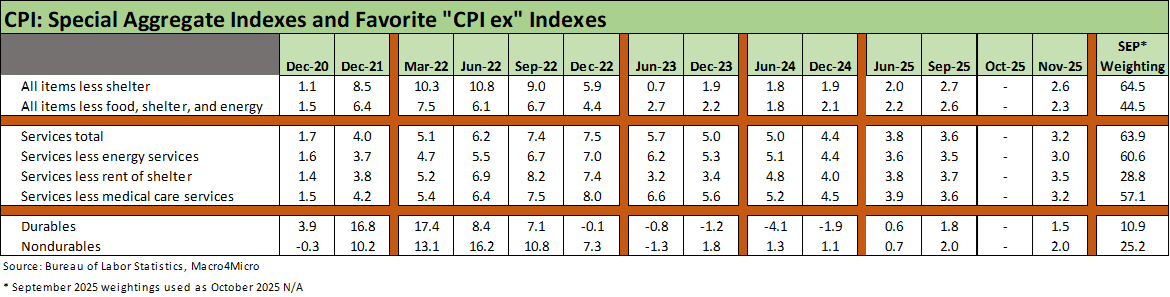
We always look to the adjusted CPI aggregates in Table 3 for some other vantage points. “All items less shelter” at 2.6% is above the Dec 2024 level of 1.9% while “All items less food, shelter, and energy” ticked up to 2.3% in Nov 2025 from 2.1% in Dec 2024.
For tariff signals, we see Durables at +1.5% vs. the deflation of Dec 2024 and Dec 2023. Nondurables posted +2.0% or almost 2x the Dec 2024 level of 1.1%. In other words, the supplier chain issues are still complex and subject to the test of time.
For Services, the mid-3% handle mix of the various services lines above continues to challenge the price mix across various layers presented above.
See other Inflation Related:
PCE, Income & Outlays: Calendar Gap Closing 12-5-25
Retail Gasoline Prices: Biblical Power to Control Global Commodities 11-13-25
Simplifying the Affordability Question 11-11-25
CPI September 2025: Headline Up, Core Down 10-24-25
PCE August 2025: Very Slow Fuse 9-26-25
FOMC: Curve Scenarios Take Wing, Steepen for Now 9-17-25
CPI August 2025: Slow Burn or Fleeting Adjustment? 9-11-25
PPI Aug 2025: For my next trick… 9-10-25
PCE July 2025: Prices, Income and Outlays 8-29-25
Producer Price Index: A Snapshot of the Moving Parts 8-14-25
CPI July 2025: Slow Erosion of Purchasing Power 8-12-25
PCE June 2025: Prices, Income, and Outlays 7-31-25
Employment Cost Index 2Q25: Labor in Quiet Mode 7-31-25
CPI June 2025: Slow Flowthrough but Starting 7-15-25
PCE May 2025: Personal Income and Outlays 6-27-25
CPI May 2025: The Slow Tariff Policy Grind 6-11-25
Employment Cost Index 1Q25: Labor is Not the Main Worry 5-1-25
Inflation: The Grocery Price Thing vs. Energy 12-16-24
Inflation Timelines: Cyclical Histories, Key CPI Buckets11-20-23
Fed Funds – Inflation Differentials: Strange History 7-1-23
Fed Funds, CPI, and the Stairway to Where? 10-20-22