
Market Lookback: FOMC Fragments, Rate Debates Murky 12-13-25
The wild finish is on for current data and a wide range of 2026 outlooks. The S&P 500 and NASDAQ total returns both look to underperform vs. 2024.


Is Trump Core 5 a closet Triumvirate? Guess who gets to be Caesar?
The week saw the S&P 500 and NASDAQ in the red but with small caps and midcaps in the top quartile of our group of 32 benchmarks and ETFs. NASDAQ weighed in toward the low end of the bottom quartile with the S&P 500 in the third quartile as the 11 S&P 500 sectors posted 6 positive and 5 negative. The week saw 6 of 7 bond ETFs post negative returns with only the short UST ETF (SHY) barely positive.
The FOMC meeting was a striking one for the widely divergent views and also for the bullish upward revision in median GDP forecasts for 2026 while showing a median consensus of only 1 net cut in 2026 but across a wide range in the dot plot (see FOMC: Dot Plot Scatters for 2026 12-10-25).
With Nov payrolls and CPI teed up for this week, the FOMC cliques will be out making their cases for their dot plot and SEP forecasts while Trump will be trying to reconcile his declaration that “prices are way down” despite positive inflation. The readings within Food and Energy will be especially interesting given the political sensitivity of those two lines. The consumer blowback has caused Trump to suppress (but not refute) his “seller pays” nonsense by easing some key food tariff lines (see JOLTS: Goldilocks’ Ugly Twin 12-9-25).
The farmer bailout heightens the tariff blowback as Trump takes actions without Congressional involvement yet again. The purported “con job” of affordability faces a last-minute scramble to offer some relief on food, but health care risks loom large. Kaiser (KFF) is estimating +114% for increased premiums for marketplace enrollees. There is no shortage of independent research on the topic. In the end, the political spin can be set aside since the households just can open their mail and read the invoice for their “con job” payable. Without legislative action, the ACA issue will get ugly.
Among the strange drumbeats of recent days has been the trial balloon of a “Core 5” to bump G7. That made the rounds after the National Security Strategy (“NSS”) was circulated. When the market worries about the dollar, Russia sympathies, and trade disruptions, that is not the balloon to have floating around. We recommend a read of the NSS.
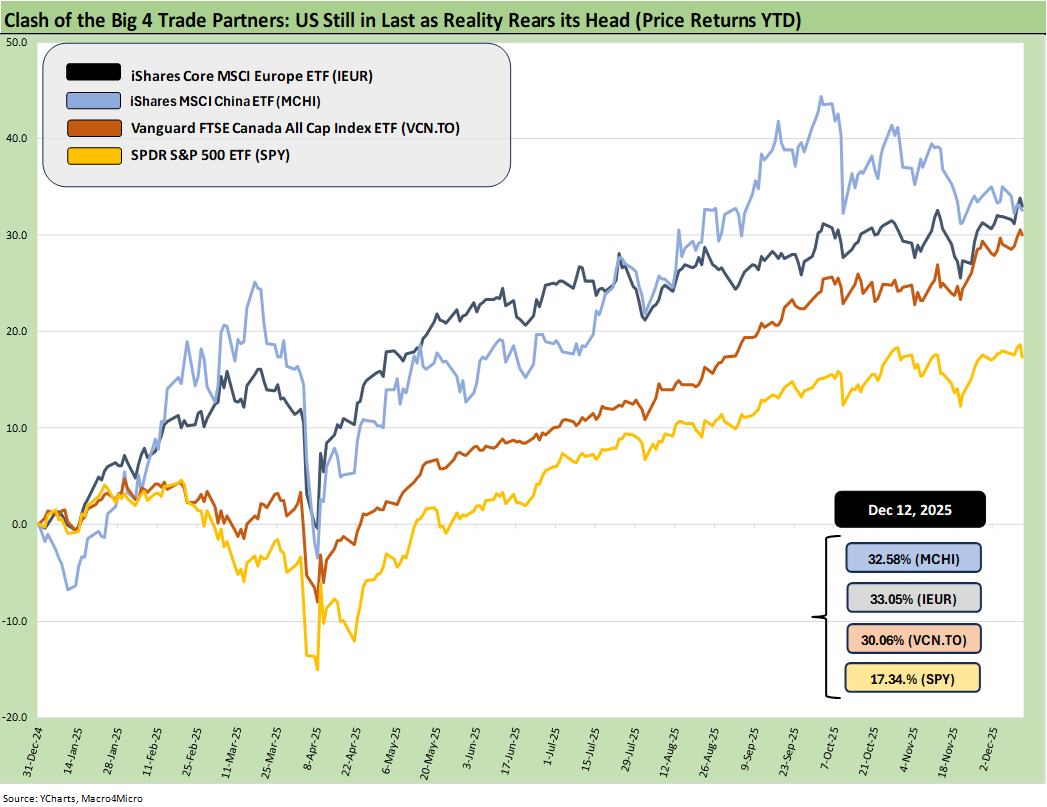
The above chart updates the running YTD returns for Big 4 trade partners’ equity markets (ex-Mexico) where the investor takes the currency risk as well as the macro and fundamental risk. That has been a rough story YTD for the US vs. China, Canada, and Europe with the US in dead last on dollar weakness. The rule of thumb is lower rates are a threat to the dollar and that is the same with political risk factors. The UST needs record demand from non-US investors (heavy hedging in 2025).
There are myriad threats still lurking for the dollar in the broad bucket of geopolitics and domestic political instability with an election year ahead and free elections and states’ rights under siege since the rejection of election results in 2020. The recurring attacks on the EU, the #1 trade partner, are a worry and getting worse. The EU is among the largest holders of UST bonds across a range of entities, and that makes for a lot of drama for economic ties - including UST investments.
We recommend a reading of the recently published National Security Strategy as it is revealing about how simple and inconsistent the Team Trump view of the world is at this point. Many of the points were internally inconsistent and also clash with what we see on the screen every day.
The most bizarre inconsistency was the importance of allies when the US threatens trade wars and routinely attacks the EU and Canada. That includes “thinking out loud” on annexation of NATO members in whole (Canada) or in part (Greenland/Denmark). The implied support of Russia is clear by way of action (what the White House does not say and won’t say). What can be dismissed in part as parlor trash talk takes on significance when the lenders to the US will be badly needed in coming years.
From G7 to “Core 5” with a “Closet Core 3”?
The idea of a Core 5 to supplant the G7 was another hot topic this past week just to add to the sense of drama and weirdness. We don’t see such issues as worth discounting into reality, but it is a sign of how many threats could lurk in the end markets that call for record demand for UST. The noise adds more questions around the dollar and how that can be sustained as the global currency in everything from commodities to aircraft. The dollar trend is a major risk factor on so many fronts. The most glaring and topical issue is what it means for the US buyers of imports (a weak dollar raises import costs already pressured by tariffs).
The new item on the screen of late was that the US might be looking to revamp the G7 into a new “Core 5” (“C5”) that excludes Europe – and Canada. Conspiracy theories (or empirically deduced logic) might see a Core 5 (comprised of the United States, China, Russia, India and Japan) as an authoritarian backdoor to a “New Triumvirate” and de facto authoritarian global structure under US, China and Russia. For its part, Russia boasts a GDP around the size of countries such as Italy, Canada, and Brazil. If nukes give you an automatic promotion, then more might look to join the nuke club.
A Core 5 gambit would risk a review of the USD as the currency of choice by the EU and Canada and would be a fresh hot topic alongside a likely review of borrowing limits in UST bonds (hit back where it hurts). Economic retrenchment in US dealings by a number of “former” G7 partners would not be far off, and that would spell trouble for yields in a period of record deficits. There will come a time when the EU and Canada each will stand up for their interests. For now, this Core 5 is background noise but has media sources claiming it as verified. That would be consistent with the Trump (and Musk) attacks on the EU.
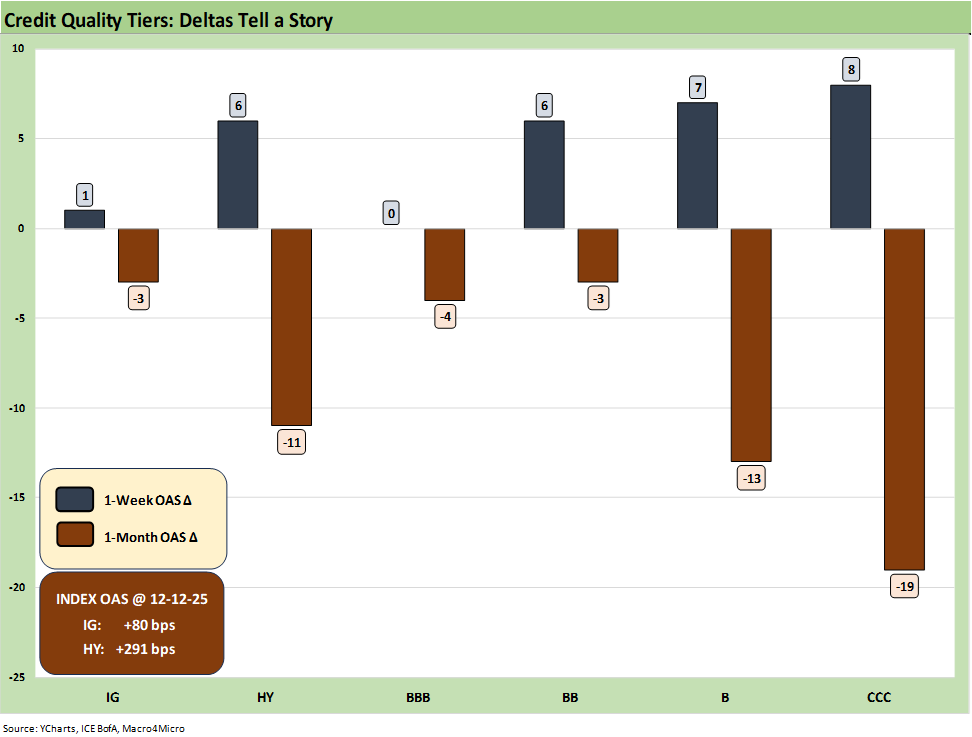
The above chart updates the 1-week and 1-month OAS deltas for IG and HY and from the BBB tier down to the CCC tier. The +80 bps for IG is around past credit cycle lows across history (see Credit Markets 12-1-25). Meanwhile, the HY OAS ended the week inside the highs of June 2007, which was the credit cycle peak and spread lows of the 1H07 credit bubble.
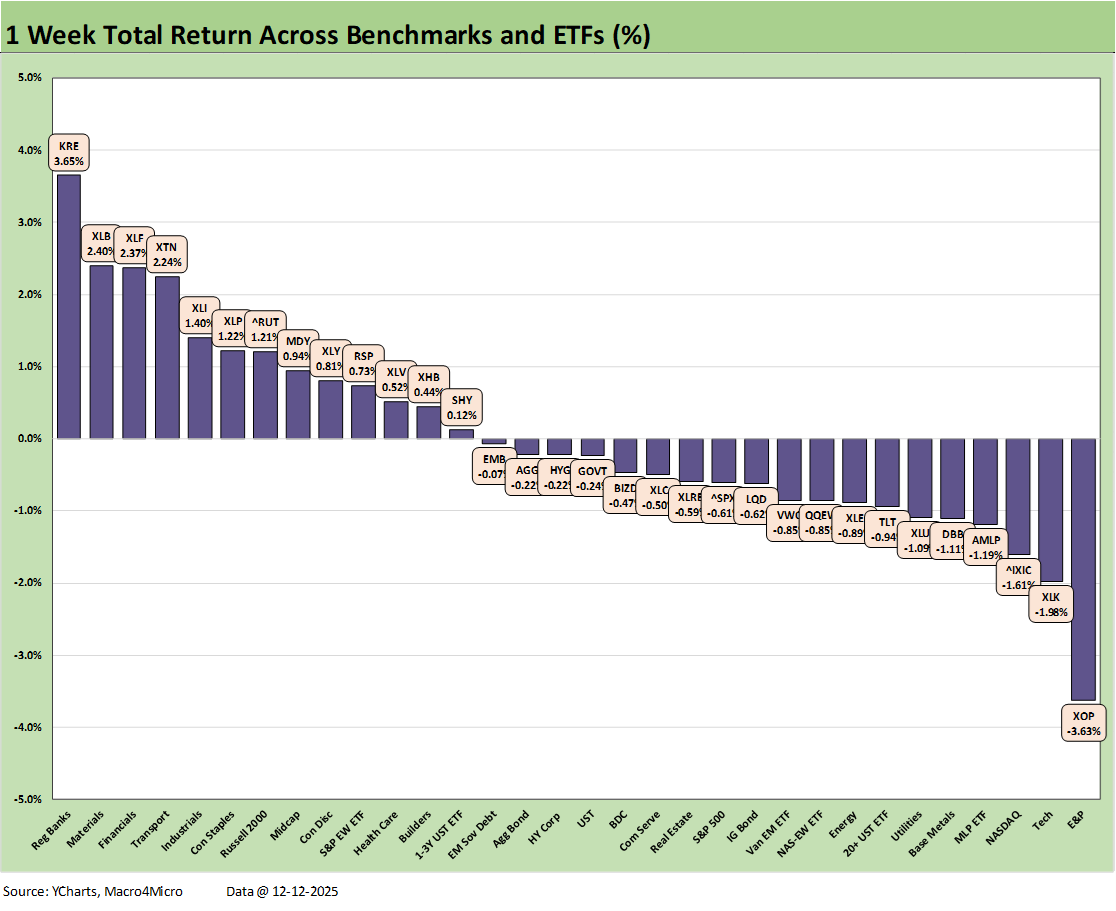
The above chart updates the 1-week returns for the 32 benchmarks and ETFs we monitor. The positive vs. negative score of 13-19 includes 6 of 7 bond ETFs in the red on the steepening of the UST curve. That includes higher rates from 5Y to 30Y this week. We detail the weekly UST curve deltas below.
The broad benchmarks are scattered across the quartile with the Russell 2000 (RUT) and Midcaps (MDY) in the top quartile. NASDAQ is in the bottom quartile placed 3 off the bottom. The S&P 500 is in the lower half of the 3rd quartile.
The Regional Banks (KRE) moved to #1 and Financials (XLF) to #3 on the easing of -25 bps and some votes of confidence in growth in the US economy as seen in the SEP report. The boost in median GDP growth to 2.3% from +1.8% in the Sept SEP report was another vote against recession risk.
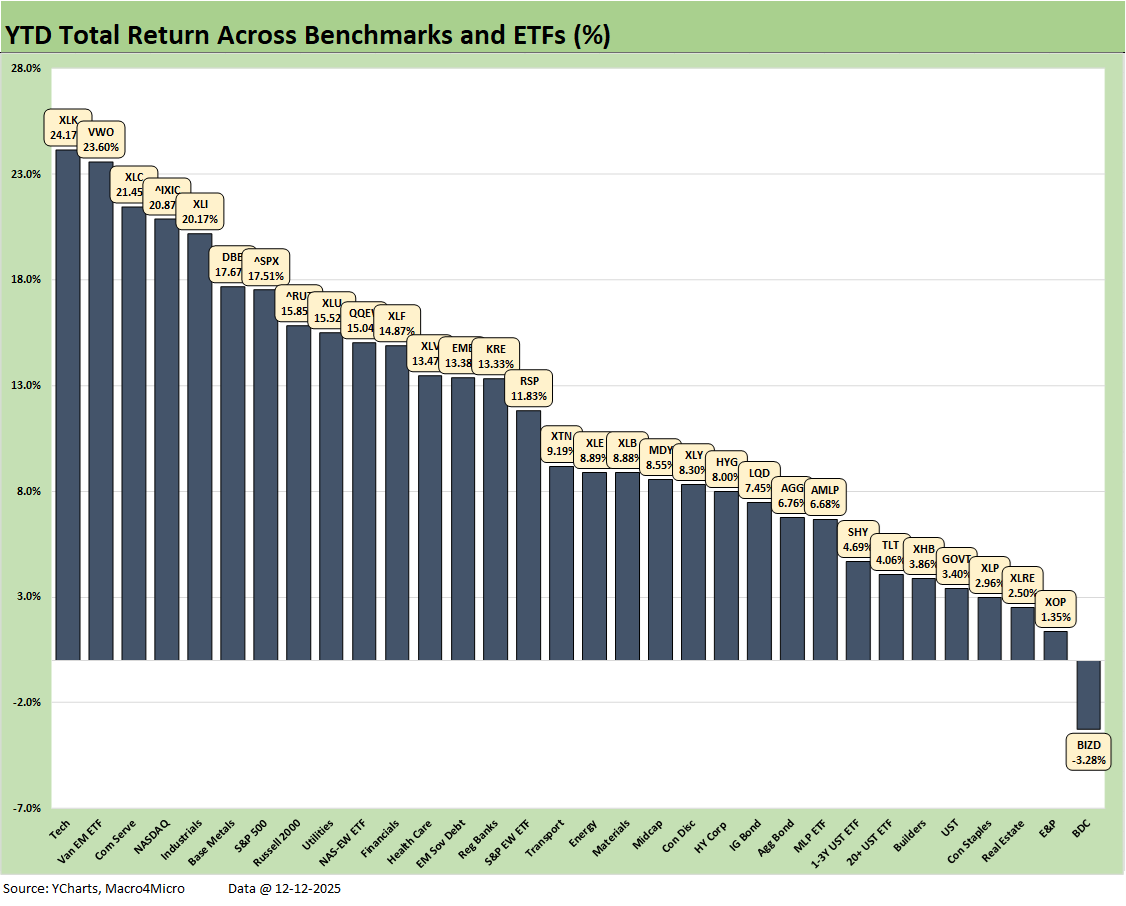
The above chart updates the YTD returns with a score of 31-1 and only the BDC ETF (BIZD) modestly in the red at -3.28%. Despite the recent volatility, tech-centric asset lines rule the YTD rankings with #1 Tech (XLK), #3 Communications Services (XLC), #4 NASDAQ, and #7 S&P 500 with its high tech-based concentration. For those looking for some diversity in the top quartile, we see Industrials (XLI), Base Metals (DBB), and the Russell 2000 small caps in the top quartile.
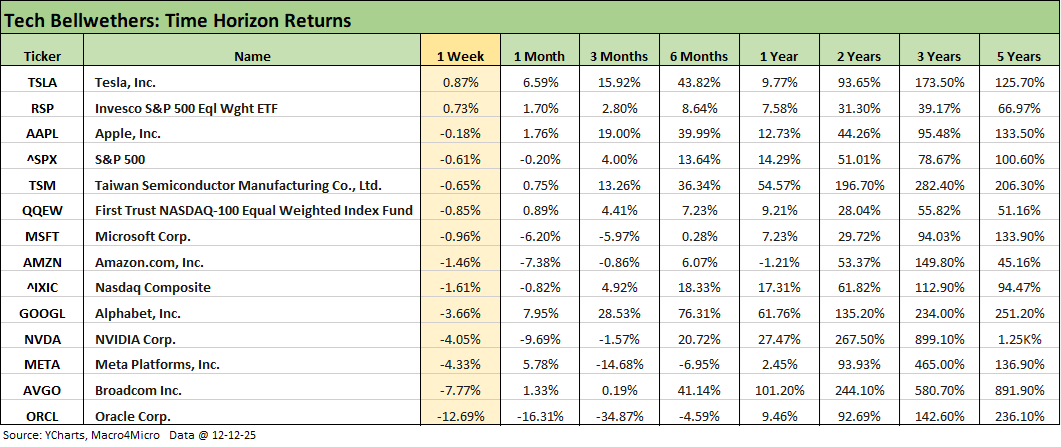
The above table updates the tech bellwethers with only one company stock turning in a slight positive with Tesla at +0.87% for the week. The only other line in positive range is the Equal Weight NASDAQ (QQEW). Oracle was pounded after earnings and Broadcom took a beatdown as well even if better than its peer. The score shows 6 of the Mag 7 in the red and 9 of the Mag 7+3 posting negative returns on the week.
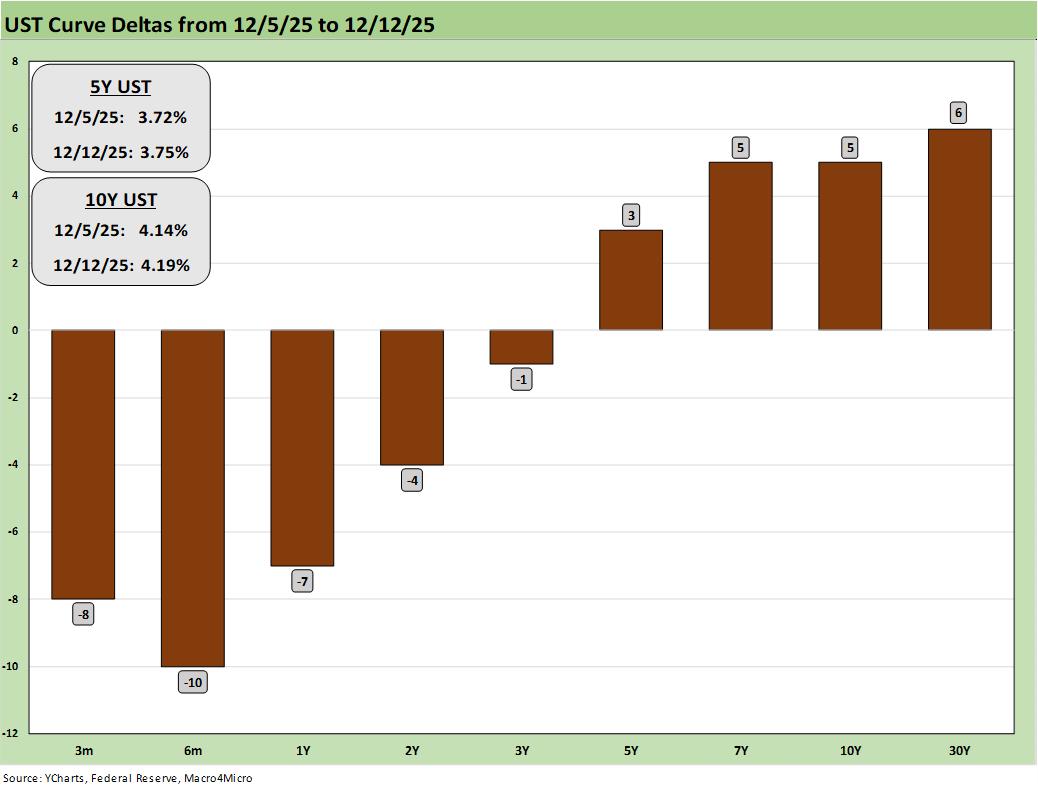
The above chart updates the weekly UST deltas with the impact of the -25 bps on the front end. The 5Y to 30Y shows a steepening with more positive GDP growth expectations from the Fed and flat expectations for the unemployment rates at 4.4%. That coupled with the slight downward revision for PCE inflation (headline and core) belies the extreme divergence across the dot plot (see FOMC: Dot Plot Scatters for 2026 12-10-25).
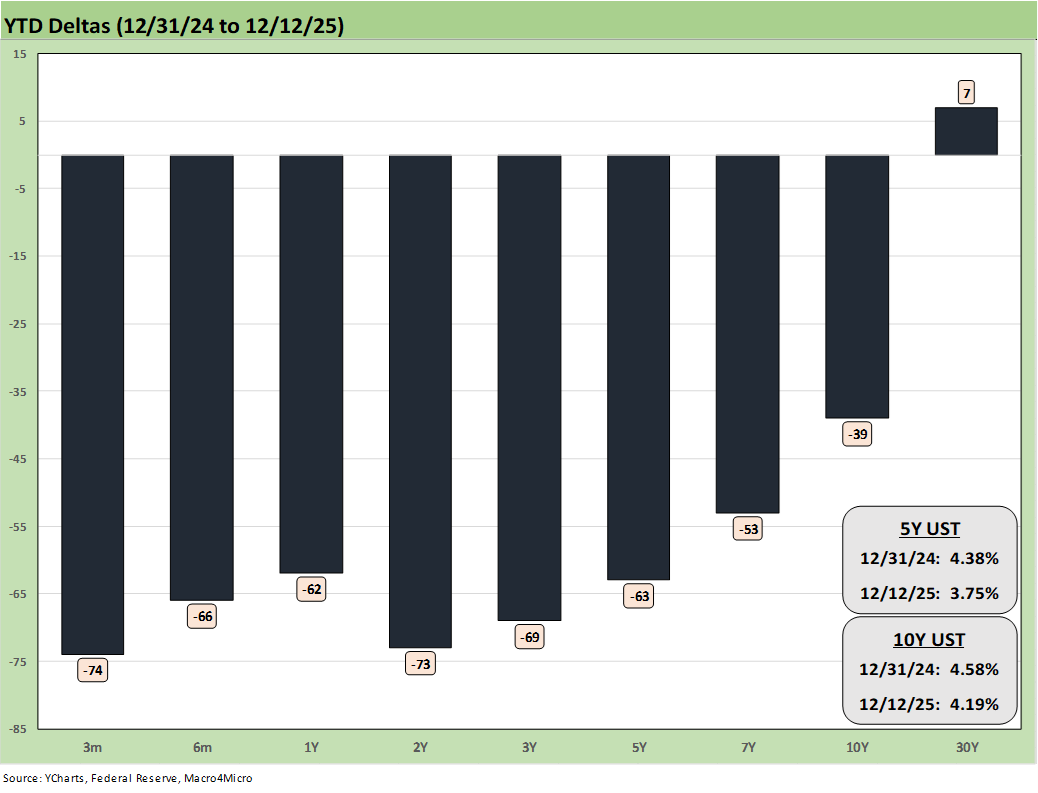
The above chart updates the YTD UST deltas in a reminder of why the bond ETFs turned in positive returns in 2025 but also how hard that will be to replay in 2026. The “duration call” remains a complicated one with tariffs and record borrowing demands. We still expect a 3M to 10Y steepener. The front end will be more controlled by politics and facts/concepts bending the knee to political whims in 2026. The obvious reality of impaired Fed independence could exacerbate the steepening impact out the curve.
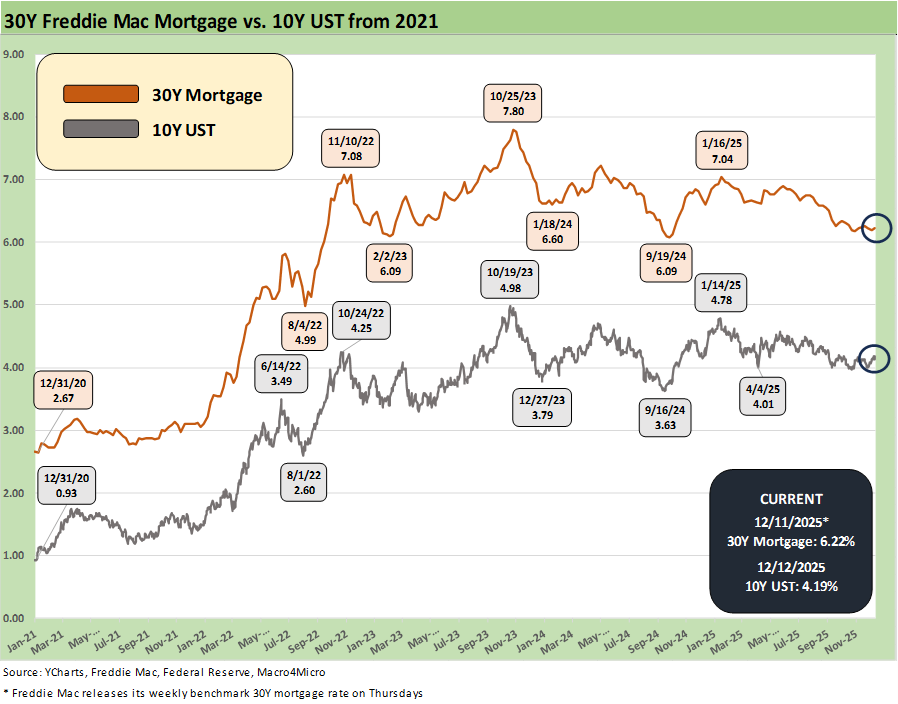
The above chart updates the Freddie Mac 30Y mortgage benchmark against the 10Y UST that drives the 30Y mortgage rate. The ability of lower fed funds after FOMC easing to drive mortgage rates lower has not had a good history in this recent easing cycle as we see in the chart. The rise in mortgages after the late 2024 easing actions has called such assumptions into question (and then some).
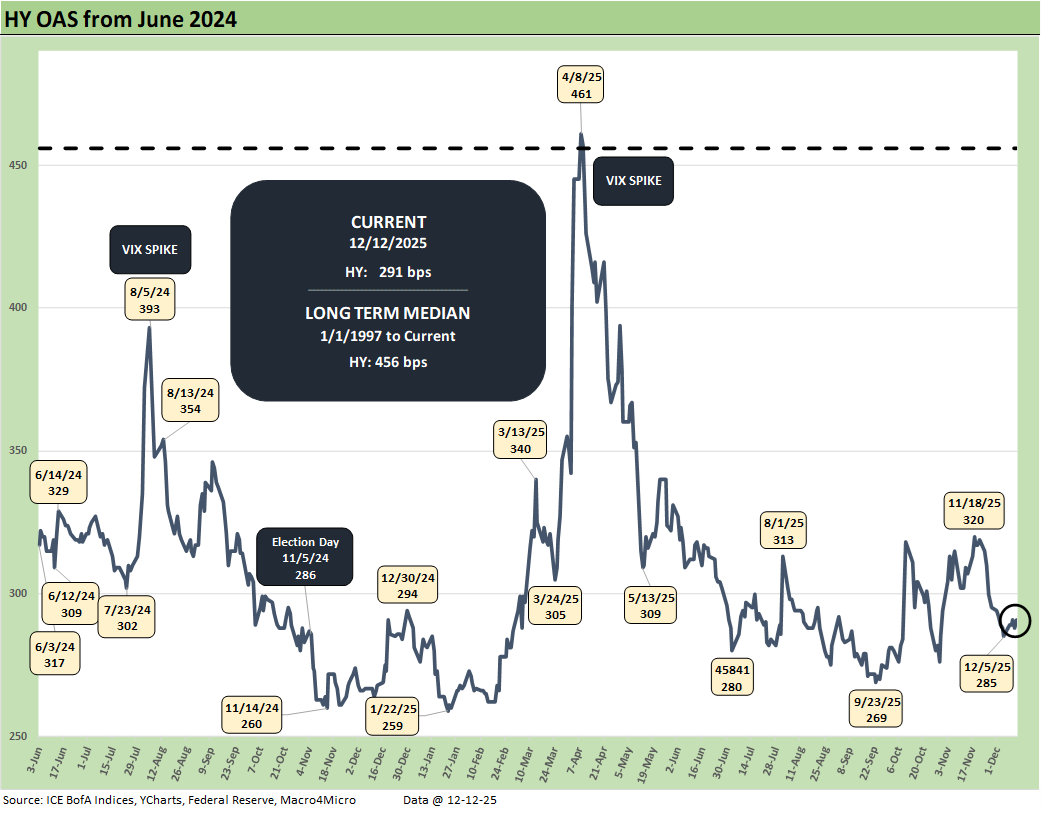
The above chart updates the running HY OAS levels with 6 bps of widening this week. That takes the YTD OAS delta to -1 bps tighter.
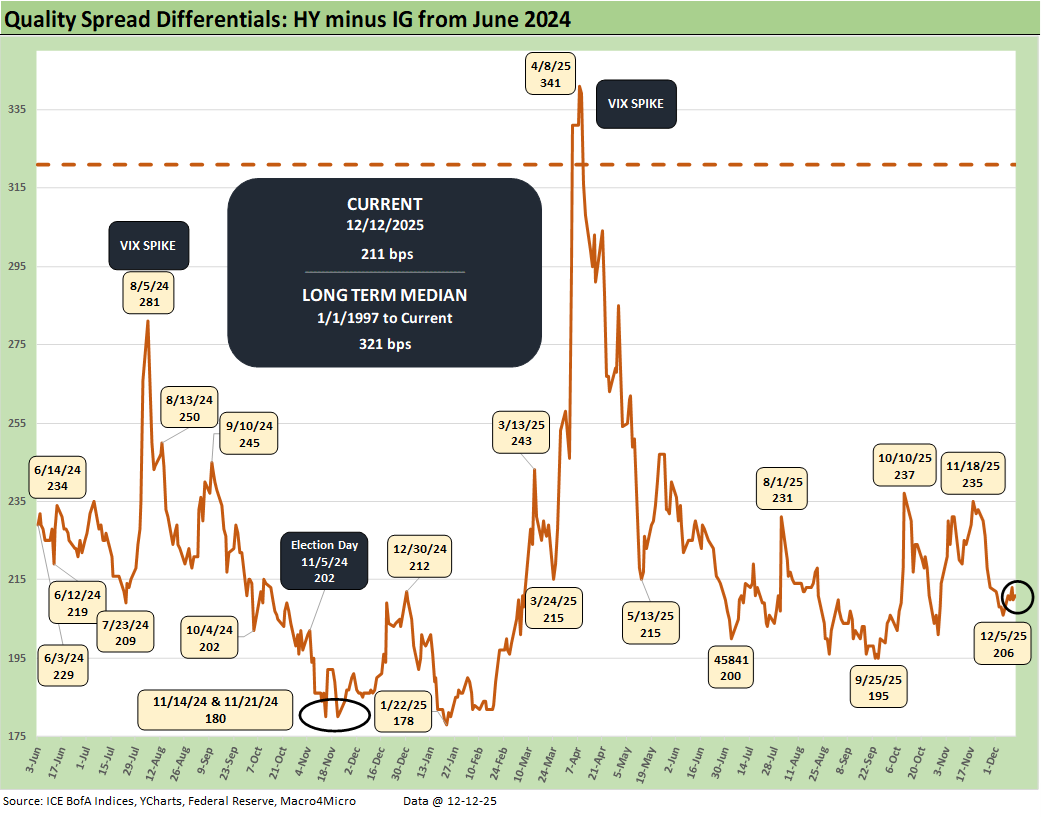
The above chart updates the “HY OAS minus IG OAS” quality spread differential with this week posting a +5 bps widening of the differential on +6 bps wider in HY and +1 bps wider in IG.
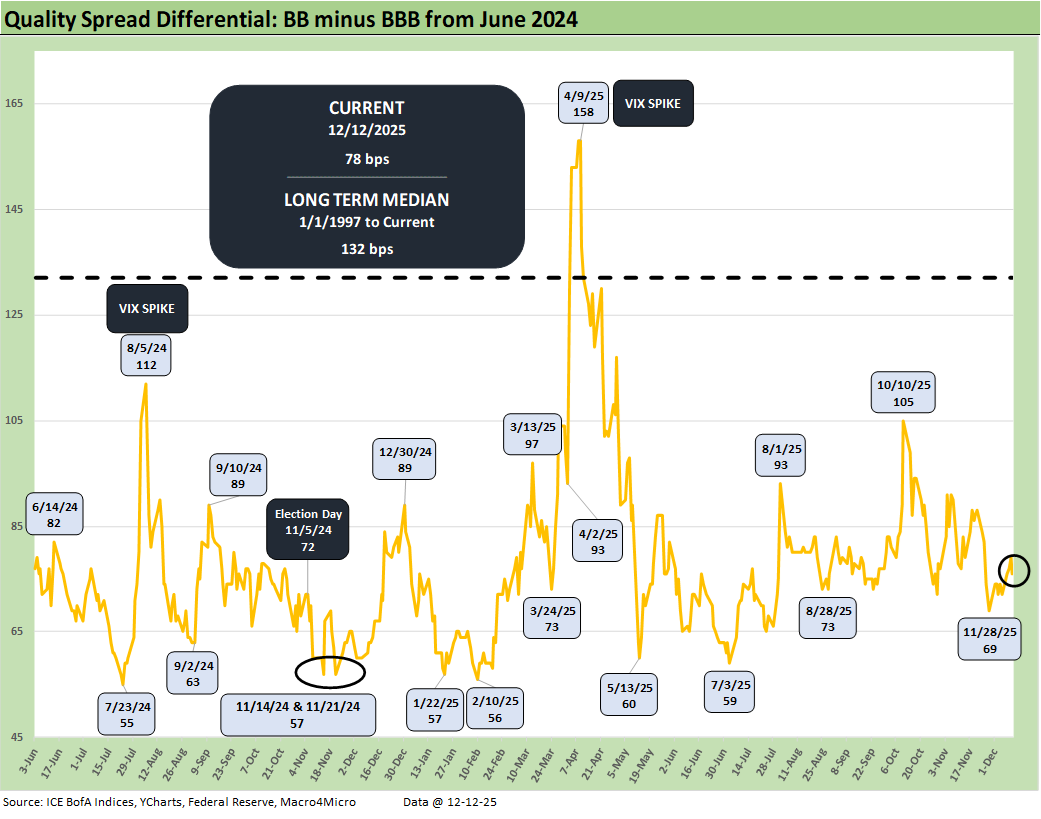
The above chart updates the “BB OAS minus BBB OAS” quality spread differential as it widened by +6 bps on the week with BB tier +6 bps wider and BBBs flat on the week.
See also:
FOMC: Dot Plot Scatters for 2026 12-10-25
Employment Cost Index 3Q25: Slowing but Above CPI 12-10-25
JOLTS: Goldilocks’ Ugly Twin 12-9-25
Market Commentary: Asset Returns 12-7-25
Mini Market Lookback: Data Digestion 12-6-25
PCE, Income & Outlays: Calendar Gap Closing 12-5-25
Credit Markets 12-1-25
Mini Market Lookback: Back into the June 2007 Zone 11-29-25
Durable Goods Sep 2025: Quiet Broadening of Core Capex 11-26-25
Retail Sales September 2025: Foot off the Gas 11-25-25The Curve: Flying Blind? 11-24-25
Mini Market Lookback: FOMC Countdown 11-23-25
Employment Sept 2025: In Data We Trust 11-20-25
Payrolls Sep25: Into the Weeds 11-20-25
Mini Market Lookback: Tariff Policy Shift Tells an Obvious Story 11-15-25
Retail Gasoline Prices: Biblical Power to Control Global Commodities 11-13-25
Simplifying the Affordability Question 11-11-25
Mini Market Lookback: All that Glitters… 11-8-25
Mini Market Lookback: Not Quite Magnificent Week 11-1-25
Synchrony: Credit Card Bellwether 10-30-25
Existing Home Sales Sept 2025: Staying in a Tight Range 10-26-25
Mini Market Lookback: Absence of Bad News Reigns 10-25-25
CPI September 2025: Headline Up, Core Down 10-24-25
General Motors Update: Same Ride, Smooth Enough 10-23-25
Mini Market Lookback: Healthy Banks, Mixed Economy, Poor Governance 10-18-25