
Mini Market Lookback: Back into the June 2007 Zone
A strong finish to November does not change a mediocre month in equities, but HY OAS is again back inside where June 2007 ended.


Directions or a weather vane?
The HY markets have remained resilient and rallied back into the upper end of the June 2007 range in the sub-300 bps zone. More of the recent credit cycle anxiety has been looking over at the private credit market with its mix of highly leveraged transactions and higher cost of debt for borrowers. HY bonds tightened by -24 bps on the week. That is still +19 bps wider over the 1-month timeline. The HY index OAS had hit +276 bps in late October.
Tech equities have had a rough ride on the mix of perceived excess of valuations and questions around longer term AI economic expectations. The uncertainty around payrolls seems to have again shifted the odds for -25 bps in the Dec 9-10 FOMC decision. Credit risk chatter has also picked up around names such as Oracle and the need for more tech leaders to borrow more (whether debt is on or off issuer balance sheets) to meet infrastructure demands.
The S&P 500’s 11 sectors posted an 11-0 positive vs. negative score for 5 days while posting 5-6 for the rolling 1-month timeline and 7-4 for 3 months. With Tech (35.8% of the index) and Communications Services (10.5%), Financial Services (13.2%), and Consumer Cyclicals (10.7%) of the S&P 500, it is not hard to gauge how important payrolls and the FOMC actions will be into year end and early 2026. The tech valuation debate gets impacted by rates but the “AI boom themes” and belief in the revenue growth potential is more complex.
With around 1 month left to run in 2025, the YTD IG index total return at +8.1% is still ahead of the HY index total return at +7.8% YTD. The bull steepener of the UST curve has trumped the excess return component with spreads mired in the lower range of past credit cycles but with running coupons sweetening the pot after so many low coupons printed in the ZIRP and QE years.
The absence of comprehensive inflation and payroll data is a challenge to informed decision-making with no October payroll and CPI data planned. The adverse MoM PPI readings of the past week got very little headline play. We speculate the White House does not mind the lack of data, which raises other issues. The advance 3Q25 GDP estimate is supposedly going to be released on Dec 23.
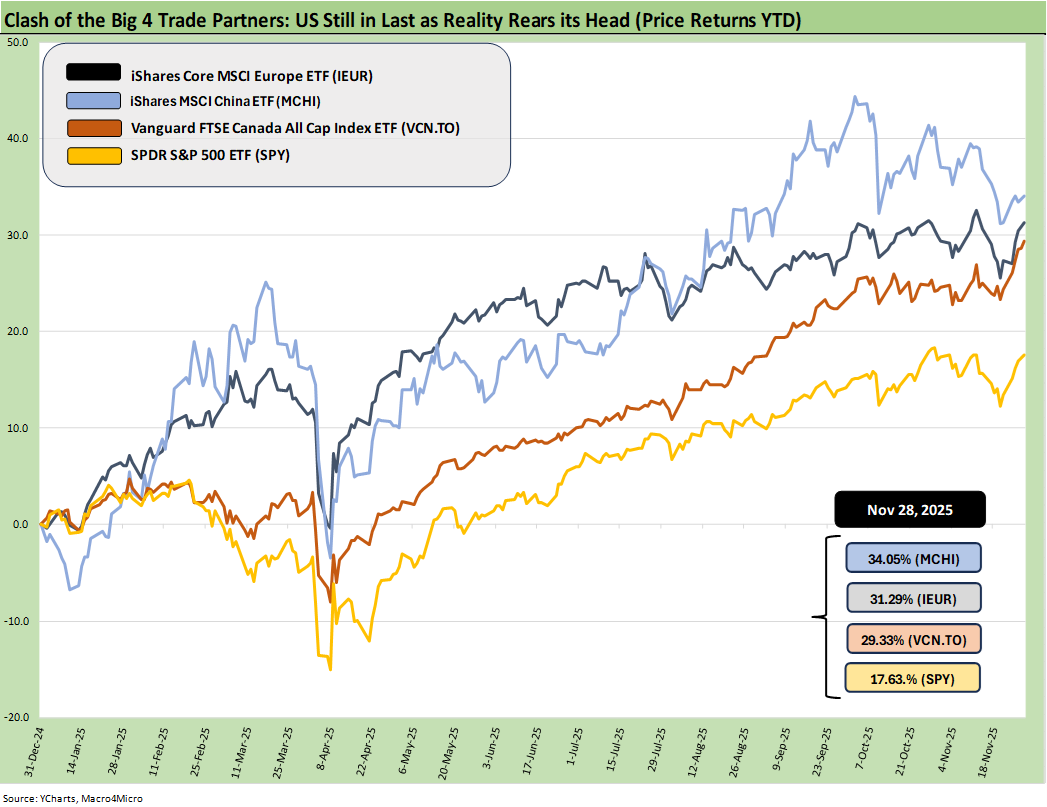
Our usual lead chart did not bring much new input in terms of direction. The chart updates the YTD returns for some bellwether index ETFs for the Big 4 developed market trading partners – the US, Europe, China, and Canada. The aim of the chart is to plot some ETFs that tell a market story for US investors thinking about global diversification. These ETFs are just a useful sample that uses relevant broad market indexes for each region as snapshots.
The goal of this chart is to capture the balance of risks across the broad mix of macro trends (economy, currency) and the sea level industry and company fundamentals rolled up into a US traded ETF. Once again, the US placed dead last YTD with the heavy influence of the dollar decline in 2025. The last week saw the DXY slightly weaken to 99.5 (100.2 on 11-21). That contrasts with the 96-handle 52-week low of Sept 2025 and the 110-handle high of Jan 2025.
The dollar has been on the mend in recent weeks after the worst YTD stretch since the 1970s. The price action is likely to remain an X factor as the direction of interest rates and the FOMC still signal uncertainty just watching the FedWatch gyrations the past two weeks.
The rule of thumb is the dollar stays firm or will strengthen when the US economic indicators are strong with UST rates stubborn or higher. For now, the consensus is for easing with the FedWatch at 86.4% as we go to print.
The political disarray and relative instability of Washington in 2025 has set the stage for trouble in 2026 (election attacks/denial, soldiers in the street, authoritarian leaning White House with GOP and SCOTUS tacit support, the optics of ICE violence). Such risks have raised some unusual issues for the dollar. The local currency-exposed ETFs thus make for a more complex set of inputs into 2026.
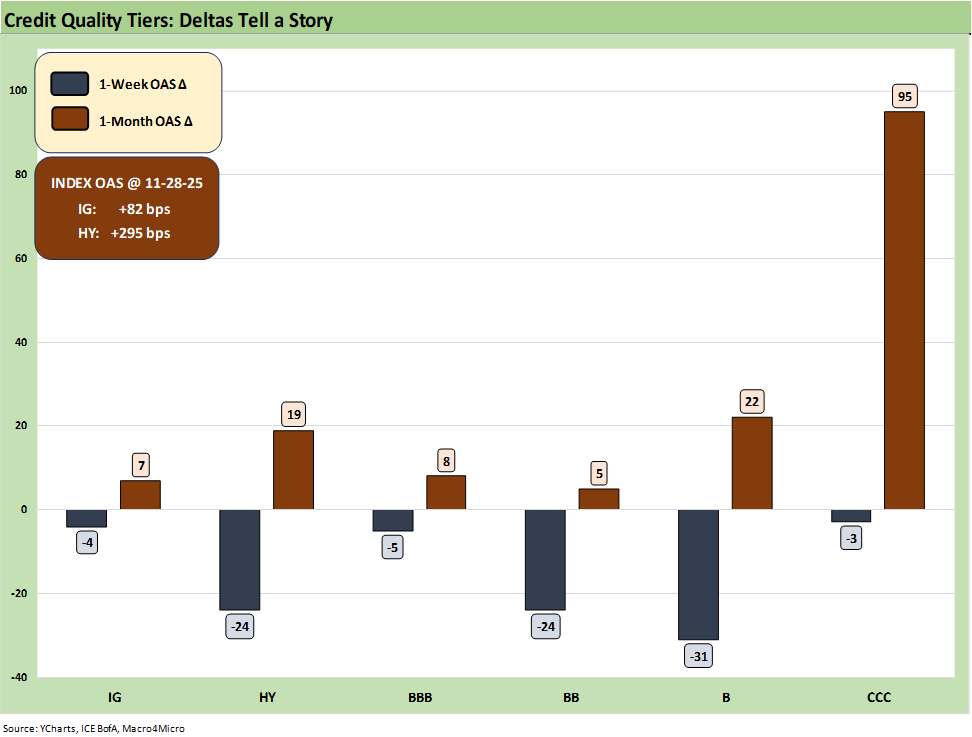
The above chart updates running 1-week and 1-month credit spread deltas for IG and HY. Spreads were back in rally mode this week and notably in HY at -24 bps with IG at -4 bps. Despite a rally week, HY is +19 bps wider for the trailing 1-month period and IG +7 bps wider.
The absolute HY spread levels at +295 bps are still in line with most past historical lows and just under the high end of the bubble month of June 2007. The HY Index OAS is now +3 bps wider for the YTD period while IG is flat YTD.
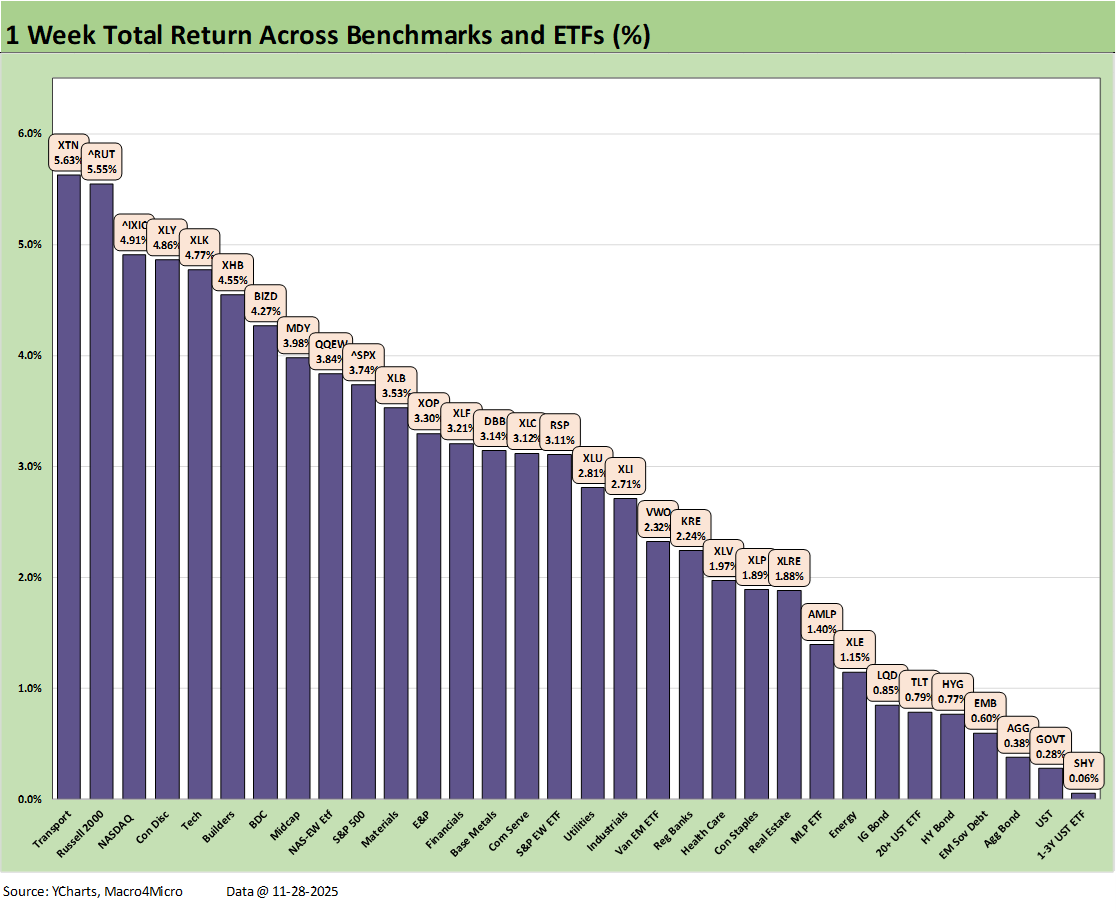
The above chart shows the weekly returns in a quiet, holiday-shortened week as the rally delivered the first all positive shutout performance for a while with equities and the UST curve both rallying.
We see Transports (XTN) at #1 with the small cap Russell 2000 bouncing back at #2 with NASDAQ #3 and Midcaps just edging into the top tier. The S&P 500 had a very good week with all 11 sectors positive but not enough to make it across the line into the top quartile. We see some recent stragglers such as BDCs (BIZD) and Homebuilders (XHB) in the top quartile.
While all bond ETFs were positive on a very mild curve move, we see short UST on the bottom and the 7 bond ETFs all positive even with all 7 in the bottom quartile.
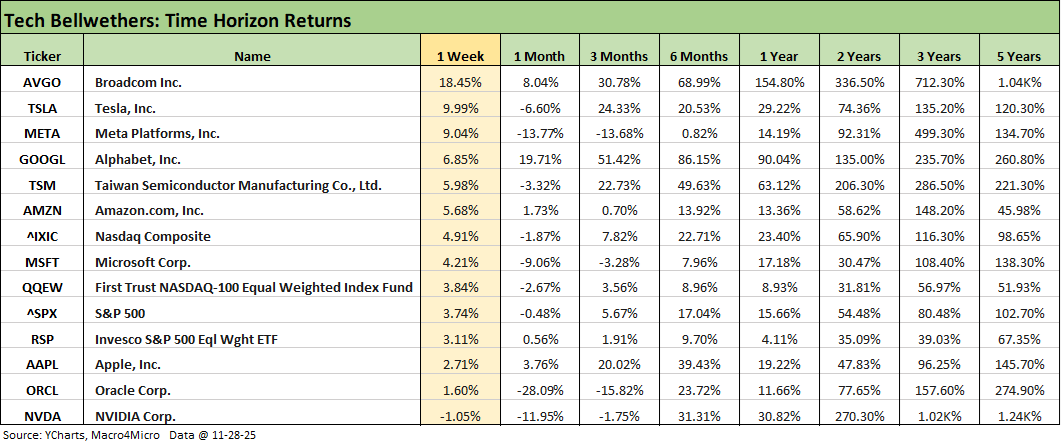
The above chart updates the tech bellwethers in a rebound week with all positive except NVIDIA with a small negative. The trailing 1-month is a bit uglier with 4 of the Mag 7 negative and 6 of the “Mag 7+3” in the red (+7+3 adds Broadcom, Taiwan Semi, and Oracle).
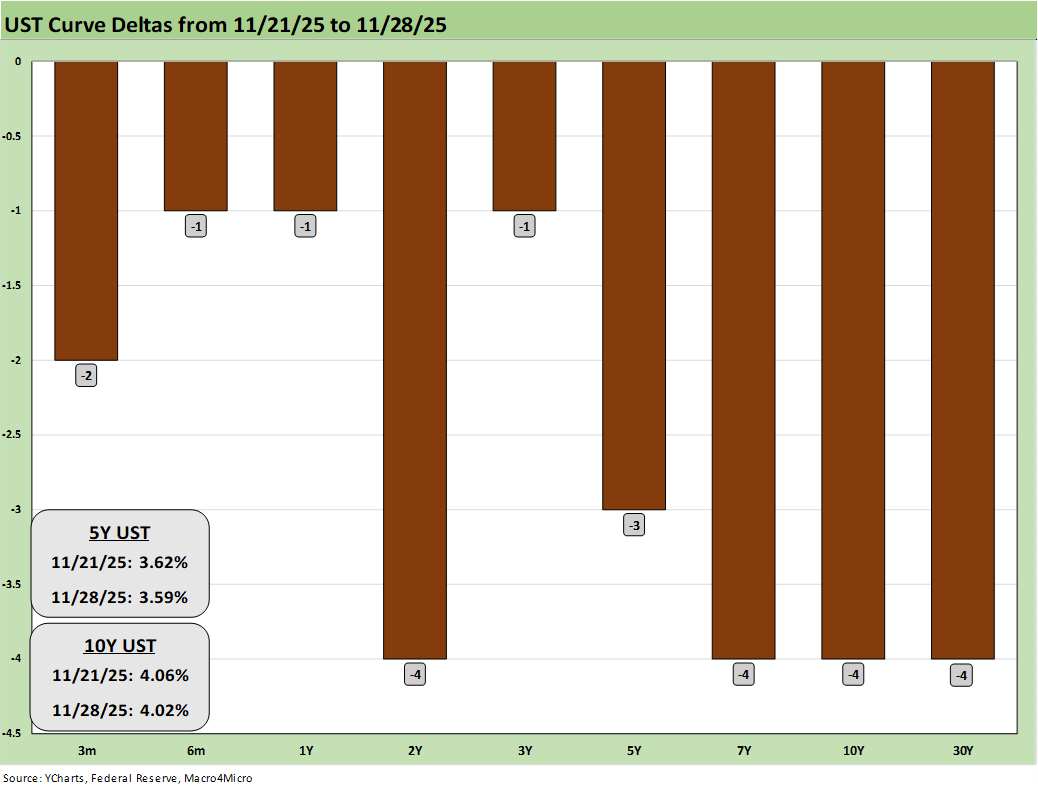
The above chart updates a mild rally week as seen in the UST deltas . The 10Y UST has remained in a very tight range around the 4.0% line and ended at +4.02%.
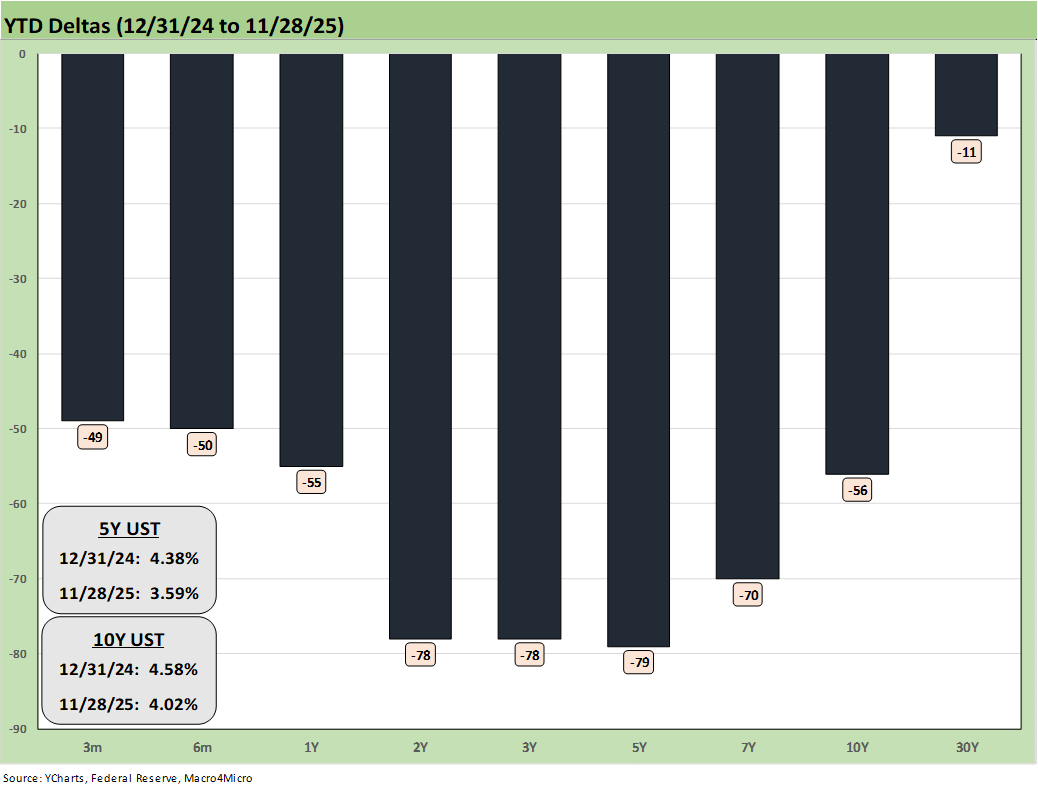
The above chart updates the YTD bull steepener that has kept all bond ETFs in positive return range during 2025.
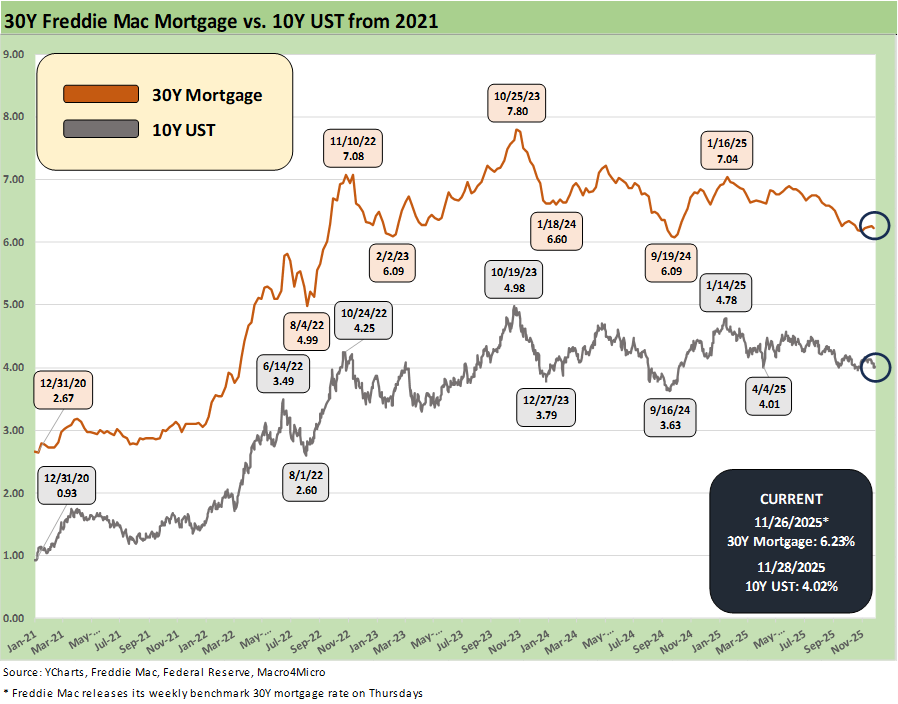
The above chart updates the 10Y UST vs. the 30Y Freddie Mac mortgage. With the 10Y UST fighting to break through the 4% line, the 30Y mortgage rate is going to have a hard time cracking through 6%.
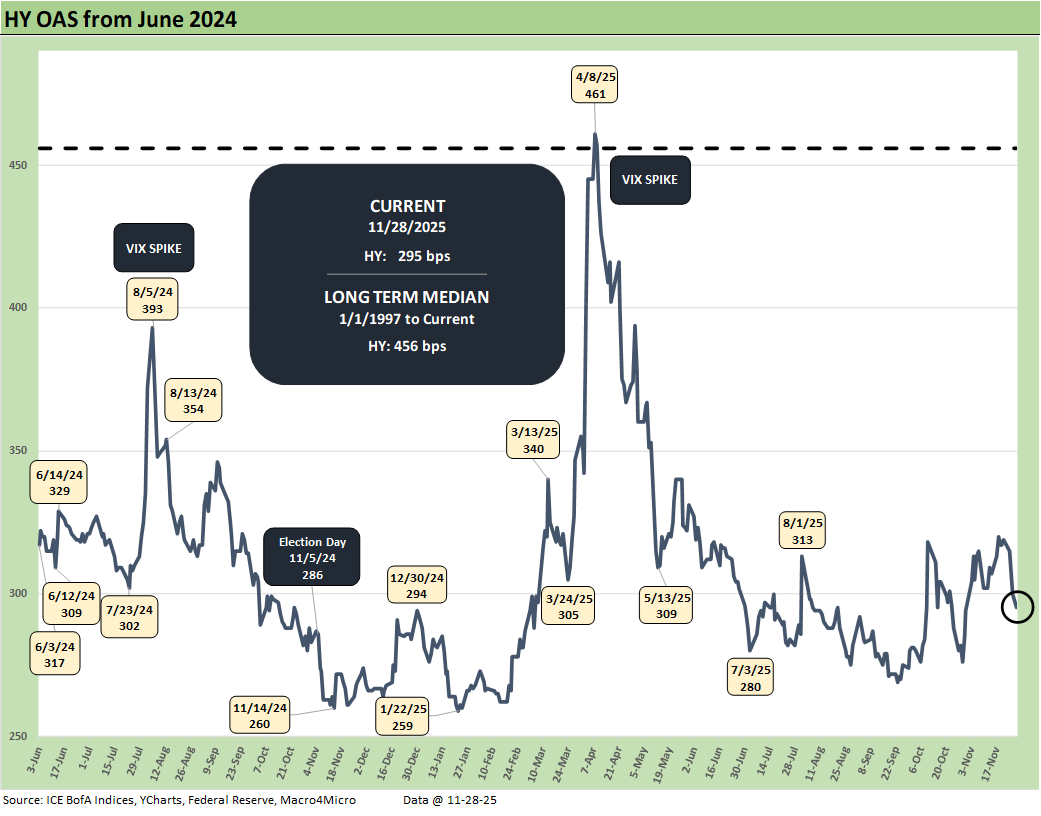
The above chart highlights the rally in the US HY index OAS by -24 bps to +295 bps from +319 bps in what was a relatively quiet week (for “events”) with the holiday and shortened hours of market trading. The strong rally in equities for the week helped.
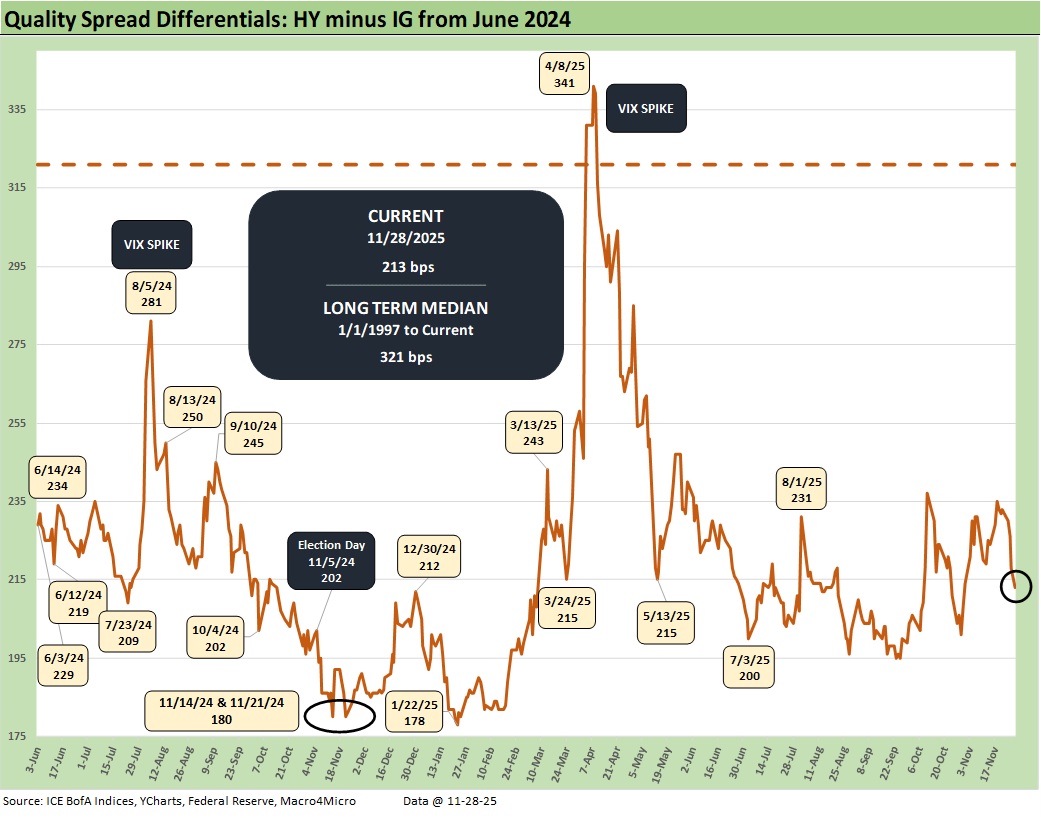
The HY OAS minus IG OAS quality spread differential tightened by -20 bps from +233 bps to +213 bps on the HY spread compression of -24 vs. the IG spread compression of -4 bps.
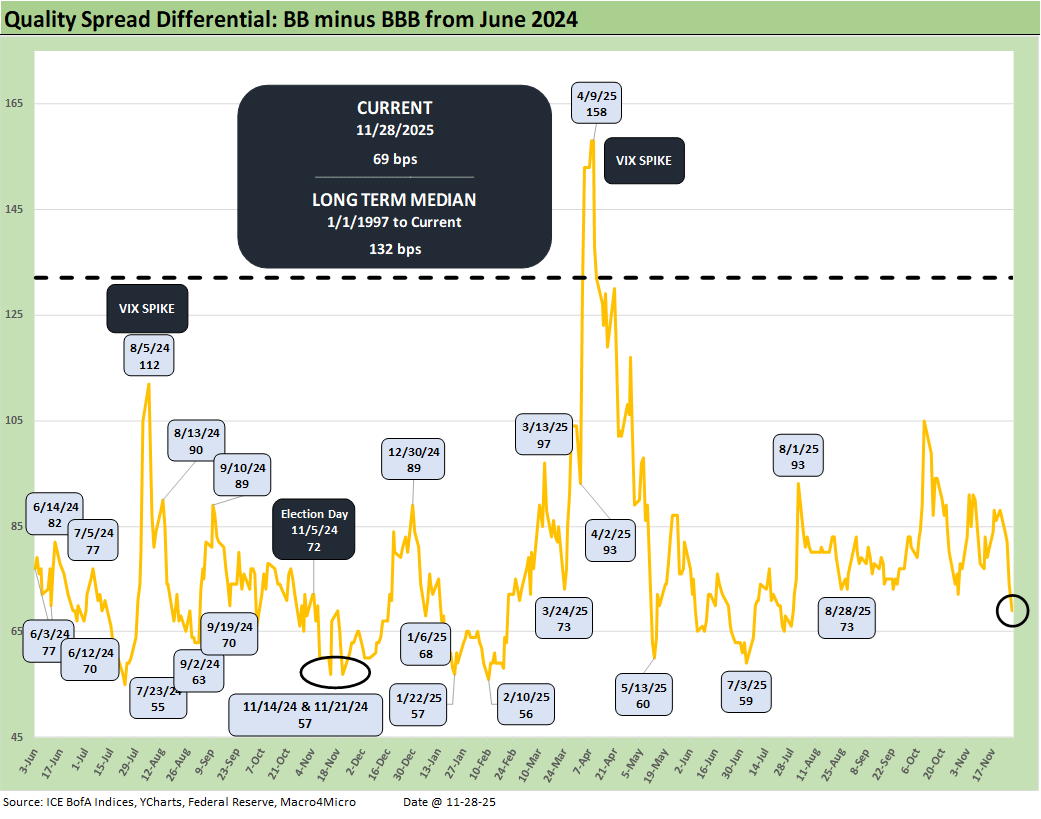
The quality spread differential along the speculative grade divide of BB vs. BBB also compressed by -19 bps from +88 bps last week to +69 bps. The -24 bps rally in the BB tier vs. -5 bps in the BBB tier drove the tightening.
See Also:
Durable Goods Sep 2025: Quiet Broadening of Core Capex 11-26-25
Retail Sales September 2025: Foot off the Gas 11-25-25
The Curve: Flying Blind? 11-24-25
Market Commentary: Asset Returns 11-23-25
Mini Market Lookback: FOMC Countdown 11-23-25
Employment Sept 2025: In Data We Trust 11-20-25
Payrolls Sep25: Into the Weeds 11-20-25
Credit Markets: Show Me the Data 11-17-25
The Curve: Slopes Can Get Complicated 11-16-25
Mini Market Lookback: Tariff Policy Shift Tells an Obvious Story 11-15-25
Retail Gasoline Prices: Biblical Power to Control Global Commodities 11-13-25
Credit Markets: Budget Armistice or GOP Victory Day? 11-12-25
Simplifying the Affordability Question 11-11-25
The Curve: Back to the Future 11-9-25
Market Commetary: Asset Returns 11-9-25
Mini Market Lookback: All that Glitters… 11-8-25
Mini Market Lookback: Not Quite Magnificent Week 11-1-25
Synchrony: Credit Card Bellwether 10-30-25
Existing Home Sales Sept 2025: Staying in a Tight Range 10-26-25
Mini Market Lookback: Absence of Bad News Reigns 10-25-25
CPI September 2025: Headline Up, Core Down 10-24-25
General Motors Update: Same Ride, Smooth Enough 10-23-25
Mini Market Lookback: Healthy Banks, Mixed Economy, Poor Governance 10-18-25
Mini Market Lookback: Event Risk Revisited 10-11-25
Credit Profile: General Motors and GM Financial 10-9-25
Mini Market Lookback: Chess? Checkers? Set the game table on fire? 10-4-25
JOLTS Aug 2025: Tough math when “total unemployed > job openings” 9-30-25
Mini Market Lookback: Market Compartmentalization, Political Chaos 9-27-25
PCE August 2025: Very Slow Fuse 9-26-25