
Market Commentary: Asset Returns 12-14-25
2025 winds down with a mixed story line as evident in the dot plot, UST dynamics, and the sector rotation themes.


Did someone just nuke Europe? Where’s Vance?
The only risks to worry about these days are domestic political instability, geopolitics, global trade, inflation, and payroll anxiety. Here is an idea: let’s unwind the G7 and create a “C5” that excludes the EU and Canada, throw Ukraine under the tank, start a war in Venezuela and, while we’re at it, undermine the investigation of Epstein. After all, we just saved a lot of money on healthcare premium support (see Market Lookback: FOMC Fragments, Rate Debates Murky 12-13-25).
The FOMC easing, the SEP, and an abstract dot plot pattern underscore a bit of confusion as to how the long end of the curve should play out ahead of what will be a contentious year in policy setting. The median forecast is for a single fed funds cut, but that median is within a wide range. At the same time, the unemployment median stayed unchanged while inflation forecasts ticked lower for PCE (both core and headline) even if +0.4% above target for headline and +0.5% for core PCE.
With Warsh seemingly now in pole position for Fed chair ahead of Hassett, the White House may be aiming for better credibility, more intellectual firepower, and a resume with actual real-world experience (even if likely to be just as blindly obedient). That scenario means conditions are in place for UST steepening into 2026.
The UST curve steepening from 5Y to 30Y this past week hit bond ETFs and offered a reminder to the housing sector to not get overly optimistic on 30Y mortgage rates subject to the coming risks of inflation. The late 2024 easing aftermath offers little support.
The Fed SEP report bumped up GDP growth by another 0.5% while there are plenty of schools of thought that 2026 is when the pricing pressure gets rolled into tariff cost mitigation strategies if demand stays solid. The GDP forecasts are signaling decent demand and thus some pricing power. The White House and cabinet messaging on “growth vs. inflation” is running into some “If A, then B” conceptual inconsistencies (e.g. Lutnick’s 4.0% GDP growth rate with lower inflation).
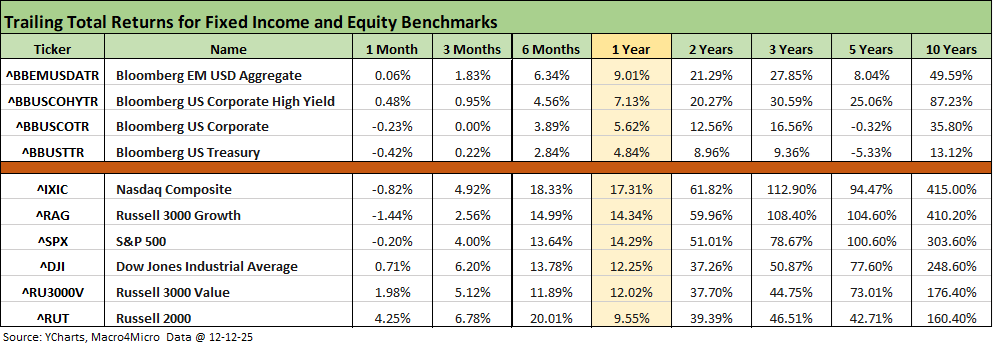
The above table updates the high-level debt and equity benchmarks we monitor. We see a challenging trailing 1-month period for duration, growth stocks and tech as the NASDAQ and S&P 500 struggled. The good news is the Russell 2000 small caps posted some good numbers continuing what has been a very strong 6-month run for small caps at just over +20%. For bonds, duration has faced headwinds while spreads remained tight across the period.
The rolling return visual
In the next section, we get into the details of the 32 ETFs and benchmarks for a mix of trailing periods. Below we offer a condensed 4-chart view for an easy visual on how the mix of positive vs. negative returns shape up. This is a useful exercise we do each week looking for signals across industry groups and asset classes.
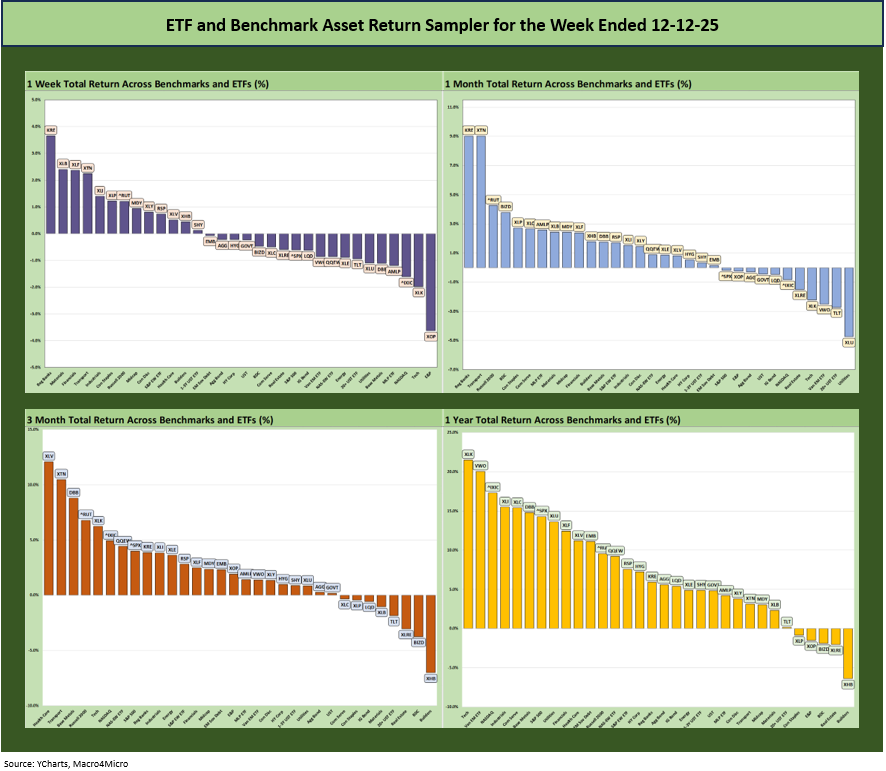
The above chart offers an easy visual reminder of a positive return mix in the benchmarks and ETFs for 3-months, YTD (not shown) and LTM returns. The market is wrapping up its third year of very strong numbers in the large cap benchmarks especially (see Footnotes & Flashbacks: Asset Returns for 2024 1-2-25).
The Magnificent 7 heavy ETFs…
Some of the benchmarks and industry ETFs we include have issuer concentration elements that leave them wagged by a few names. When looking across some of the bellwether industry and subsector ETFs in the rankings, it is good to keep in mind which narrow ETFs (vs. broad market benchmarks) get wagged more by the “Magnificent 7” including Consumer Discretionary (XLY) with Amazon and Tesla, Tech (XLK) with Microsoft, Apple, and NVIDIA, and Communications Services (XLC) with Alphabet and Meta.
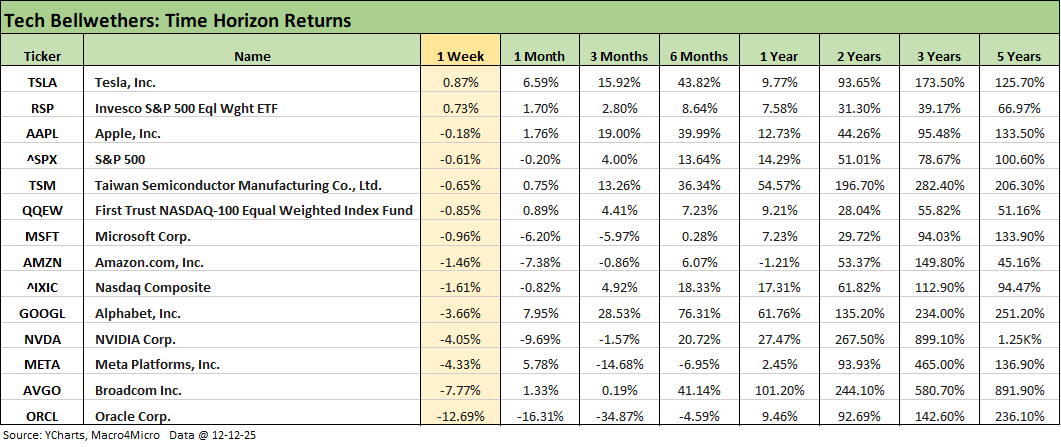
We already looked at the tech bellwethers in our Market Lookback: FOMC Fragments, Rate Debates Murky (12-13-25). When you have a single name in positive range (Tesla) with 6 of the Mag 7 in the red along with 9 of the Mag 7+3, it has not been a good week for the growth story lines and valuations.
Oracle and Broadcom did not cure any anxieties with their earnings reports. Oracle has now underperformed the S&P 500 looking back 1 year and in. The market has been buzzing more about Oracle’s growing debt burden of late with record capex and more borrowing ahead.
The topic of debt was cited a few times in the Oracle earnings call. The essence of the message was as follows:
“In terms of funding our growth, there are a variety of sources available to us throughout our debt structure in public bond, bank and private debt markets. In addition, there are other financing options through customers that may bring their own chips to be installed in our data centers and suppliers who may lease their chips rather than sell them. Both of these options enable Oracle to synchronize our payments with our receipts and borrow substantially less than those people are modeling. As a foundational principle we expect and are committed to maintaining our investment-grade debt rating.”
The idea of vendor financing from chipmakers and customers was not reassuring. That feeds the circular story line and brings back memories of the late 1990s. The commitment to IG ratings is one thing, but the market will be watching closely to see if the reality of cash flows set against the demands in capex will cooperate with the credit metrics goals they have set for IG ratings.
The supply of Oracle bonds has been soaring and the need for on and/or off-balance sheet debt remains a highlight in the broader AI-themed subsectors (services, chips, related infrastructure and equipment, data centers, etc.). Overall, the earnings and capex cycle tells a story of very demanding funding needs. The stories will unfold, and the credit metrics will get scrutinized by the markets and the rating agencies.
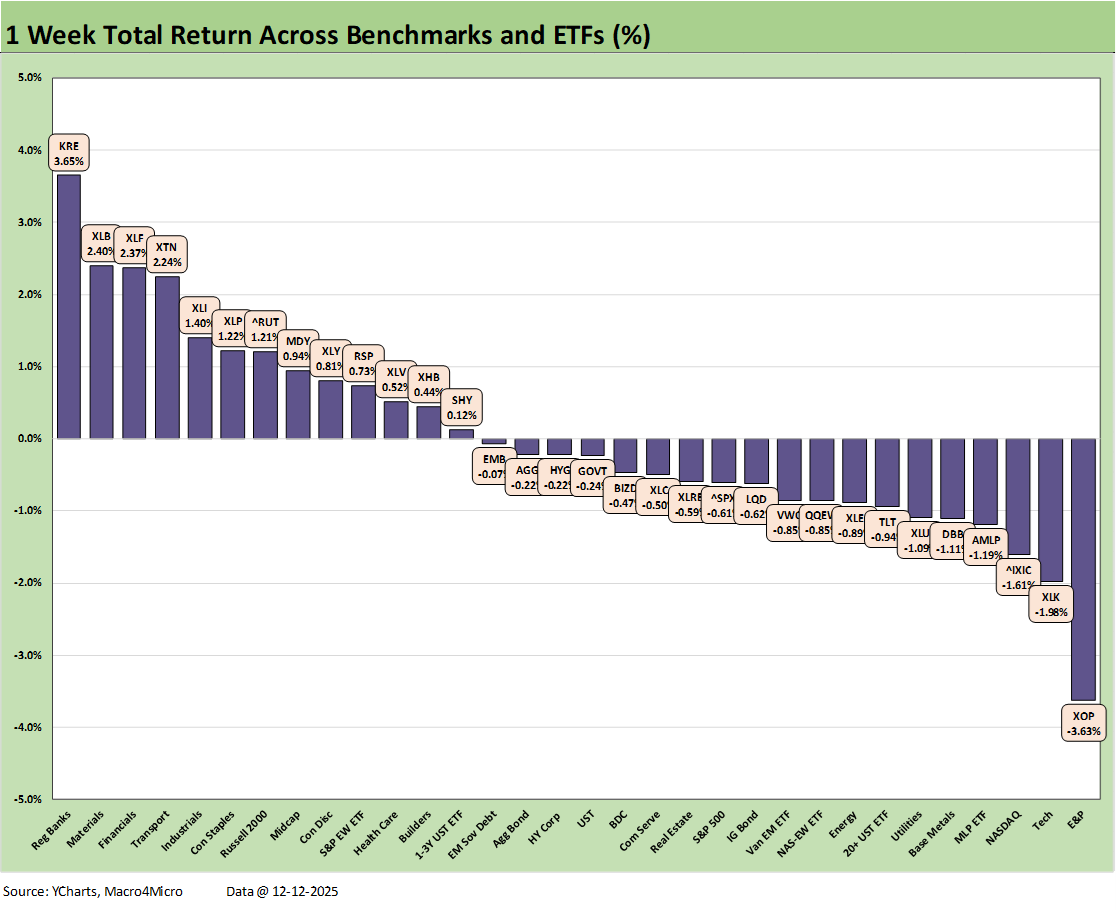
We already looked at the 1-week returns in our Market Lookback: FOMC Fragments, Rate Debates Murky (12-13-25). The 13-19 score for positive vs. negative included 6 bond ETFs in the red zone with the short UST ETF (SHY) barely positive.
The Financial ETF (XLF) and Regional Bank ETF (KRE) applauded the easing and expectation of at least one more. The fed’s SEP report also covered medians of flat unemployment, lower inflation, and higher growth rates. On paper, those medians looked good, but the wide range of the dot plot highlighted the differing opinions in stark fashion (see FOMC: Dot Plot Scatters for 2026 12-10-25).
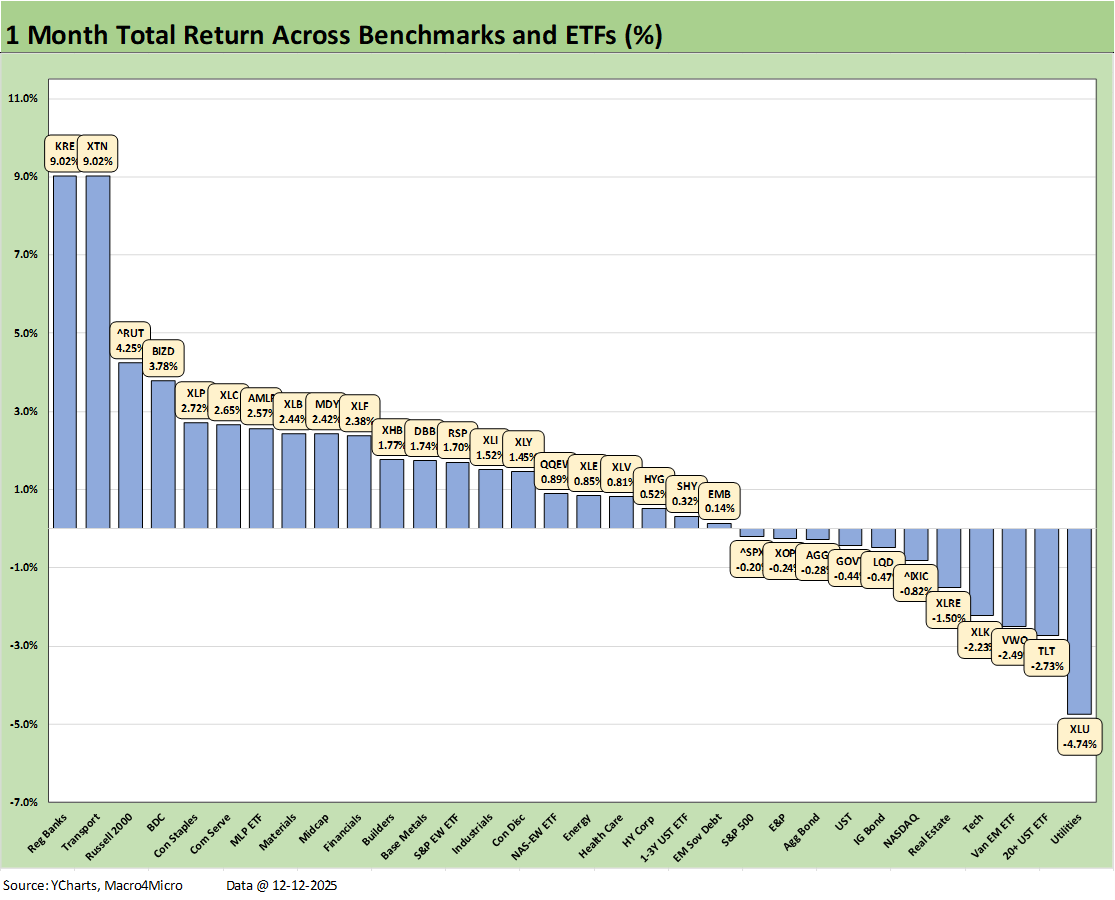
The 1-month timeline posted a score of 21-11 with 4 bond ETFs in the red and 3 slightly in positive range. For the large cap benchmarks, we see the NASDAQ in the red in the bottom quartile and the S&P 500 also negative and positioned in the lower end of the 3rd quartile. Russell 2000 was a top quartile asset line at #3 behind Regional Banks (KRE) and Transports (XTN).
The spooky extrapolation exercise in private credit calmed down over the trailing month with the BDC ETF (BIZD) at #4. We note that Communication Services (XLC) was resilient and was in the top tier while Tech (XLK) and NASDAQ fell into the bottom tier. Energy was spread out over the month with the dividend-heavy Midstream ETF (AMLP) in the top tier, Energy (XLE) at the top of the third quartile and E&P further down in the 3rd quartile.
The Midcaps ETF (MDY) was in the hunt at the top of the second tier as more market players try to gauge how sustainable the sector rotation is in this market and for what sectors.
Bond ETFs struggled with 3 in the bottom quartile including the long duration UST ETF (TLT) in second to last with HYG the best of the 7 bond ETFs in the middle of the third quartile next to short UST (SHY). The month was about duration in the bond ETF mix.
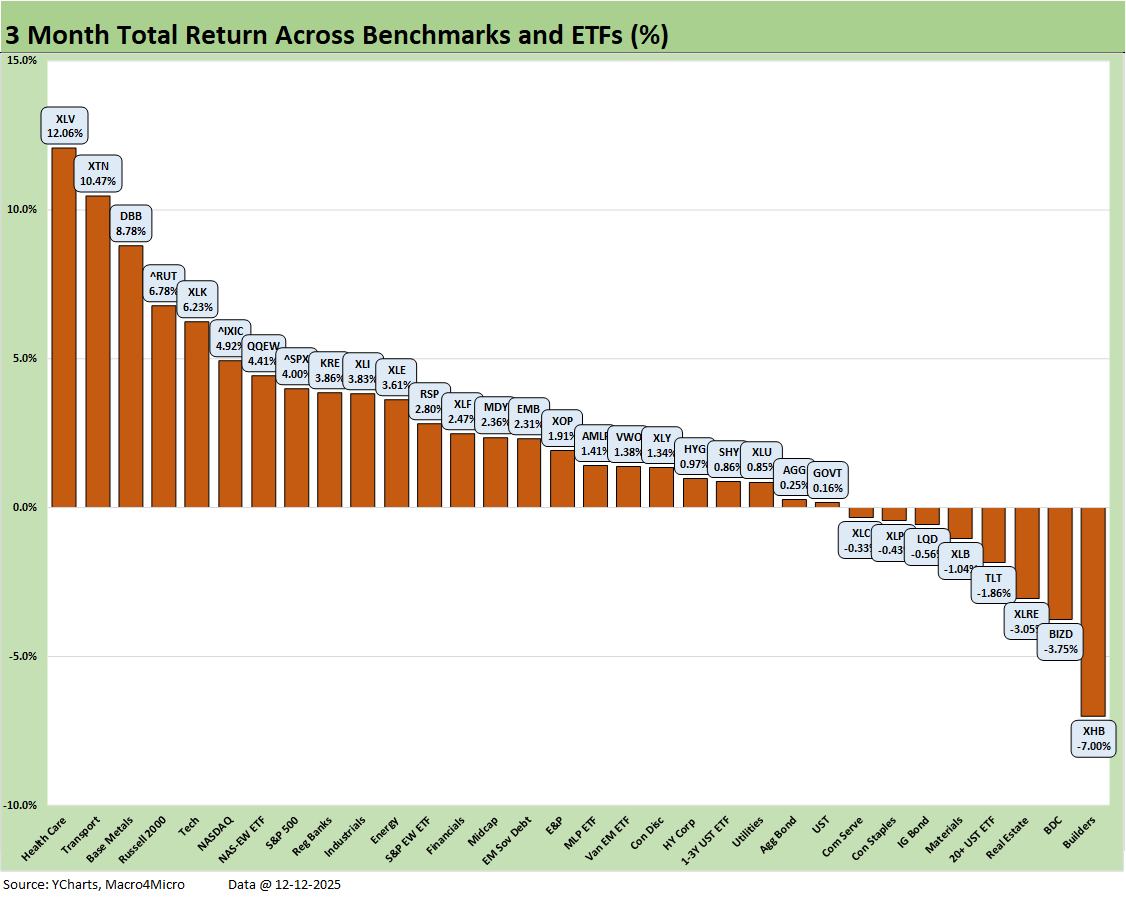
The rolling 3-month timeline posted a 24-8 score with the winners showing some breadth with Health Care (XLV) at #1 as XLV has been riding a strong pharma performance. The #2 Transports ETF (XTN) saw healthy support from airlines and select freight and logistics names. Base Metals (DBB) was a solid #3.
The small cap Russell 2000 ran ahead of the large caps with NASDAQ and the S&P 500 also in the top quartile with Midcaps (MDY) trailing in the second quartile. The breadth story was working out well and supported by the Regional Banks (KRE) just across the line in the second quartile with Industrials (XLI) and the broader Financial ETF (XLF) not far behind.
Yield curve pain and cyclical anxiety was a theme in the bottom over recent months with Homebuilders (XHB) in dead last at -7.0% and BDCs (BIZD) in second to last at -3.75%. The curve nerves and old school bond math hit Real Estate (XLRE), long duration UST ETF (TLT), and IG Corporates (LQD). Away from TLT and LQD in the bottom quartile, bonds still had 4 ETFs in minimal positive range (<1%) in the third quartile with HYG, SHY, AGG, and GOVT. EM Sovereigns (EMB) made it into the second quartile.
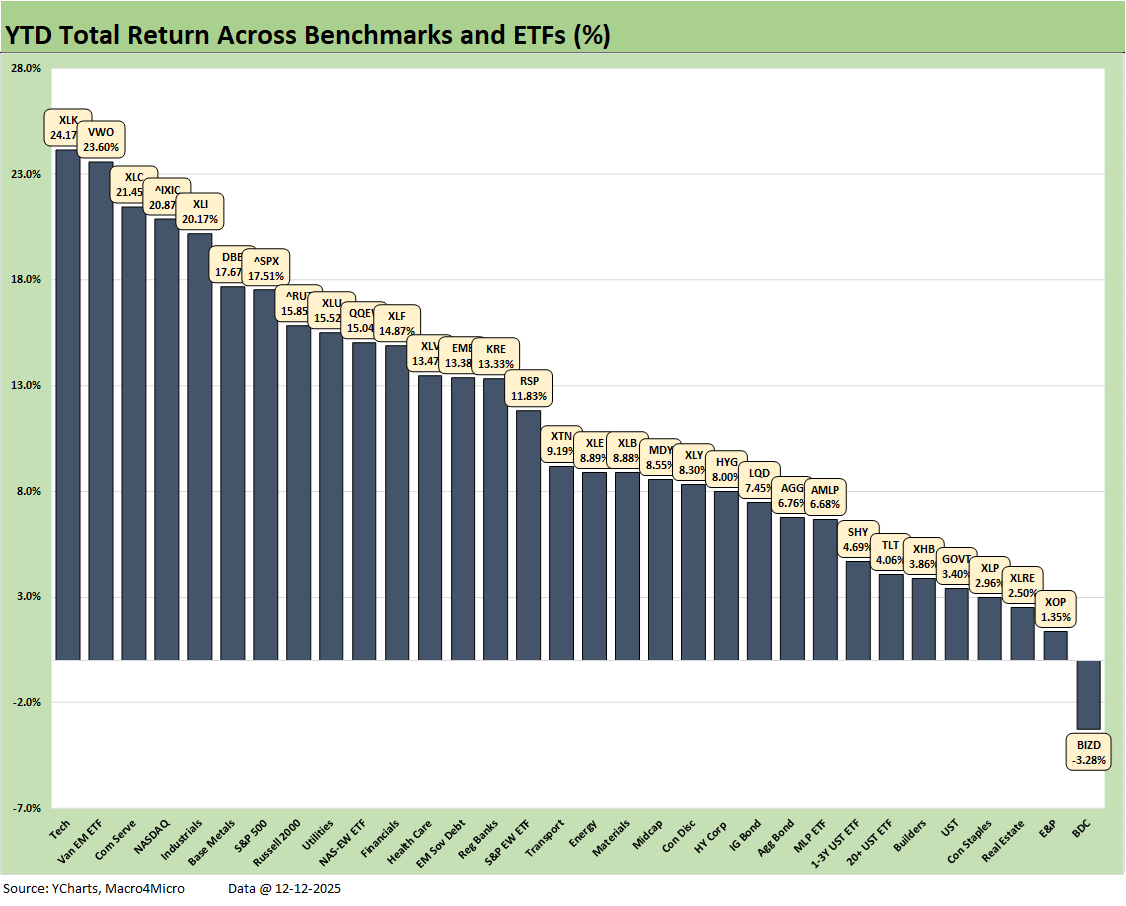
As we covered in our Market Lookback: FOMC Fragments, Rate Debates Murky (12-13-25), the YTD returns posted an impressive 31-1 score. Only BDC ETF (BIZD) was in the red at -3.28% but has been climbing back slowly.
At a YTD return of +17.5%, the S&P 500 looks to be out of the running to see its total return match or exceed 2024 or 2023 with the first back-to-back 25% years since the late 1990s. The NASDAQ at +20.9% will need something very big to happen in the next two weeks to hit the 29% handle of 2024.
The close finish for #1 still has Tech (XLK) at #1 with the EM Equities ETF (VWO) still riding the weak dollar performance for #2. Tech-centric names led the ranks with Communication Services (XLC) at #3 and NASDAQ at #4 joined by Industrials (XLI) at #5. The heavy weighting of tech gave the S&P 500 a spot in the top quartile just ahead of the Russell 2000 small caps.
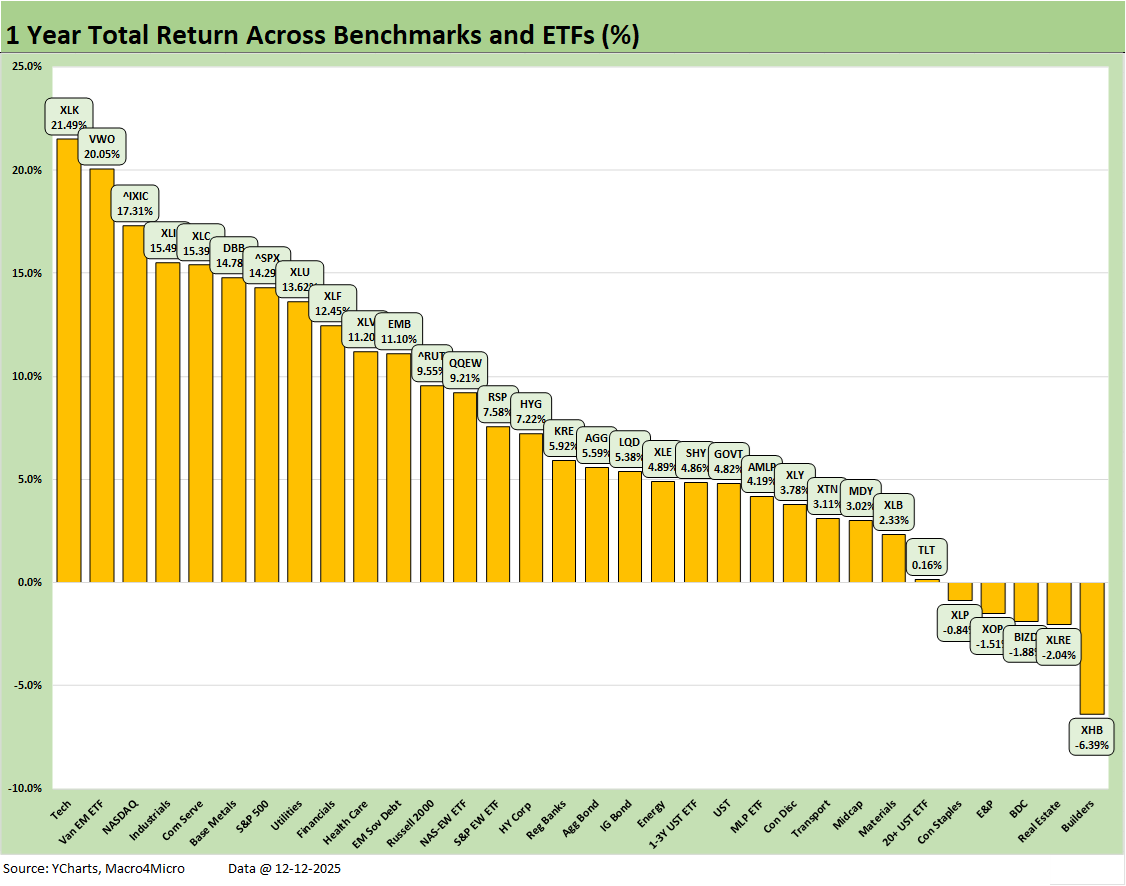
The final LTM chart is losing its relevance given where the YTD returns stand at this point, but we see the common feature of interest rate sensitive equities being under more pressure vs. other asset lines. The large cap benchmarks are running well short of the FY 2024 performance but represent strong year regardless (see Footnotes & Flashbacks: Asset Returns for 2024 1-2-25). For 2025, the S&P 500 and NASDAQ will still weigh in at more than 2X the long-term return on equities.
See also:
Market Lookback: FOMC Fragments, Rate Debates Murky 12-13-25
FOMC: Dot Plot Scatters for 2026 12-10-25
Employment Cost Index 3Q25: Slowing but Above CPI 12-10-25
JOLTS: Goldilocks’ Ugly Twin 12-9-25
Mini Market Lookback: Data Digestion 12-6-25
PCE, Income & Outlays: Calendar Gap Closing 12-5-25
Credit Markets 12-1-25
Mini Market Lookback: Back into the June 2007 Zone 11-29-25
Durable Goods Sep 2025: Quiet Broadening of Core Capex 11-26-25
Retail Sales September 2025: Foot off the Gas 11-25-25
The Curve: Flying Blind? 11-24-25
Mini Market Lookback: FOMC Countdown 11-23-25
Employment Sept 2025: In Data We Trust 11-20-25
Payrolls Sep25: Into the Weeds 11-20-25
Mini Market Lookback: Tariff Policy Shift Tells an Obvious Story 11-15-25
Retail Gasoline Prices: Biblical Power to Control Global Commodities 11-13-25
Simplifying the Affordability Question 11-11-25
Mini Market Lookback: All that Glitters… 11-8-25
Mini Market Lookback: Not Quite Magnificent Week 11-1-25
Synchrony: Credit Card Bellwether 10-30-25
Existing Home Sales Sept 2025: Staying in a Tight Range 10-26-25
Mini Market Lookback: Absence of Bad News Reigns 10-25-25
CPI September 2025: Headline Up, Core Down 10-24-25General Motors Update: Same
Ride, Smooth Enough 10-23-25
Mini Market Lookback: Healthy Banks, Mixed Economy, Poor Governance 10-18-25
Thanks for writing this, it clarifies a lot, and that sarcastic jab about nuking europe and throwing Ukraine under the tank was particularly insightful – it really captures the worrying absurdity of current geopolitcal sentiment. It makes you wonder how anyone expects coherant policy setting when the economic forecasts are so muddled, especially with such major political pressures looming.