
FOMC: Dot Plot Scatters for 2026
The FOMC meeting brought little clarity to a complicated market backdrop as the 2026 dot plot is not forecasting harmony.


Pollock possible Fed Chair for 2026 planning.
The Dec FOMC meeting posted the expected -25 bps cut, but the expectations show a lot of data work and plenty of tension ahead for the FOMC in 2026 with the January meeting a warmup ahead of Fed regime change.
With Trump’s attempted takeover of the Fed and desire to kneecap Fed independence underway, the dot plot mix for Dec 10 highlights that more of the members will not hesitate to aggressively deviate from “consensus.” That comes at a time when the White House is saying “prices are lower” even with aggregate positive inflation. The FOMC will have a hard time ignoring what they know even if that is a cornerstone of Trump economic policy these days (“prices lower, inflation lower, affordability con job,” etc.)
The Dec 2025 dot plot forecast for 2026 showed the Gang of 19 with 3 votes for 1 hike in 2026, 4 votes for no change, 4 votes for 1 cut, 4 votes for 2 cuts, 2 votes for 3 cuts, 1 vote for 4 cuts, and 1 for 6 cuts. 2027 forecast is not much better. What could possibly go wrong?
The biggest median forecast changes from the September forecasts in the new Dec 2025 SEP report was the +0.5% increase in 2026 GDP to 2.3% from 1.8%. The PCE inflation forecast was moved down to +2.4% from +2.6% while Core PCE was notched lower to +2.5% from +2.6%. That is still well above target. The unemployment rate was left flat at 4.4% (which is low in historical context) and the fed funds rate median forecast was unchanged at 3.4% (but across a wider range of forecasts).
The overall macro forecasts do not add up to recession or material macro shortfalls from the consumer or fixed investment. Monetary “implementation” piled onto the relative dove-fest with news of a modified QE Lite for T Bills to boost liquidity and reduce any potential short term rate pressure in money markets (and thus the banks). While this is often described as “plumbing,” it is the bank system that controls the faucets. The Fed controls the liquid in the pipes.
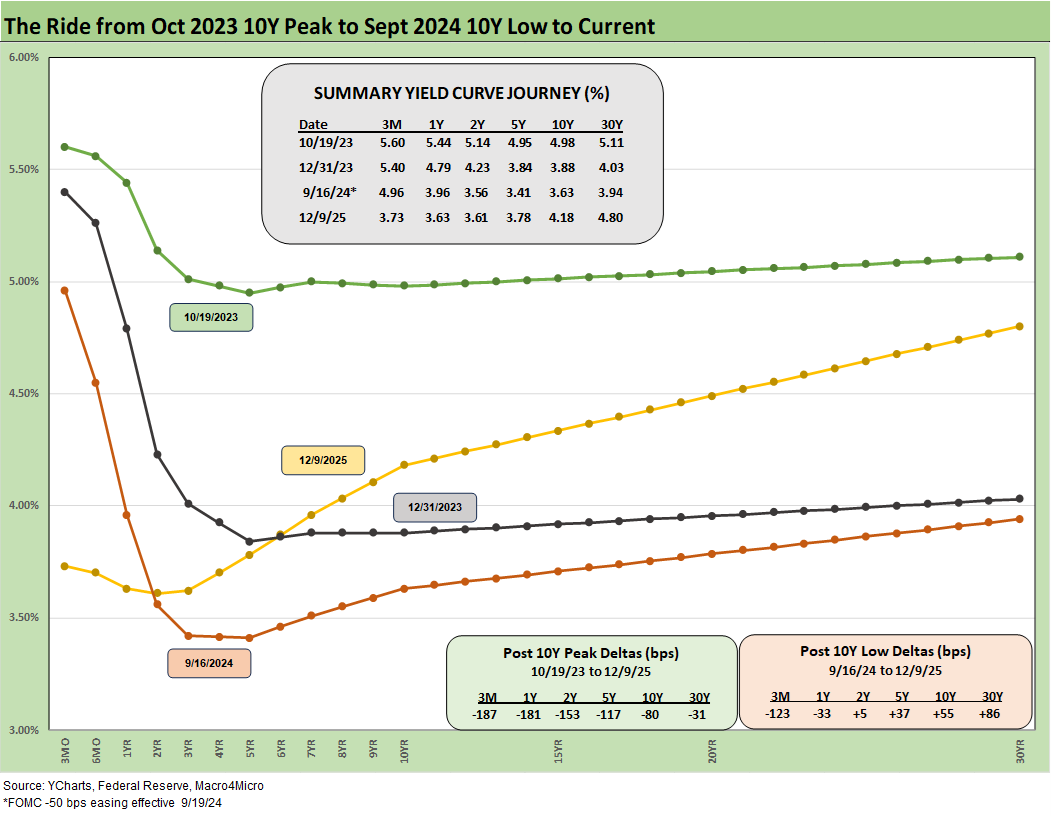
The above chart updates the notable period of shapeshifting for the UST curve since the UST 10Y peak (10-19-23). The period above runs across the FOMC easing that started in Sept 2024 ahead of a bear steepener from Sept 2024 to the current 12-9-25 UST curve. That timeline saw a lot of action from the short end to the long end as we covered in our UST commentaries.
We include the Tuesday (12-9-25) close for UST ahead of today’s modest move. As we wrap the day, we see the 3M -5 bps lower, the 2Y just over -7 bps lower, the 5Y at -4 bps, the 10Y at -3 bps, and 30Y -1.5 bps. The action in the curve needs to be fed a lot more data and more macro noise (e.g. final Fed Chair selection).
Besides payroll and CPI ahead with some long-awaited 3Q25 GDP data, the market will face swirling rumors around the Fed and whether it will be Hassett. It is not 100% certain yet that he will get the Westminster “Best in Show” ribbon in a highly competitive lapdog competition.
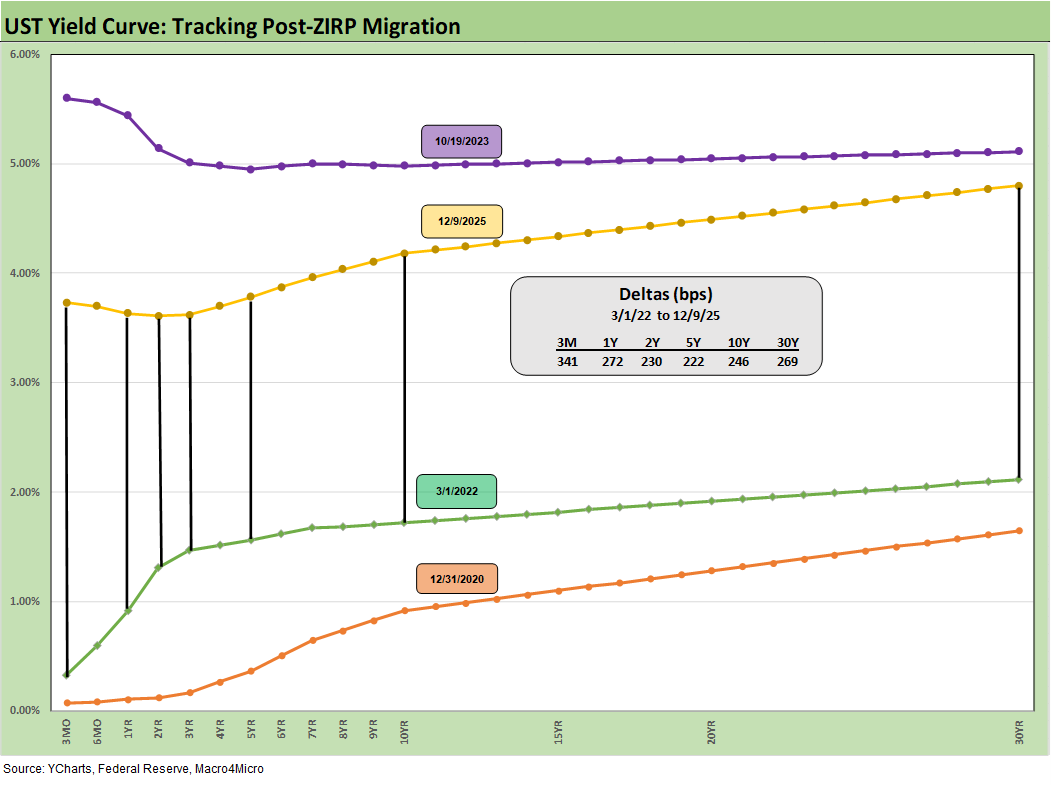
The above chart updates the wide band from the COVID UST curve at the end of 2020 to the 10-19-23 peak on the 10Y following the March 2022 end of ZIRP and eventual move into easing mode.
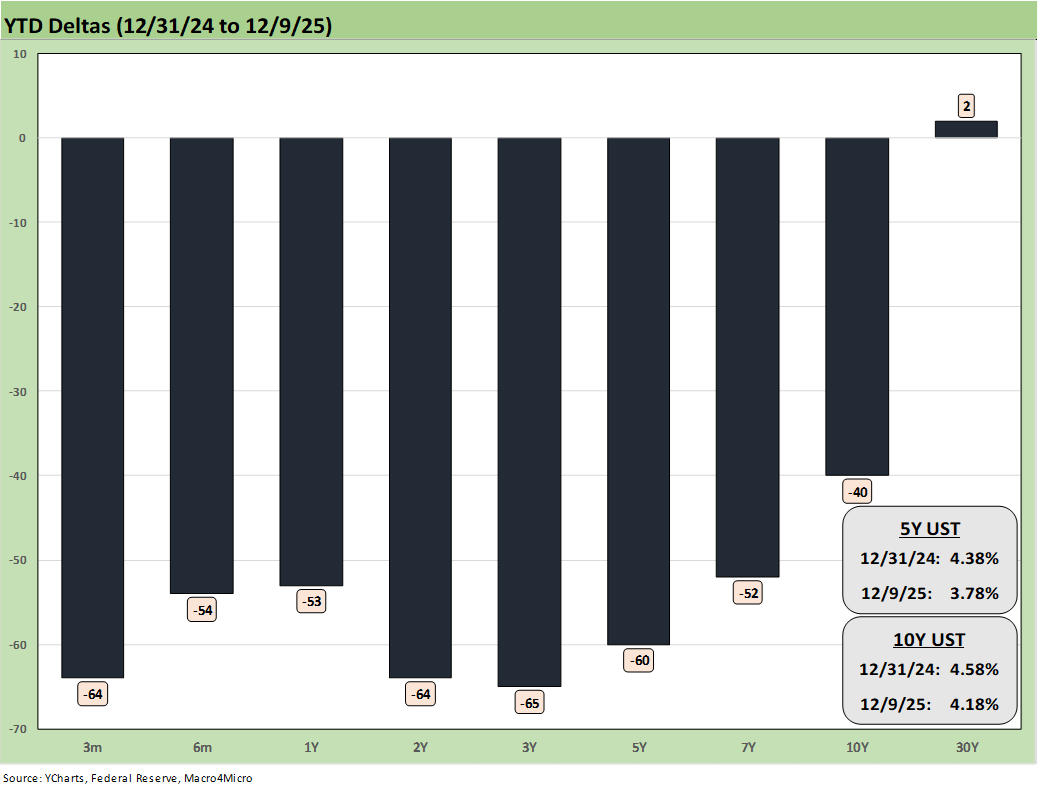
The above chart offers a more granular set of details on the YTD 2025 UST deltas. As we head into 2026, we are having a hard time seeing how this can be replayed with highly unpredictable inflation. If you want to bank on more easing, even if just by Trump “policy by fiat,” through one of his hand-picked Muppets, you can get the front end moving lower, but the dot plot still says there will be a fight over the handicapping for 3 cuts.
Looking further out the UST curve, this is where the UST supply-demand imbalances and inflation threats remain in place. A cratering of oil – which is a popular forecast for some – would be good news for inflation but also bring a “giant tax cut” that would get the consumer feeling good again. A stronger consumer plus tariff effects with healthy demand could get the inflation debate reheated.
With Powell talking about tariffs as a cause of price pressure in goods today, we can assume that Trump will have a litmus test for any new Fed Chair that no such words can be uttered – ever. We are still sticking with the 3M to 10Y steepening scenario and expect the 2Y to 30Y to stay steep (see The Curve: Flying Blind? 11-24-25).
See also:
Employment Cost Index 3Q25: Slowing but Above CPI 12-10-25
JOLTS: Goldilock’s Ugly Twin 12-9-25
Market Commentary: Asset Returns 12-7-25
Mini Market Lookback: Data Digestion 12-6-25
PCE, Income & Outlays: Calendar Gap Closing 12-5-25
Credit Markets 12-1-25
Mini Market Lookback: Back into the June 2007 Zone 11-29-25
Durable Goods Sep 2025: Quiet Broadening of Core Capex 11-26-25
Retail Sales September 2025: Foot off the Gas 11-25-25
The Curve: Flying Blind? 11-24-25
Mini Market Lookback: FOMC Countdown 11-23-25
Employment Sept 2025: In Data We Trust 11-20-25
Payrolls Sep25: Into the Weeds 11-20-25
Mini Market Lookback: Tariff Policy Shift Tells an Obvious Story 11-15-25
Retail Gasoline Prices: Biblical Power to Control Global Commodities 11-13-25
Simplifying the Affordability Question 11-11-25
Mini Market Lookback: All that Glitters… 11-8-25
Mini Market Lookback: Not Quite Magnificent Week 11-1-25
Synchrony: Credit Card Bellwether 10-30-25
Existing Home Sales Sept 2025: Staying in a Tight Range 10-26-25
Mini Market Lookback: Absence of Bad News Reigns 10-25-25
CPI September 2025: Headline Up, Core Down 10-24-25
General Motors Update: Same Ride, Smooth Enough 10-23-25
Mini Market Lookback: Healthy Banks, Mixed Economy, Poor Governance 10-18-25Mini Market Lookback: Event Risk Revisited 10-11-25
Credit Profile: General Motors and GM Financial 10-9-25
Mini Market Lookback: Chess? Checkers? Set the game table on fire? 10-4-25JOLTS
Aug 2025: Tough math when “total unemployed > job openings” 9-30-25Mini Market
Lookback: Market Compartmentalization, Political Chaos 9-27-25