
Employment Nov 2025: Bad News is Bad News
Despite inevitable shutdown asterisks, the weak 7-month trend in jobs is clear.


Problems in measurement may be nuanced, but gravity still rules in jobs.
From Sept to Nov, the total number of unemployed increased by 228K (Household Data) and a -105K hit in Oct (Establishment Data) highlight setbacks in the macro story.
The rise in unemployment to +4.6% from +4.4% comes with an ugly jump in the U-6 structural underemployment metric to 8.7% from 8.0% in September. With jobs under pressure, what this country needs is a big new golden ballroom.
The mix of favorable occupational shifts and higher delta lines remains more concentrated in the low multiplier effects Services sectors. In contrast, Manufacturing payrolls were down in both Oct and Nov. Manufacturing is down by -73K jobs since Nov 2024.
Health Care and Social Assistance carried the ball in Nov while Leisure and Hospitality faded into a modest negative in Nov. The chaos on the Government payroll line in Oct saw a contraction of -157K with more than 100% of that at the Federal level.
With Retail Sales out today and CPI tomorrow, the consumer story line and stagflation risks will stay on the front burner. The Health Care premium wildcard remains a massive headline risk that could squeeze households. The tax bill and Medicaid retrenchment already create major headwinds. Health Care serves as the #1 payroll delta bucket at a time when the overall healthcare sector (18% of GDP) will see a lot of turmoil ahead.
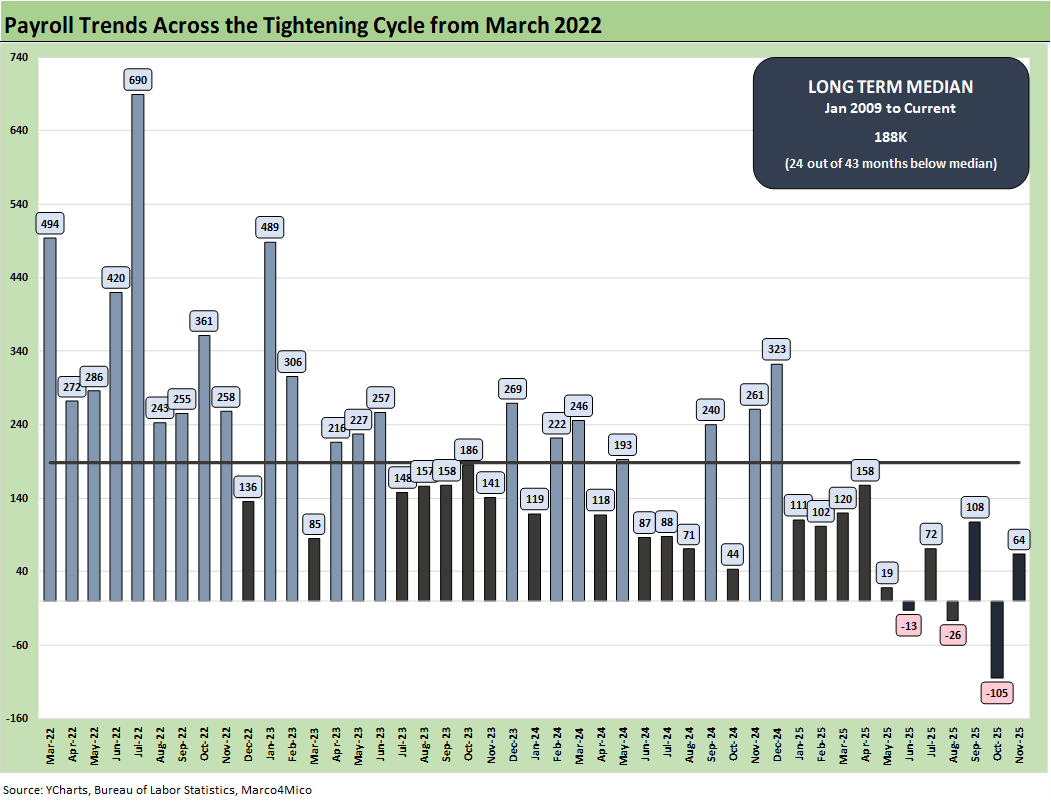
The monthly payroll adds/declines chart above tells an objective data story. There is no way to spin it. The numbers in 2025 include the only 3 negative deltas on the chart. All of the 2025 months are below the post-Jan 2009 median which includes the longest recession since the Great Depression. That offers no grounds to brag.
The timeline covered in the chart starts with the beginning of the tightening cycle in March 2022. We also include a median line (median from Jan 2009). Every month since January 2025 is below the median. That is not an opinion. Those are the numbers. That doesn’t exactly fit with Trump’s description of his term so far as the “greatest in Presidential history” and a “Golden Age” with “lower prices” (while inflation is positive).
The ADP November numbers were mostly a wakeup call in the small business sector with the notable contraction in jobs. That small business pain makes sense given the horror stories from small business trade groups on tariff fallout for that subsector. The pricing adjustment lags to pass through tariff costs will remain very much a topic even if many pretend that the tariff debate is over (wishful thinking).
As the 4Q25 period winds down and the market gears up for discussing 2026 capex plans and budgets (IT, headcount, etc.), the process of moving “trade deals” along to be more than “frameworks” will still be high on the risk factor list. Massive variables such as the USMCA review will add complicating elements. The relationships with the top 3 trade partners – the EU, Mexico and Canada – are certainly not getting better. The EU is clearly getting worse. Payrolls in the US cannot hide from those risks.
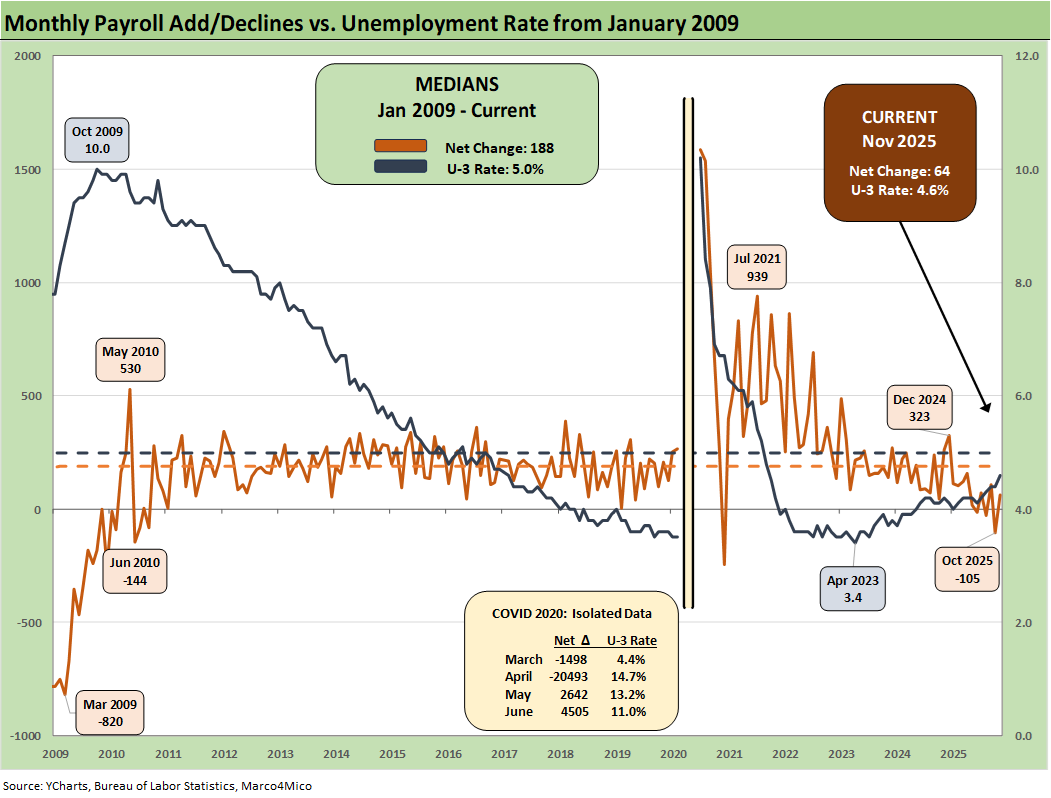
The above chart plots the running job adds/declines since Jan 2009 against the unemployment rate, which ticked higher to 4.6% from 4.4% in September. We isolate the worst months of the COVID dislocations in the above box for better visuals to capture the other periods. The 4.6% U-3 is still below the long-term median of 5.0%. In past cycles such a number would be considered near full employment. In other words, the 4.6% is by no means a panic metric. On the other hand, history shows it can get much higher.
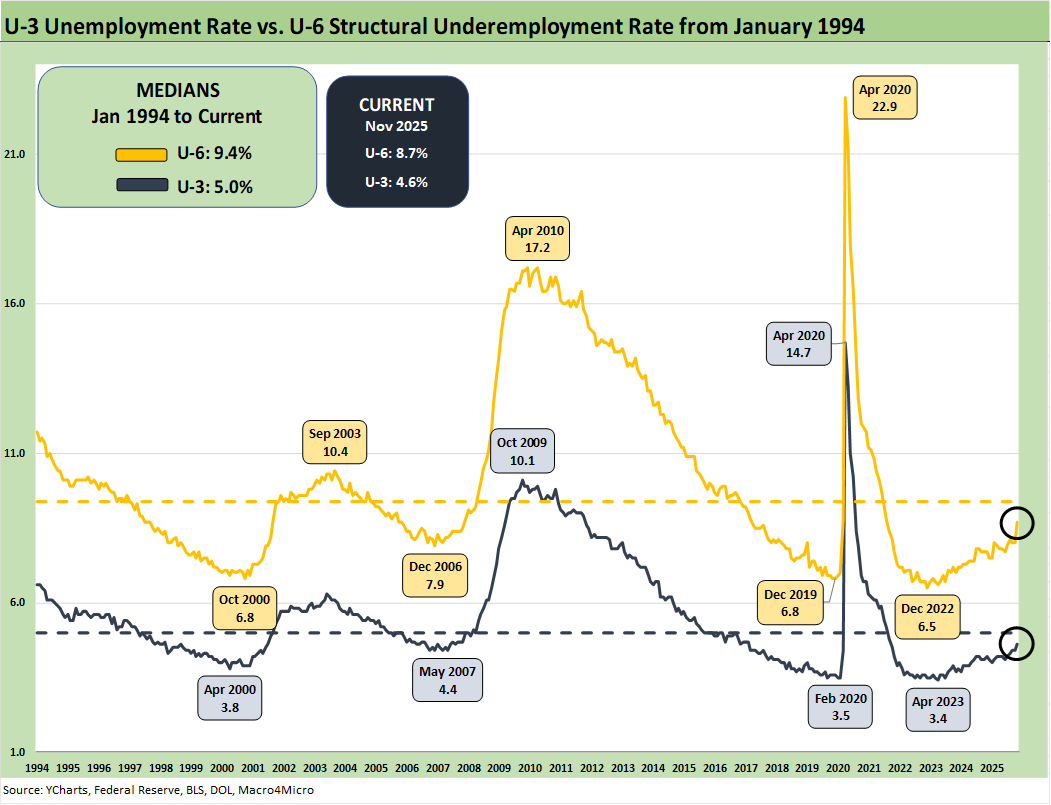
The above chart updates the time series for the U-3 unemployment rate and U-6 structural underemployment rate across the years from 1994. As noted, the current U-3 rate ticked higher to 4.6% for Nov from +4.4% in Sept.
As a reminder, the U-6 metric is defined with the numerator as “total unemployed + persons marginally attached to the labor force + total employed part time for economic reasons.” The denominator is “civilian labor force + workers marginally attached to the labor force.”
The U-6 is the bigger worry this month with the move higher to 8.7% from 8.0%. That spike in U-6 during a time when the “K Shaped recovery” and the “affordability crisis” are routine discussion points does not fortify consumer confidence/sentiment.
The U-6 jumped to 8.7% from 8.0% in Sept after 8.1% in Aug, 7.9% in July and 7.7% in June. To start the year, the U-6 rose sharply in Feb 2025 to 8.0% from 7.5% in Jan 2025. The current 8.7% is well above the 6% handles seen in spring of 2023. The U-6 is still below the median from 1994 of +9.4%. That 9.4% includes the post-crisis shock and the longest recession since the Great Depression.
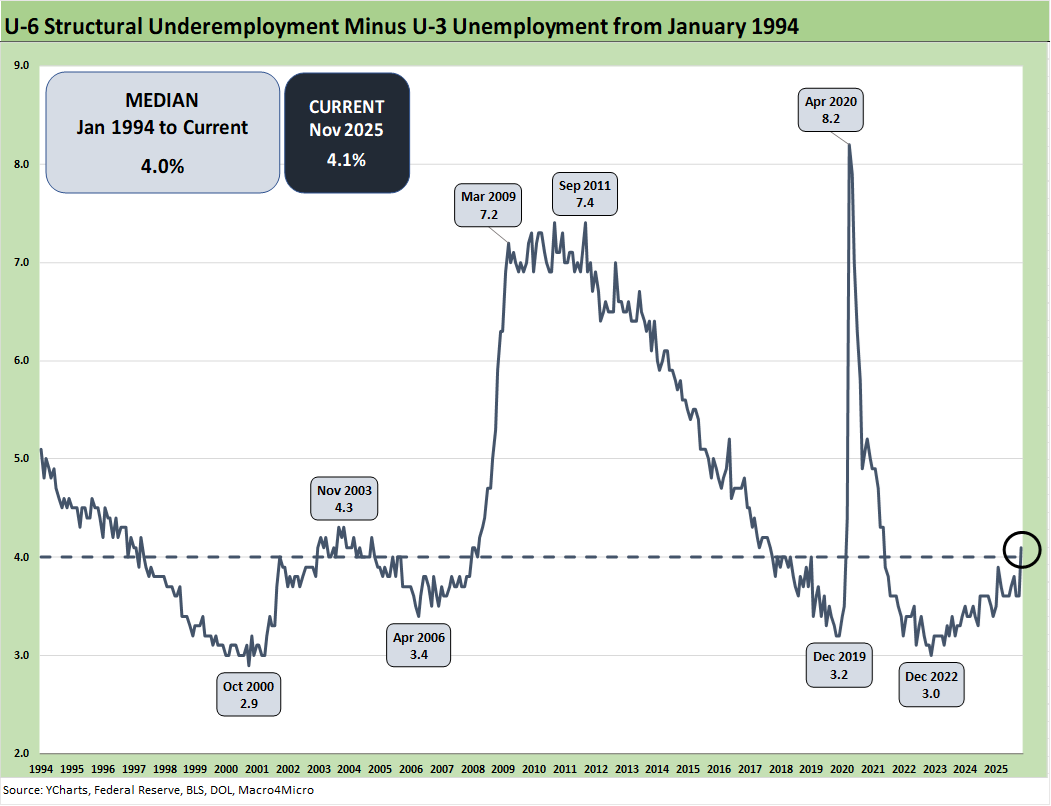
The time series above updates the U-6 minus U-3 differential as a measure of relative employment quality and to flag risks of major dislocations in large swaths of the economy (think oil patch in the late 1980s, tech bubble imploding 2001-2003, financial services and automotive in 2009).
The current 4.1% differential is slightly above the long-term median of 4.0% but a major move higher from last month’s 3.6%. The job ranks are weakening now but are also in a mixed period where tariffs are still getting worked out with trade partners and the courts.
Many questions will get answers with respect to how tariffs will flow into working capital cycles and new capacity planning. For example, we are seeing major plans to relocate automotive OEM capacity back to the US. That should attract more supplier chain capex. In contrast, the idea of a major new aluminum smelter in the US will not happen based on economics and the timeline to build one. There are a lot of stories along the manufacturing chains with some good and plenty bad. For now, manufacturing payrolls are “net bad.”
Some of the risk issues get swept up in immigration and deportation numbers, but the analysis always comes back to the number of workers with paychecks. Employers will be making decisions to mitigate the tariff damage if they are not passing along the cost in prices or want to limit the scale of the price increase to customers. There is no hiding from the need for economic reactions along the supplier to customer ecosystem. Someone always pays – including those “paying” with layoffs in tariff cost mitigation decisions.
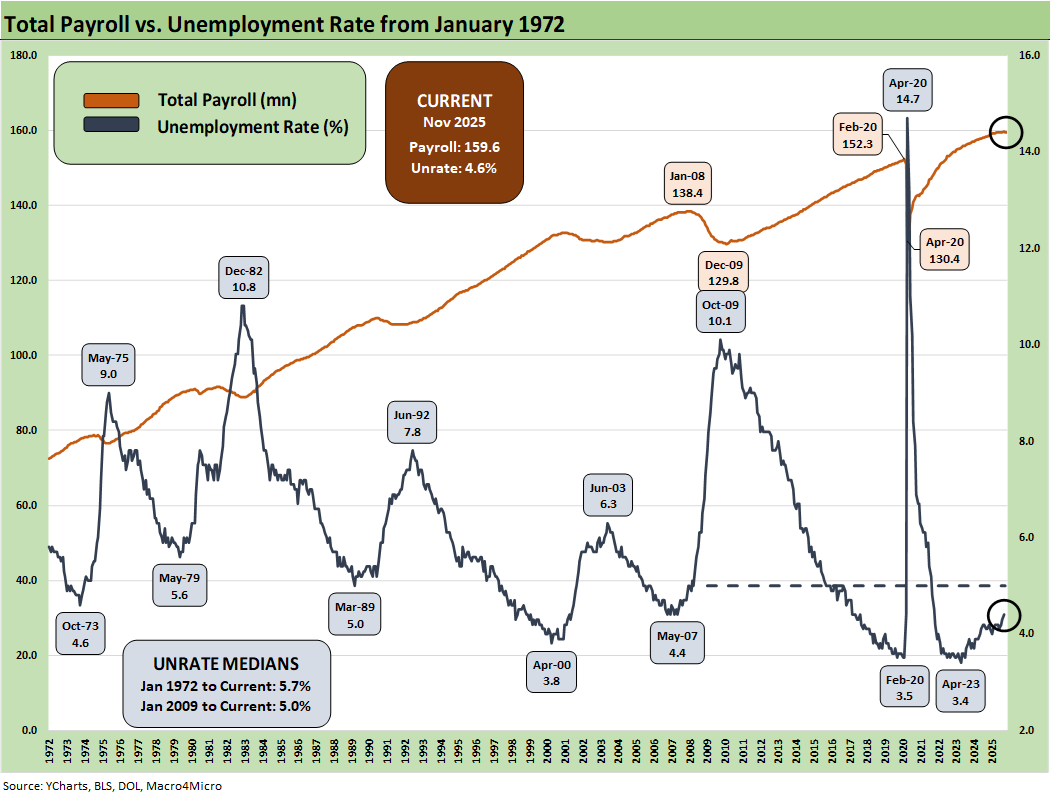
The above chart updates total payroll vs. the unemployment rate. More bodies with more paychecks are always by definition a good thing. The trick from here is how the consumer deploys that paycheck and whether the zero-sum realities of household budgets undercut spending range.
We had been seeing reasonably better trends in consumer income and consumption in the monthly PCE releases, but the market awaits more data (see PCE, Income & Outlays: Calendar Gap Closing 12-5-25).
The 2Q25 GDP growth numbers failed to inspire in the consumer metric despite some upward revisions (see 2Q25 GDP: Second Estimate, Updated Distortion Lines 8-28-25). That followed similar weakness in 1Q25 GDP (see 1Q25 GDP: Final Estimate, Consumer Fade 6-26-25). We do not have 3Q25 GDP data yet but that is due Dec 23rd.
Soft survey numbers for consumers remain an area of focus even with UMich consumer sentiment barely missing an all-time low recently. They had climbed for a while after the worst of the post-Liberation Day nerves and China trade worries but are fading again. The consumer still has ample reason to get defensive and push saving rates higher than what we have seen in the monthly PCE numbers.
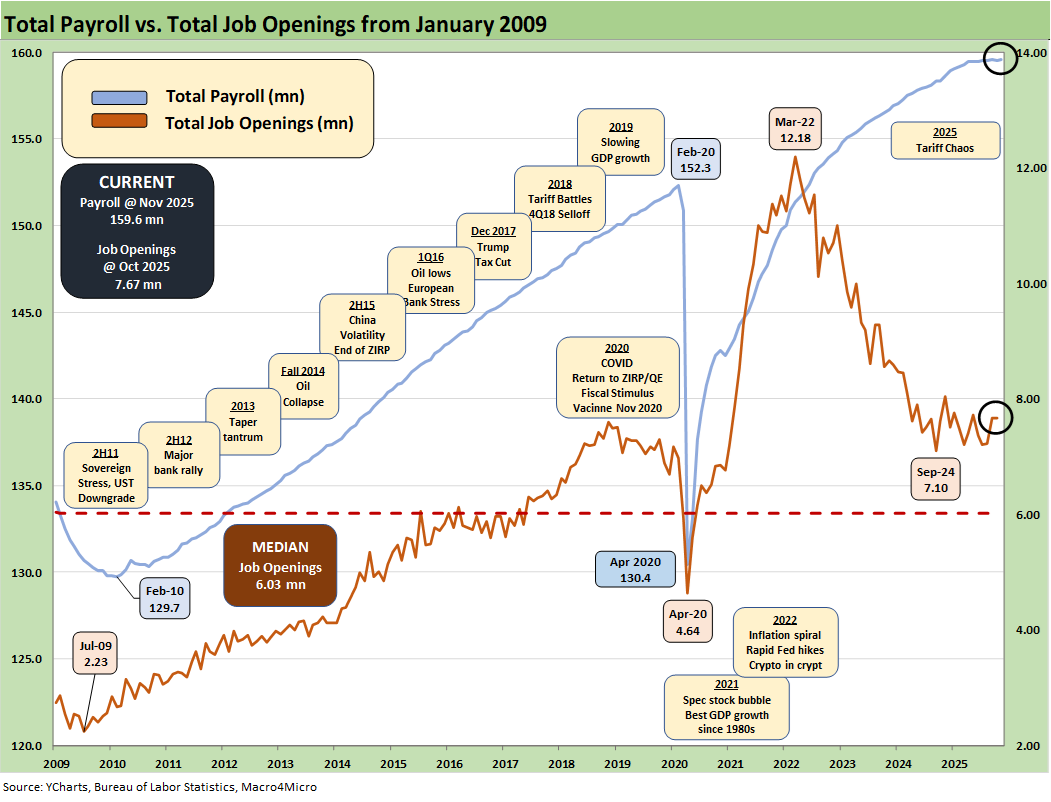
The above chart updates the total payroll number vs. job openings. The most recent JOLTS numbers have been unimpressive (JOLTS: Goldilocks’ Ugly Twin 12-9-25, JOLTS Aug 2025: Tough math when “total unemployed > job openings” see 9-30-25). Those JOLTS have been followed by soft payroll trends.
The management teams in “corporate land” have a lot of moving parts to factor into guidance whether quantitative or qualitative. The final IEEPA decision from SCOTUS is ahead. The fallout in consumer spending from health care premium increases and retrenchments in SNAP spending and eligibility criteria could signal trouble ahead in the lower part of the “K” household mix.
The color in trade literature and in economic releases such as the Beige Book that drill down into the weeds are clearly signaling the tariffs are a major problem. The GOP also saw some empirical evidence in the recent elections and moved to roll in tariff exemptions without offering a confession stating that “buyer pays.”
For some (notably retail and many small businesses), the tariff threat can be existential. The cash drain in “writing the tariff check” and the hit to earnings from the expense line can impair trade credit and fuel bank credit problems for small businesses that are the backbone of payroll counts in the US. The payroll impact is already showing up. As noted in the chart at the top of the commentary, negative payroll months stand out in a time series where the White House had been touting some of the “greatest months in Presidential History.” (now almost a full year in payroll data).
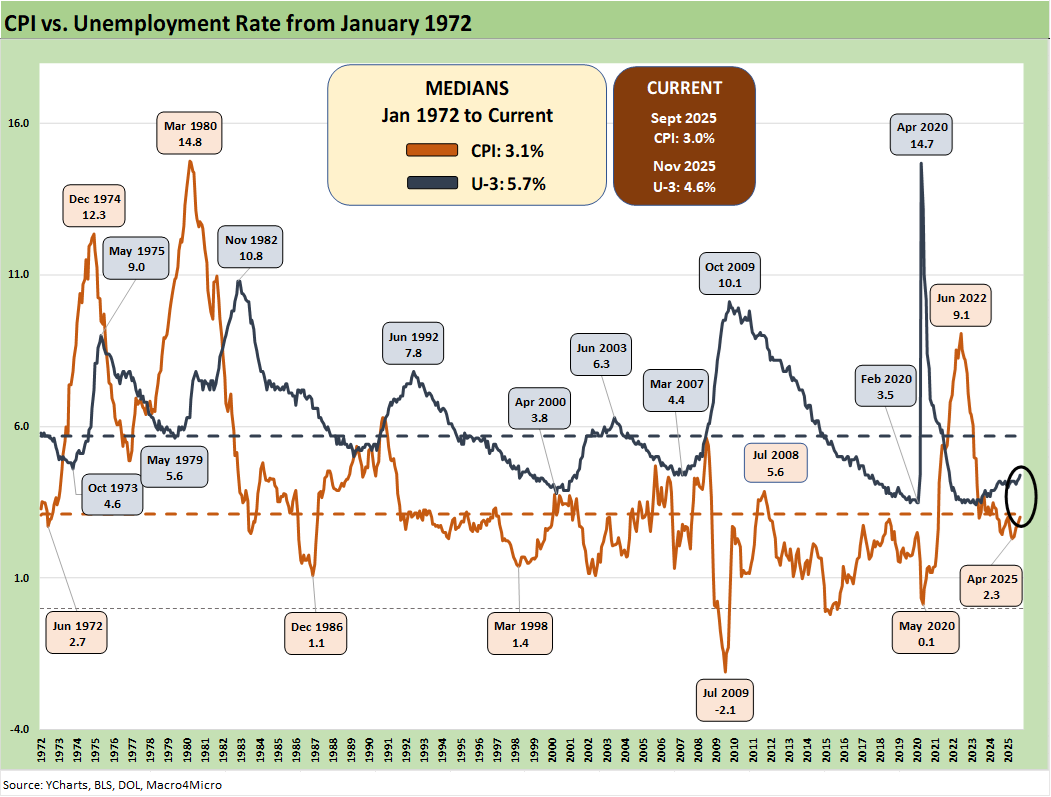
Inflation reports had generally brought good news relative to expectations given the scale of the forward threat and lagging effects to be seen across working capital cycles. That said, the inflation creep and affordability strain is clearly in evidence and taking a toll on inflation by product groups are showing up in the data with more to come (see PCE, Income & Outlays: Calendar Gap Closing 12-5-25, Simplifying the Affordability Question 11-11-25, CPI September 2025: Headline Up, Core Down 10-24-25).
See also:
The Curve 12-15-25
Market Commentary: Asset Returns 12-14-25
Market Lookback: FOMC Fragments, Rate Debates Murky 12-13-25
FOMC: Dot Plot Scatters for 2026 12-10-25
Employment Cost Index 3Q25: Slowing but Above CPI 12-10-25
JOLTS: Goldilocks’ Ugly Twin 12-9-25
Mini Market Lookback: Data Digestion 12-6-25
PCE, Income & Outlays: Calendar Gap Closing 12-5-25
Credit Markets 12-1-25
Mini Market Lookback: Back into the June 2007 Zone 11-29-25
Durable Goods Sep 2025: Quiet Broadening of Core Capex 11-26-25
Retail Sales September 2025: Foot off the Gas 11-25-25
The Curve: Flying Blind? 11-24-25
Mini Market Lookback: FOMC Countdown 11-23-25
Employment Sept 2025: In Data We Trust 11-20-25
Payrolls Sep25: Into the Weeds 11-20-25
Mini Market Lookback: Tariff Policy Shift Tells an Obvious Story 11-15-25
Retail Gasoline Prices: Biblical Power to Control Global Commodities 11-13-25
Simplifying the Affordability Question 11-11-25
Mini Market Lookback: All that Glitters… 11-8-25
Mini Market Lookback: Not Quite Magnificent Week 11-1-25
Synchrony: Credit Card Bellwether 10-30-25
Existing Home Sales Sept 2025: Staying in a Tight Range 10-26-25
Mini Market Lookback: Absence of Bad News Reigns 10-25-25
CPI September 2025: Headline Up, Core Down 10-24-25
General Motors Update: Same Ride, Smooth Enough 10-23-25
Mini Market Lookback: Healthy Banks, Mixed Economy, Poor Governance 10-18-25
Mini Market Lookback: Event Risk Revisited 10-11-25
Credit Profile: General Motors and GM Financial 10-9-25