
Footnotes & Flashbacks: Credit Markets 1-27-25
We update credit markets that seem to hit pause with a positive bias until risk variables scream otherwise.


Tariffs: Don’t get in the ring if you are afraid of getting hit.
We are just off another quiet week in credit with a relatively inactive UST curve, minimal movement in IG spreads and a small dose of HY OAS compression to keep us closer to early June 2007 levels than late June 2007.
The new week begins with the DeepSeek headlines offering an excuse to worry about excessive AI valuations and the adverse multiplier effects across capex, power needs, and risky asset volatility. That is even before we get to the more pressing macro issues of tariff and deportation economic effects with the clock ticking on the final details and timeline.
Valuations in credit offer ample reason to worry about risk-reward symmetry, but the match needs to be lit. Trump may seek to light it for some sectors and notably autos (Mexico, Canada, China suppliers) and commodities (Canada).
The earnings season is underway, and the consensus expectation is for sustained bottom line growth with few 2025 street forecasters to this point pulling in the reigns on full year profit growth for the corporate sector. That would need more input (read “tariffs”).
The bank/consumer finance sector is in the later stages of reporting but were generally bullish. Solid lender performance tends to discourage derisking credit based on fear of what might happen in such areas as tariffs. The market might correlate if equity markets panic, but the transmission mechanism to material fundamental credit weakness just is not there yet.

The above chart plots the running YTD total returns and excess returns for IG and HY and along the credit tiers. Tight credit spreads and movement in the UST curve deltas have served as a brake on IG total returns and excess returns (see Footnotes & Flashbacks: State of Yields 1-26-25, Footnotes & Flashbacks: Asset Returns 1-26-25 ). Meanwhile, HY OAS has been on a compression wave that was smaller this week but still tighter (see Mini Market Lookback: Policy Blitz Formation 1-25-25). That in turn has been a blessing for excess returns in HY and its credit tiers.
The DeepSeek headlines and beatdown of NVDA (among others) will be interesting to follow as the week plays out for a fundamental driver (AI) that has been the cornerstone of lofty market valuations. We will see if it starts to flow into broader risky asset pricing and any correlation spillover into HY.
Industries such as power and data centers are getting pulled into the valuation war games. For example, Iron Mountain (IRM) equity has sold off by high single digits as we go to print given IRM’s emerging data center operations (see Credit Crib Note: Iron Mountain (IRM) 12-18-24). There were also a lot of sell-offs in Utility names that had been riding the wave of power shortage scenarios.
For the DeepSeek catalyst to sell off and drive sustained second-guessing on AI, there is a lot of pushback on the screen today for those who challenge the threat. The simplest (and in current times believable) pushback on CNBC was from a former GOP Congressman who in essence said (my paraphrase). “Not to worry, Trump can just ban its use.” We also saw stories about a cyberattack on DeepSeek today. This will obviously remain a hot topic.
Fears of excess valuations and over-the-top multiples are hardly new, but the other 493 non-Mag 7 names in the S&P 500 have a lot of consumer driven stories and high rates of fixed investment outside the AI and related capex story lines. The tech change and innovation battle of “us vs. them” is loud and will get louder. As we go to print, the Dow was back in the green and equal weight S&P 500 (RSP) was barely in the red (-0.3%).
A look at spreads…

We update the running histories on IG spreads since 1997, and there is a steady state compression with IG OAS -2 bps tighter on the week to +80 bps. Credit spreads seem to be waiting for evidence that this credit risk cycle will face some near-term material risks or any “event” that signals broader repricing is imminent. A trade war would do that. The Trump vs. Colombia tiff this weekend was like one of those 4-round undercard fights while you await the featured boxing event (US vs. USMCA partners Canada and Mexico are the main event). That Colombia fight lasted less than 1 round.
At times, equity volatility can trigger some trouble, but the transmission into weaker credit market performance is still tied heavily into broader economic trends (GDP growth, payrolls), consumer health (aggregate delinquencies and defaults vs. reserving policies), bank system support (credit availability), inflation fears (commodity prices, wages, FOMC policy, etc.) and other variables.
Asset allocation is always a critical driver of bond demand, and the market is now in an ongoing steady state of repricing coupons as bonds issued in low UST markets get refinanced. That is notably the case in the massive IG markets. We have seen past IG markets stay in double-digit credit spread ranges for protracted periods (1997-1998, 2004-2007), so the resilience of IG is impressive. That is especially the case when the banking system is healthy. After all, banks and financials are massive issuers of bonds in the IG index (Banks + Financials > $2.3 trillion in IG bond index).
There is also a school of thought that nerves in equities can send more flows to bonds. Trump’s “demand” that rates must be lowered could get the “put the cash hoard to work” theme back in place (i.e. extend out the curve). Trump did not say he would demand lower fed funds, but we assume that is what he meant. He likely did not want to admit that he does not control the long end of the bond market. His planned budget and tariff game plan (still unclear) could make those long UST rates move higher unless the market sees a threat to growth (flight to quality) to balance against record supply. Encouraging China to keep buying UST might be a good idea.

HY OAS tightened by another -4 bps to +260 and is -26 bps tighter over the trailing 1-month period. The HY OAS is now well inside where June 2007 and Dec 2007 ended even if still wide to early June 2007. As a reminder, HY OAS lows were hit twice in early June at +241 bps, but June 2007 ended at +298 bps. Back in 1997, the HY market hit spread lows in Oct 1997 at +244 bps, but the year 1997 ended at +296 bps. That makes a statement on where +260 bps stands in historical context.

The “HY OAS minus IG OAS” quality spread differential at +180 bps is back at the Nov lows, but this week briefly saw the differential dip below that to +178 bps (on 1-22-25) as detailed in Mini Market Lookback: Policy Blitz Formation.

The quality spread differential between the BB and BBB tiers also got back to near the recent lows. We ended the week at +59 bps, but the differential briefly hit +57 bps during the week (1-22-25). That was just above the multicycle low of +55 bps seen in July 2024.
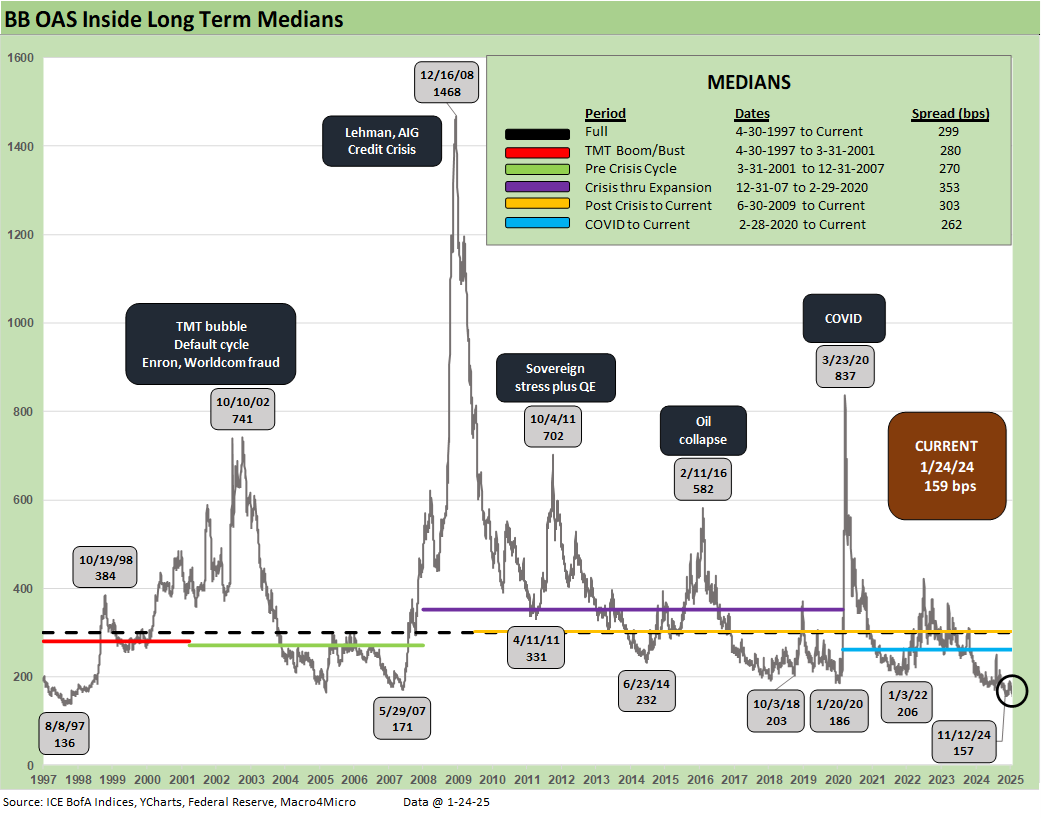
The BB tier tightened by -4 bps to end the week at +159 bps after getting to +158 bps at midweek. The historical timeline underscores how strong demand has been and how compressed BB tier OAS levels are now vs. June 2007. Just cracking the +200 bps line is extraordinary in post-crisis context. We also saw the sub-200 levels briefly in early 2020 when the par-plus BB tier saw many names trading above call prices. The lows of early 2022, Oct 2018, and June 2014 were all above the +200 bps line.

The B tier has been on an impressive compression run since 2022. The current rally saw +261 bps to wrap the week after a midweek low at +260. As we detail in the links at the bottom (See Select Histories) the 2023-2024 compression in the B tier is a better proxy for the “HY Classic” investor than the BB tier, where a lot of traditional BBB tier buyers and “HY lite” strategies are chasing that tier.
The B tier OAS compression was dazzling in 2023 as the B tier OAS tightened by -174 bps before the B tier OAS tightened by another -45 bps in 2024 to +296 bps. The long-term median of +468 bps dwarfs current B tier OAS. YTD 2025, the B tier has tightened another -35 bps. The low point for the B tier OAS was +254 bps in Nov 2024.

The points of divergence between the B vs. CCC tier OAS are detailed in the above chart. We frame the highs and lows for some historical perspective. The rise of private credit has shifted the relative mix of the CCC tier (or weak B tier) exposures in the HY bond index lower. The most aggressive deals are over in the less transparent private credit and loan markets. The theory is that the material gap risk seen reverberating from the bottom up in HY bonds will be a less threatening part of the HY bond story in this deal cycle when a default cycle and material risk repricing does unfold.

The CCC OAS minus B tier OAS differentials are detailed above. The recent print of +433 bps is well inside the long-term median of +483 bps and inside all the segmented timeline medians in the above box. The lowest median was the pre-crisis cycle (March 2001 to Dec 2007) with its +453 bps median. That period included a +172 bps low in June 2007 (now that is a bubble!).

The above chart shortens up the “CCC OAS – B OAS” timeline by starting just before the tightening cycle and end of ZIRP. We see a +315 bps level in Jan 2022, which makes the current +433 bps appear relatively less compressed in recent history. We are in from the +741 bps high during the cyclical anxiety of fall 2022.
A look at yields…

The above updates the history on IG and HY YTW levels with the current 7.16% for HY and +5.35% reflecting a low UST curve in historical pre-crisis, pre-ZIRP context and multicycle lows in spreads as detailed above.
We routinely make the case that the relevant frame of reference is the pre-crisis medians of 6.1% for IG and +9.3% in HY. If we consider what median spreads look like as detailed earlier, the comparison makes more sense. Current HY OAS is just over 200 bps tight to the long term HY median. Add 200 bps to the above HY YTW and the index is north of 9%.
While that “incremental spread” approach is an oversimplification (after all, the UST moves around as does the FOMC with macro conditions), it makes the point. If you want to drop in a stagflation scenario on the other side of tariff and deportations, things get ugly in rates as well as spreads. That would be unkind to credit-intensive bonds.

The above chart updates our usual look at IG index YTW (horizontal lines) for the Friday close vs. two key credit cycle periods in June 2007 and the end of 1997. We also include the UST curves for those dates. We see how low the UST curve is now vs. June 2007 and Dec 1997, and that is the main story with OAS compressed in all of these periods above.
It is worth noting that 1997 then saw two more years of credit excess while June 2007 was ticking and the summer of 2007 started the rampant mortgage market turmoil (hedge fund canaries started to drop) and worsening bank system problems (BofA bails out Countrywide).
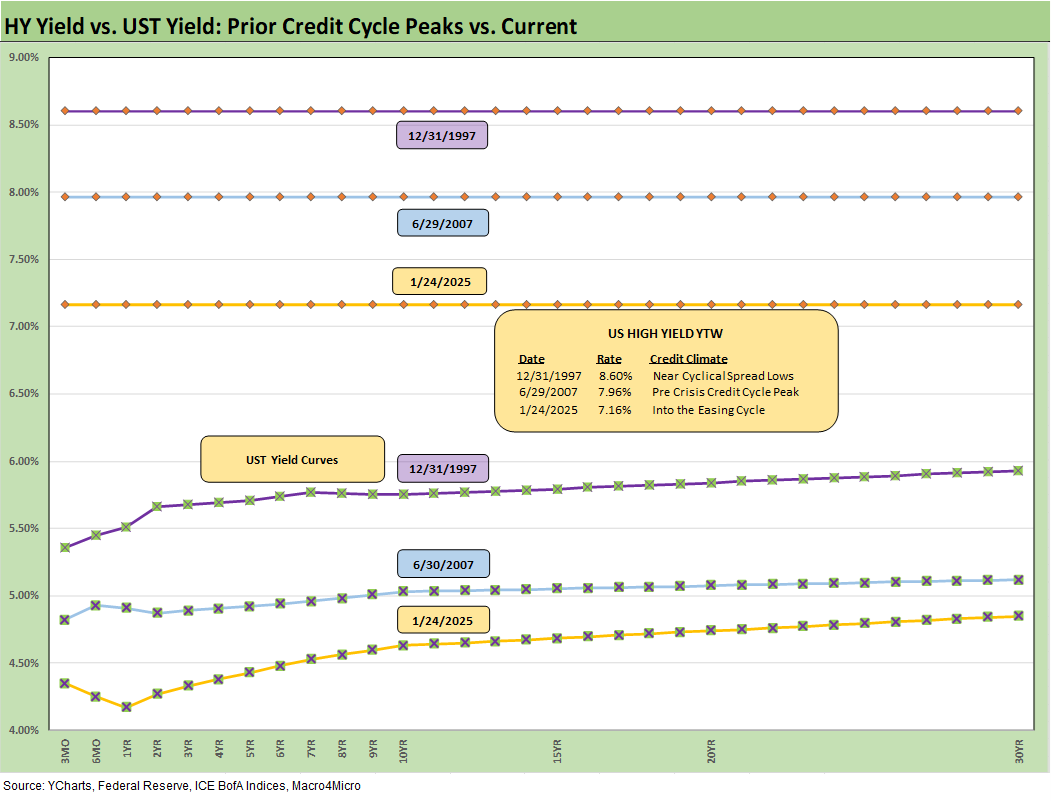
We do the same exercise for HY index YTW that we did in the prior chart for IG. Compressed spreads in each of those markets make the UST curve the swing vote on all-in yields. While spreads are compressed in all three, it is an easy case to make that the current market is a higher quality mix with the high BB tier mix at over half and the fact that the most aggressively leveraged deals (notably private equity leveraged deals) have migrated to private credit.
See also:
Footnotes & Flashbacks: State of Yields 1-26-25
Footnotes & Flashbacks: Asset Returns 1-26-25
Mini Market Lookback: Policy Blitz Formation 1-25-25
Existing Home Sales Dec 2024: Another “Worst Since” Milestone 1-24-25
Top 10 Fun Facts on Past Presidents and their Economies 1-20-25
Industrial Production Dec 2024: Capacity Utilization 1-17-25
Housing Starts Dec 2024: Good Numbers, Multifamily Ricochet 1-17-25
Retail Sales Dec 2024: A Steady Finish 1-16-25
CPI Dec 2024: Mixed = Relief These Days 1-15-25
KB Home 4Q24: Strong Finish Despite Mortgage Rates 1-14-25
United Rentals: Bigger Meal, Same Recipe 1-14-25
Mini Market Lookback: Sloppy Start 1-11-25
Payroll Dec 2024: Back to Good is Bad? 1-10-25
Payroll % Additions: Carter vs. Trump vs. Biden…just for fun 1-8-25
JOLTS: A Strong Handoff 1-7-25
Annual GDP Growth: Jimmy Carter v. Trump v. Biden…just for fun 1-6-25
Mini Market Lookback: Mixed Start, Deep Breaths 1-5-25
Tariff links:
US-Canada: Tariffs Now More than a Negotiating Tactic 1-9-25
Trade: Oct 2024 Flows, Tariff Countdown 12-5-24
Mexico: Tariffs as the Economic Alamo 11-26-24
Tariff: Target Updates – Canada 11-26-24
Tariffs: The EU Meets the New World…Again…Maybe 10-29-24
Trump, Trade, and Tariffs: Northern Exposure, Canada Risk 10-25-24
Trump at Economic Club of Chicago: Thoughts on Autos 10-17-24
Facts Matter: China Syndrome on Trade 9-10-24
Trade Flows: More Clarity Needed to Handicap Major Trade Risks 6-12-24
Trade Flows 2023: Trade Partners, Imports/Exports, and Deficits in a Troubled World 2-10-24
Trade Flows: Deficits, Tariffs, and China Risk 10-11-23
Midyear Trade Flows: That Other Deficit 8-10-23
State of Trade: The Big Picture Flows 12-18-22
Select Histories:
HY and IG Returns since 1997 Final Score for 2024 1-2-25
Spread Walk 2024 Final Score 1-2-25
Footnotes & Flashbacks: Asset Returns for 2024 1-2-25
Credit Returns: 2024 Monthly Return Quilt Final Score 1-2-25
Annual and Monthly Asset Return Quilt 2024 Final Score 1-2-25
HY and IG Returns since 1997: Four Bubbles and Too Many Funerals 12-31-24
Spread Walk: Pace vs. Direction 12-28-24
Annual and Monthly Asset Return Quilt 12-27-24
Credit Returns: 2024 Monthly Return Quilt 12-26-24
HY OAS Lows Memory Lane: 2024, 2007, and 1997 10-8-24
HY Industry Mix: Damage Report 8-7-24
Volatility and the VIX Vapors: A Lookback from 1997 8-6-24
HY Pain: A 2018 Lookback to Ponder 8-3-24
Presidential GDP Dance Off: Clinton vs. Trump 7-27-24
Presidential GDP Dance Off: Reagan vs. Trump 7-27-24
The B vs. CCC Battle: Tough Neighborhood, Rough Players 7-7-24
HY Spreads: Celebrating Tumultuous Times at a Credit Peak 6-13-24
Credit Markets Across the Decades 4-8-24
Credit Cycles: Historical Lightning Round 4-8-24
Histories: Asset Return Journey from 2016 to 2023 1-21-24
HY vs. IG Excess and Total Returns Across Cycles: The UST Kicker 12-11-23
HY Multicycle Spreads, Excess Returns, Total Returns 12-5-23
US Debt % GDP: Raiders of the Lost Treasury 5-29-23
 |
|